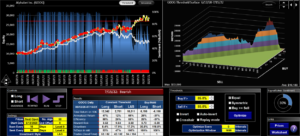
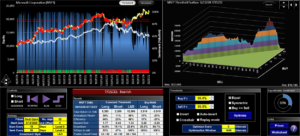
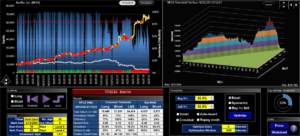
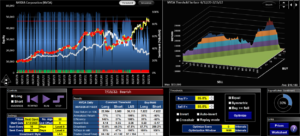
Bitcoin trading strategy using SignalSolver Sentiment

Bitcoin Trading Strategy using SignalSolver Sentiment

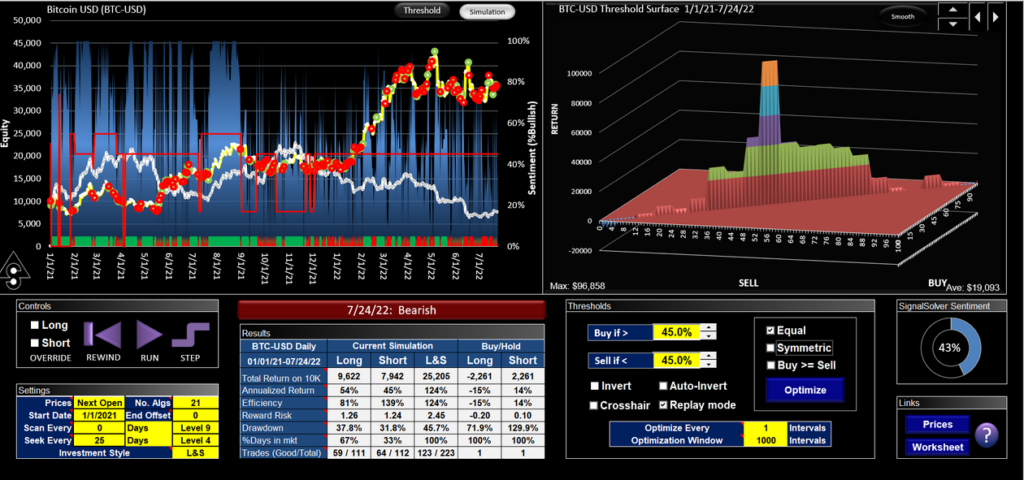
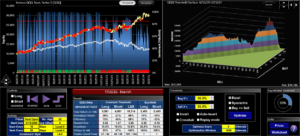
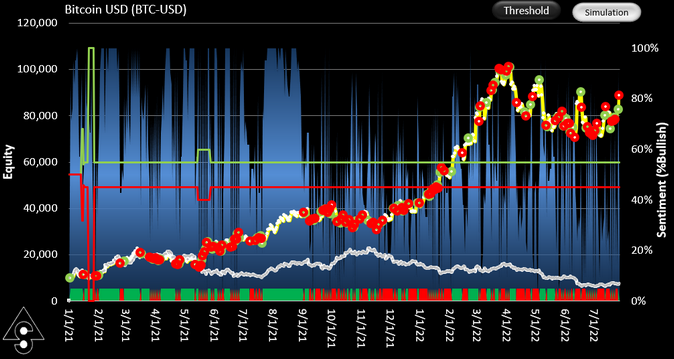
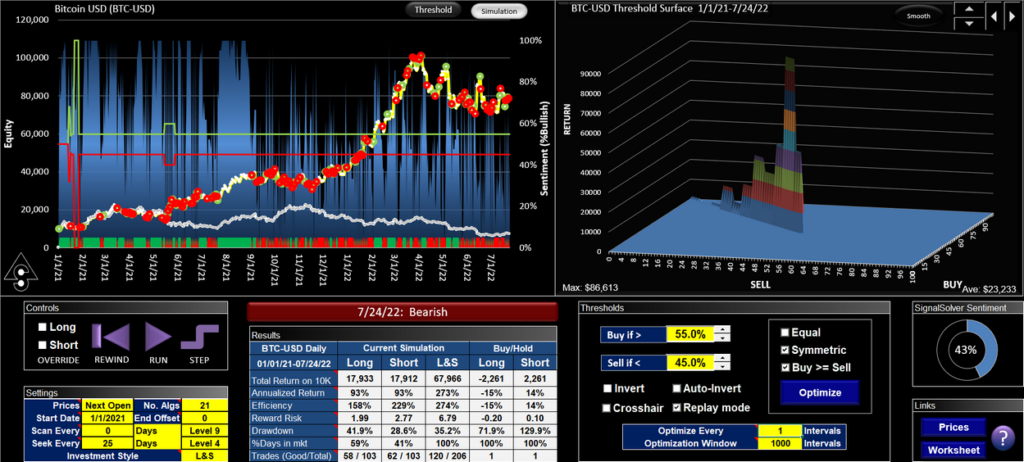
This trading strategy for Bitcoin uses SignalSolver Sentiment to generate trading signals. It is currently showing a 22% drawdown, but it has been a good performer overall. Sentiment on any given day is determined by backtesting up to that day, selecting the top algorithms and evaluating the ratio of long to short positions. Sentiment (percentage bullish) is shown as a blue bar-chart on the graph. Trading is performed subsequent to the Sentiment crossing a threshold value.

The Buy and Sell thresholds for this simulation (green and red lines on the time graph) used an adaptive technique every cycle to determine the optimum values, with the constraints Buy+Sell=100% and Buy>Sell. The optimum thresholds settled down pretty quickly to Buy=55% and Sell=45%. Return was $67,966 since 1/1/21 for a $10,000 outlay (CAGR 0f 273%), with Risk-Reward about 680 times that for Short-hold. The simulations assume the ability to both long and short the security, but the table includes both the Long and Short returns

Bitcoin trading using SignalSolver Sentiment with adaptive symmetric thresholds

Bitcoin trading using SignalSolver Sentiment with adaptive symmetric thresholds

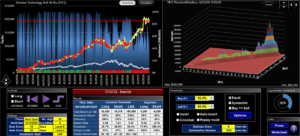
In selecting a threshold strategy, you couldn't get into too much trouble since the other two common threshold strategies also showed a profit. Using an adaptive threshold with the Buy=Sell constraint applied returned $25,206 (123% CAGR)--

Bitcoin trading using SignalSolver Sentiment, adaptive equal thresholds

Bitcoin trading using SignalSolver Sentiment, adaptive equal thresholds

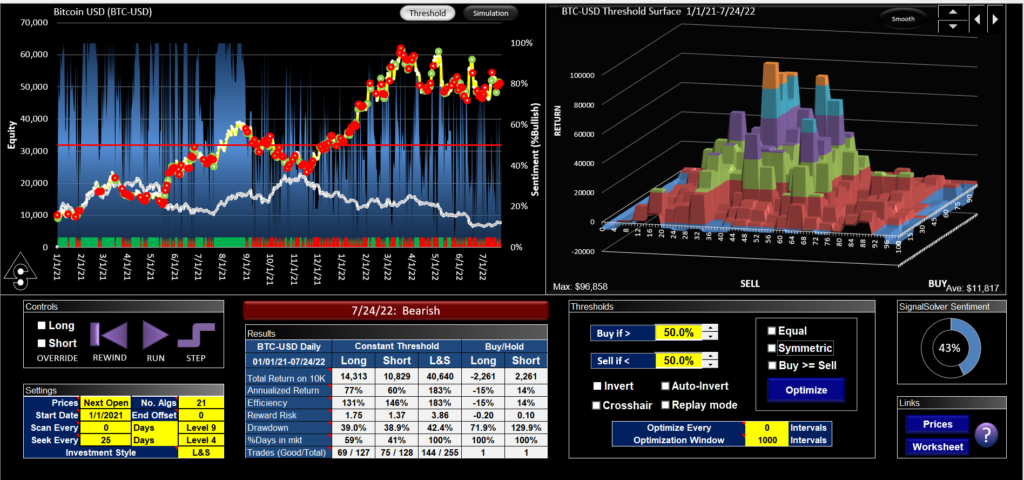
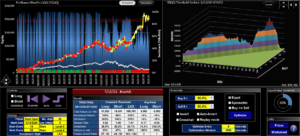
Finally applying a simple constant 50% threshold also worked well, returning $40,640 (183% CAGR).  From this image you can view the entire threshold surface, which is  what we like to see--a solid looking structure.

Bitcoin trading using SignalSolver Sentiment with a fixed 50% threshold

Bitcoin trading using SignalSolver Sentiment with a fixed 50% threshold

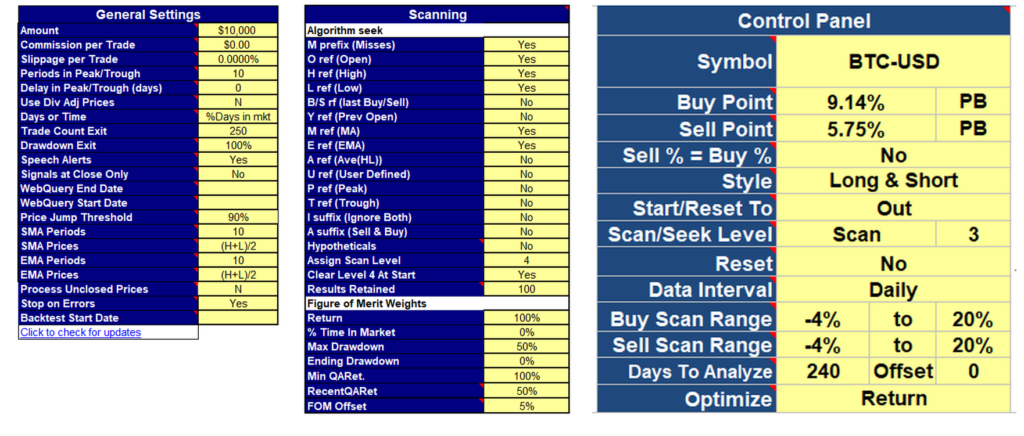
Settings are shown below:

SignalSolver settings for the Bitcoin Sentiment runs

SignalSolver settings for the Bitcoin Sentiment runs

These are the same settings we used for TQQQ with the only change being that we (somewhat arbitrarily) increased the number of algorithms to 21 (from 5 for TQQQ).  Only OHLC prices and short period (10 day) SMAs and EMAs are used in the backtests.

As with all Sentiment runs, out-of-sample walk-forward simulation is used. Sentiment is determined for a particular day by using the backtester on prior data, in this case using the ratio of the top 21 algorithms' long (bullish) to short (bearish) state. When the sentiment crosses the threshold in either direction, a trade is performed appropriately. In the case of Bitcoin, OHLC prices run from midnight to midnight.
TQQQ

AAPL signals prove versatile

AAPL signals prove versatile

Work on TQQQ, FNGU, NFLX and many others


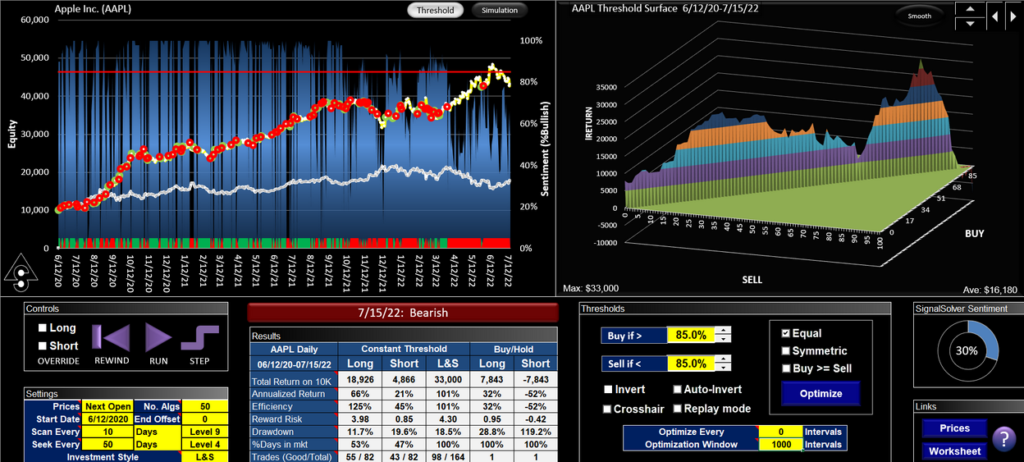
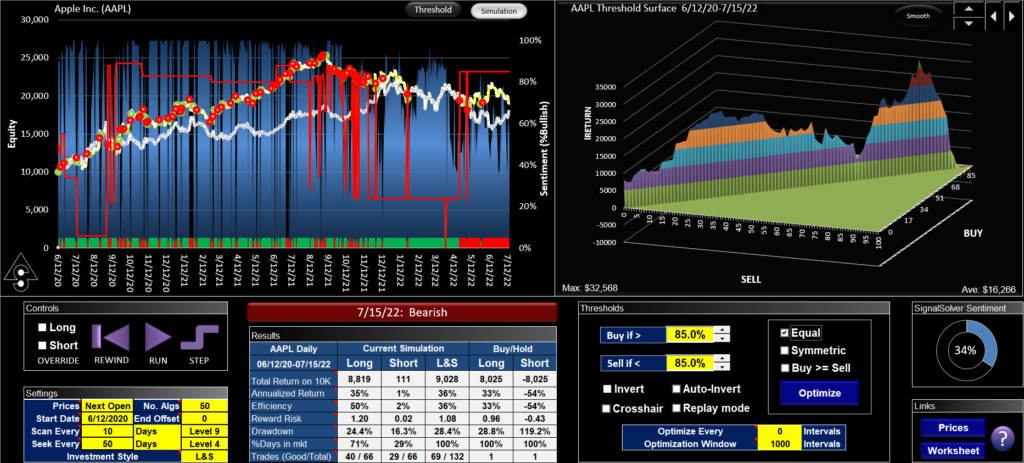
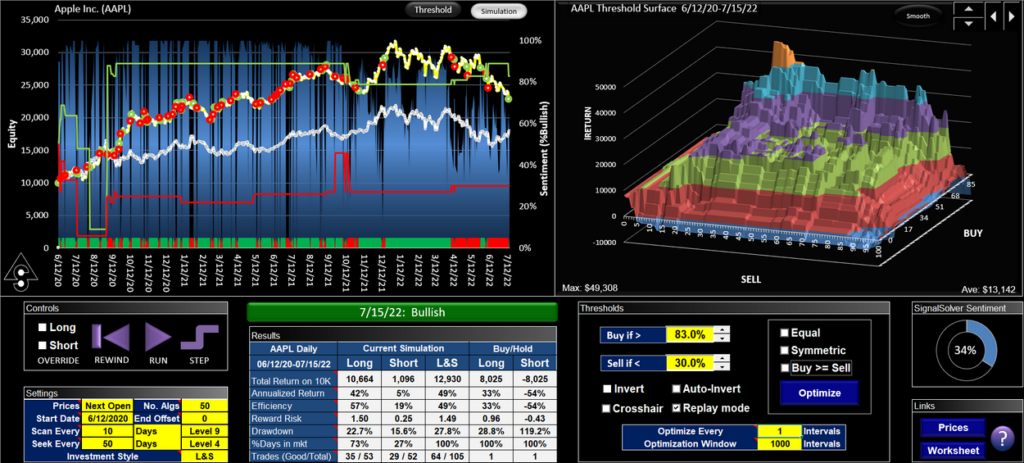
The SignalSolver Sentiment indicator is calculated by aggregating multiple algorithm sentiments. The Sentiment technical indicator has a value between 0% (completely bearish) to 100% (completely bullish). Intuitively, you would think that a 50% threshold would be the best threshold value from which to generate buy and sell signals, and often this is the case. However, in the case of AAPL, the overall best Buy=Sell threshold (for the settings we are using) has been 85%. The result is shown below in the "L&S" column of the table:

AAPL performance using an 85% threshold

AAPL performance using an 85% threshold

The buy/sell signals generated by this algorithm have shown surprising versatility. Below are shown images showing the result of using the AAPL signals for AMZN, FB, FNGU, GOOG, MSFT, NFLX, NVDA, QQQ, TECL and TQQQ. In each case the result was better than both buy-hold and short-hold, often by an enormous margin.

The AAPL 85% Threshold

Success at using Sentiment to signal trades comes down to finding the best threshold to use. There are always values for the buy and sell threshold that generate equal or better returns than both buy-hold and short-hold. But you can only know these values retrospectively.

There was no way to predict that an 85% threshold would be optimum. However we can simulate (or run live) using an adaptive thresholds where the program optimizes the thresholds daily as you go along. When using this method, (as you might do in reality) the Buy=Sell constrained threshold was in the 80-90% range from Sept 2020 to Aug 2021 but then became unstable, with declining returns.

AAPL signal performance using adaptive threshold with constraint Buy=Sell

AAPL signal performance using adaptive threshold with constraint Buy=Sell

The threshold surface (shown below) is a very nice solid structure yielding a positive return for all constant values of threshold except the extreme edges. Notably, 50/50 yielded a return of twice that of buy-hold. The Buy>Sell adaptive threshold (also shown below) gave a better return than the Buy=Sell adaptive threshold, Here we optimize the thresholds every cycle as before.

AAPL Result using adaptive threshold with Buy>Sell constraint

AAPL Result using adaptive threshold with Buy>Sell constraint

Comparing the two results, you can see that when the Buy=Sell constraint is applied, the adaptive threshold appears to oscillate between the optimum buy threshold region and the optimum sell threshold region.

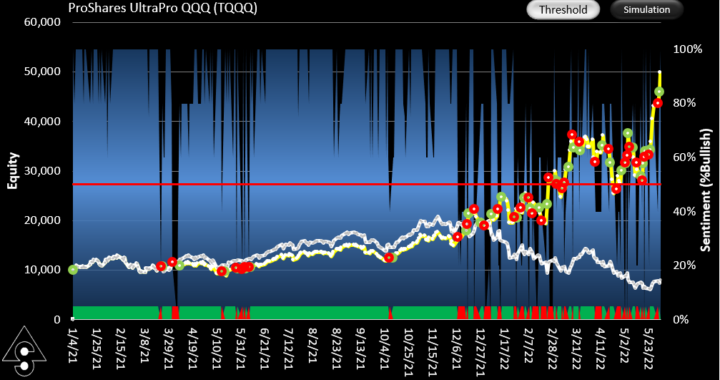
TQQQ trading strategy result

TQQQ Trading Strategy using SignalSolver Sentiment

TQQQ Trading Strategy using SignalSolver Sentiment

Post Updated June 29th 2022

This trading strategy for TQQQ uses SignalSolver Sentiment to generate trading signals.

We are updating the original post using improved settings. Two settings have been changed:

  1. The new post uses a Seek level of 4 instead of 2. So more algorithms are explored (although it takes a little longer)
  2. "A" suffix algorithms (those which buy and sell on the same day) have been excluded

The combined effect of these changes was to double the annualized return from 213% to 425%

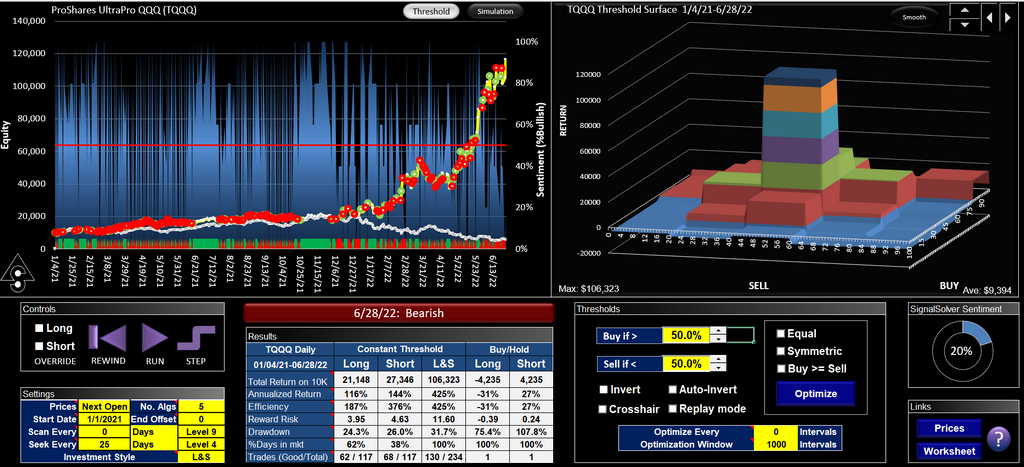
Showing sentiment dashboard for the TQQQ run

Trading TQQQ using SignalSolver Sentiment would have yielded 425% annual return

50% Threshold is still the optimum, as you can see from the threshold surface. Additionally, this Sentiment run is 17 trading days further along than the Original Post, in which time the return has increased another 20% or so.

Trading FNGU using TQQQ signals

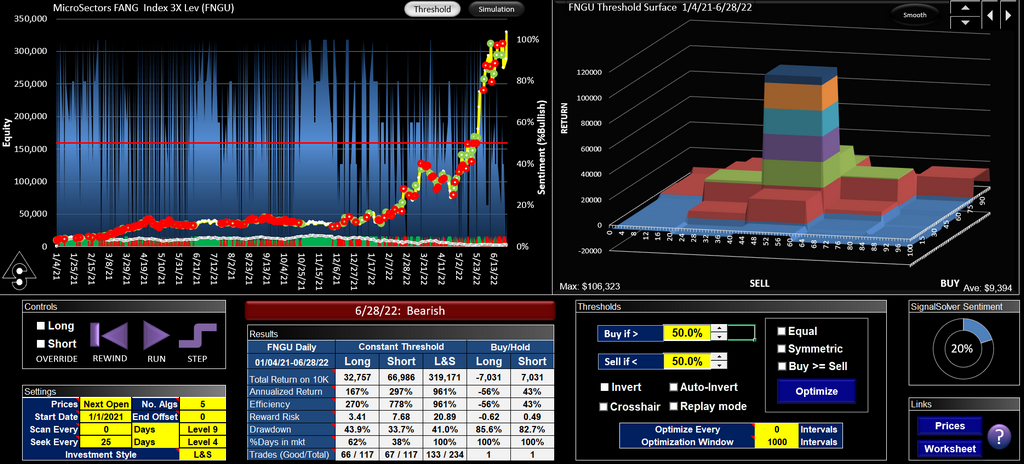
The signals generated by TQQQ Sentiment have been found to work well for FNGU (and many other symbols also):

Showing the Sentiment Dashboard for FNGU

When traded using TQQQ Sentiment signals, FNGU would have yielded 961% annualized return

This is the same Sentiment profile as generated by TQQQ, but the signals are used to trade FNGU (easy to simulate in SignalSolver, just change the symbol). Here the annualized return was 961%.

The settings for these runs are exactly the same as the Original Post (click below), with the two changes noted above.

Click to view the original post Dated June 2nd 2022


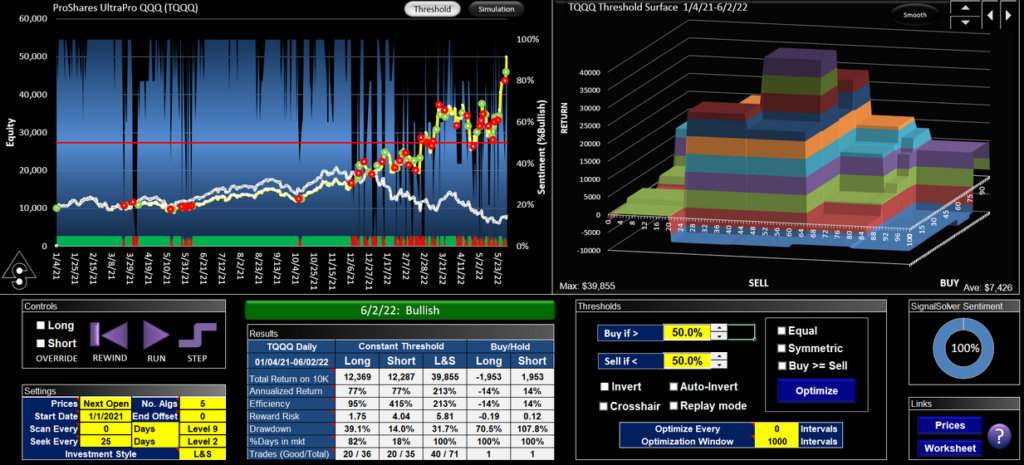
This TQQQ trading strategy using SignalSolver Sentiment gave 213% annualized return for the period Jan 4th 2021 to June 2nd 2022. The sentiment threshold was set to 50% for the entire period.

Sentiment run for TQQQ showing 213% Annualized Return

TQQQ Sentiment Run showing 213% Annualized Return. Notice good symmetry and structure on the Threshold Surface.

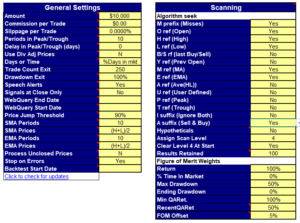
Settings are shown below:

Settings Tab settings

Settings Tab

Notice that only OHLC prices and short period (10 day) SMAs and EMAs are used in the backtests.

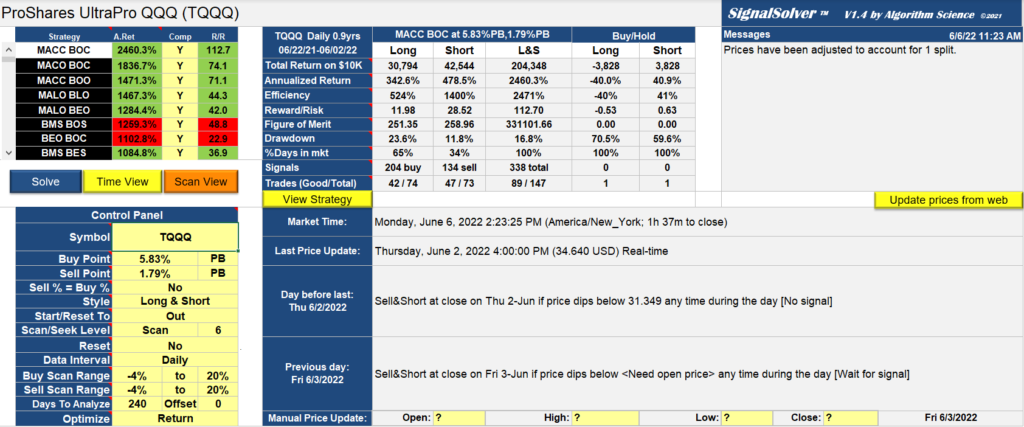
Below are shown the Report Tab settings, notably 240 days of data were used for the backtests, and only percentage band was used (PB).  As with all Sentiment runs, out-of-sample walk-forward simulation is used. Sentiment is determined for a particular day by using the backtester on prior data, using the top 5 algorithms’ long or short state. If the sentiment crosses the 50% threshold in either direction, a trade is performed appropriately.

Report Tab Settings.

Report Tab Settings.

SOXL Trading Strategy using SignalSolver Sentiment

SOXL trading strategy using SignalSolver Sentiment

Another Sentiment driven trading strategy

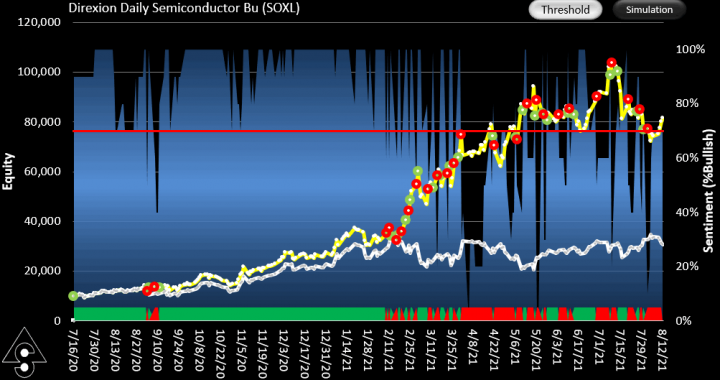
Showing the equity curve for constant threshold

Showing the equity curve for constant threshold

Methodology

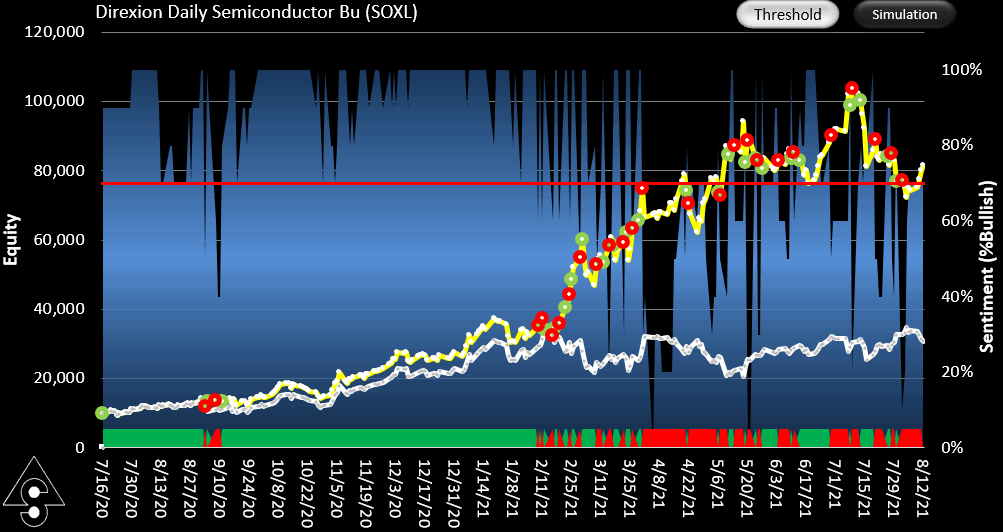
In the same vein as the previous few posts, this is another SOXL trading strategy using SignalSolver sentiment, this time we use a threshold of 70%. For a full explanation of the SignalSolver sentiment methodology and how to interpret the simulation results, please click here.

The 70% threshold showed up as the optimum mid May 2021, (below) so we will start our paper trading with that value. The constant threshold result is shown above, but this is a backtest not a walk-forward test as shown below. The equity curve is currently showing a good deal of drawdown at 21%. However let's see what happens with SOXL since it shows nice structure on the threshold surface. Is it breaking down? or will it pick up and perform well like it has in the past.
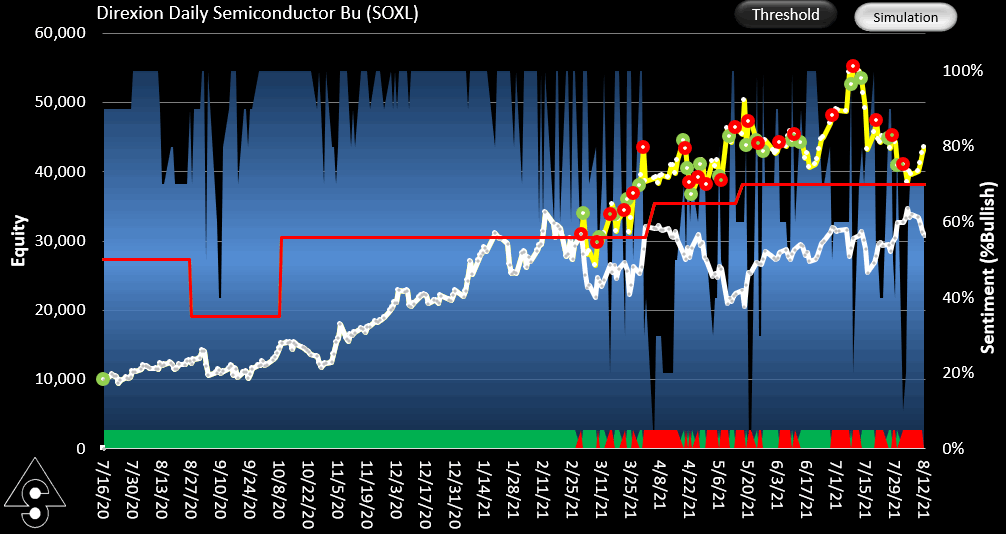
The equity curve for simulation using adaptive thresholds

SOXL trading equity curve for simulation using adaptive thresholds

Performance

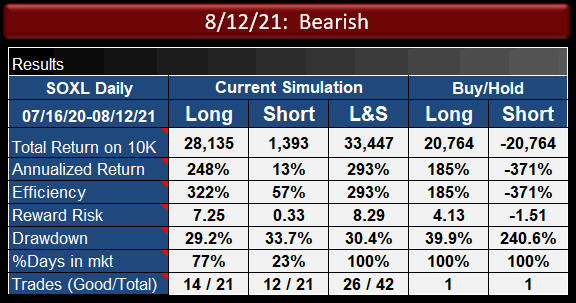
Performance of the simulation

Performance of the simulation

Trading on sentiment (L&S column above) performed around 2 times better in this simulation than buy-hold in terms of reward/risk, with annualized return (CAGR) being around  1.6 times better for Long/Short trading of the signals and trading long only being, unsurprisingly, most of the gain. In all cases, drawdown was lower for the sentiment trading than for buy-hold. Its easy to forget that what you really want from a trading strategy is not necessarily to beat both long-hold and short-hold, which is quite hard to do for something with a high annualized return,  but simply keeping on the right side of profitability has a lot of merit. This strategy exceeded that goal so far.
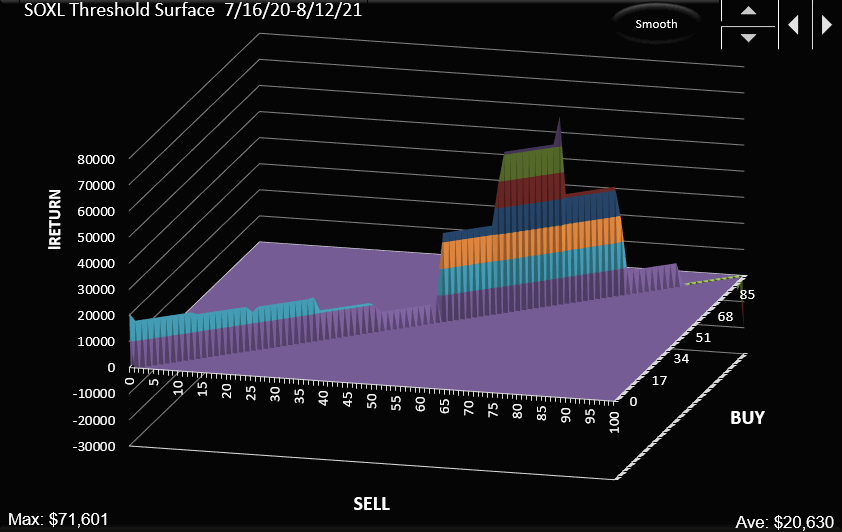
Below is the threshold surface for the entire window of 7/16/20 through 8/12/21, showing a good structure, but with somewhat of a offset. Ideally I would like to see the structure centered on 50% which would mean that the backtests are more neutral in their sentiment reading, but this may correct in the future.

Partial threshold surface for the simulation, equal buy and sell thresholds

Partial threshold surface for the simulation--equal buy and sell thresholds

Click here to see the SignalSolver settings for this strategy: SOXL Sentiment Settings

We now move into the paper-trading phase for this project. Updates will be shown below.

Updates

Updates to this strategy and current sentiment were reported on another page up until 4th Feb 2022 when the SOXL algorithm was reporting a 4% loss (from the go-live trading date of 16th July 2021) compared to a gain of 23% in the underlying stock. Lets look at strategies which worked better.

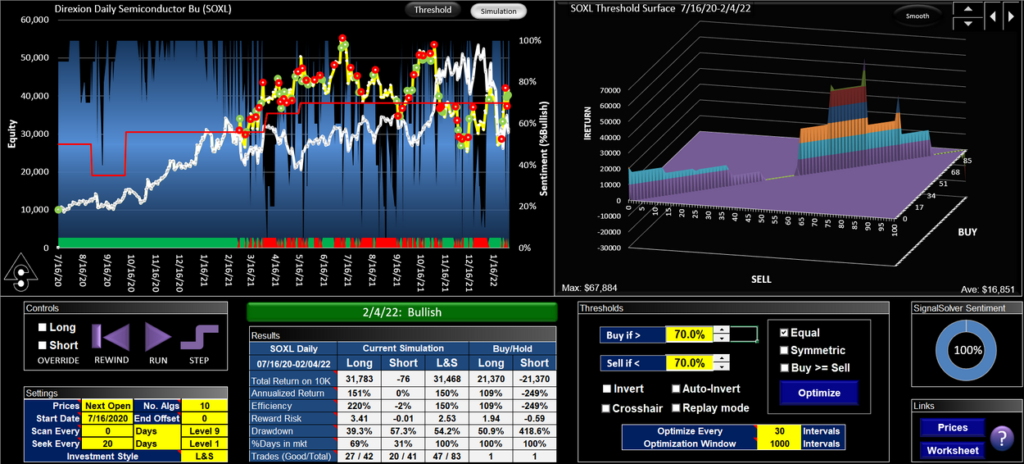
We have reported success with AAPL, TQQQ and FNGU in using an adaptive threshold instead of a fixed threshold. However with SOXL we were actually using an adaptive threshold to start with. Here is the dashboard as of Feb 4th 2022:

SOXL trading algorithm--performance until Feb 4th 2022

SOXL trading using SignalSolver sentiment and an adaptive threshold. The buy and sell thresholds are constrained to be equal. This turned out not to be the best choice

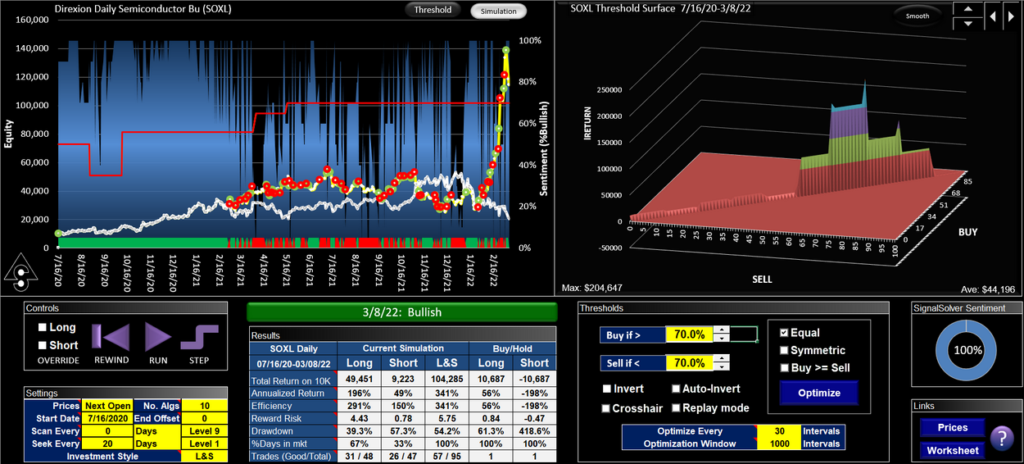
We constrain the buy and sell thresholds to be equal. We optimize the threshold every 30 trading days and use a window of 1000 trading days (effectively including all the sentiment data points every optimization). As we mentioned, this led to a 4% loss on Feb 4th. However, as of March 8th 2022, the algorithm has recovered and shown dramatically better performance than buy-hold, currently showing a 164% gain (July 16th 2021 to March 8th 2022) vs a 19% loss for buy-hold.

SOXL algorithm as of 3/8/22

SOXL algorithm performance using SignalSolver Sentiment as of March 8th 2022. It has recovered from the Feb 2022 drawdown and reached new heights

Its important to know that the result you are looking at was fully reslizable. We outlined the strategy in the original post last August and if you had set up the algorithm as detailed above and followed it's signals as we walked forward, you would have made these returns.

Using Symmetrical thresholds

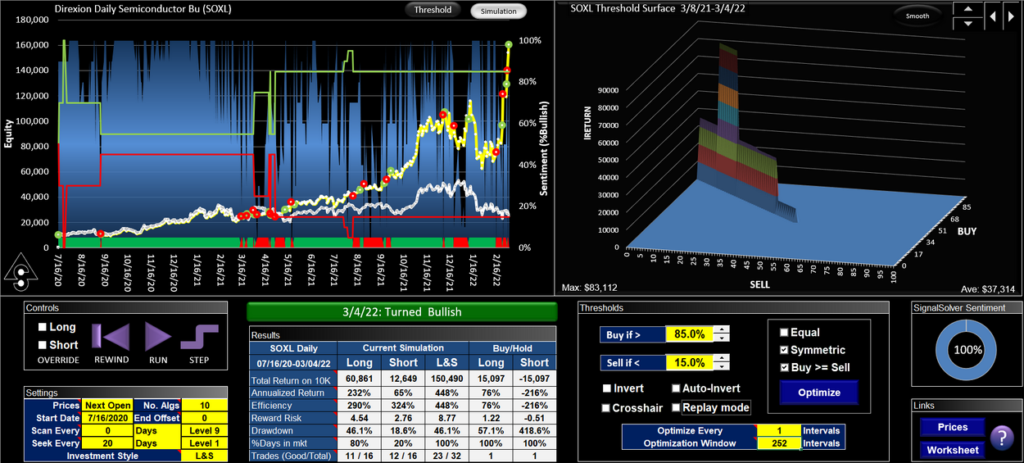
An even better algorithm would have been to use Symmetrical thresholds where the buy and sell thresholds sum to 100%. We optimize the thresholds every day and use a one year optimization window (252 trading day). We also apply the constraint that the buy threshold is greater than the sell threshold.

SOXL trading strategy using SignalSolver sentiment, but with symmetrical thresholds

SOXL trading strategy using SignalSolver sentiment. The same sentiment plot as above, but with the adaptive thresholds set to by symmetrical.

Using these thresholds would have yielded a gain of 133% for the test period 16th July 2021 to Feb 4th 2022. As of today (3/6/2022) it is showing a 399% profit vs. a 2% loss for the underlying stock from 16th July 2021. This is the same methodology that worked well for AAPL. Here, we haven't changed the way the sentiment is generated (the Settings section is the same and the blue bar-chart is the same), we have only changed the way we handle the buying and selling thresholds for that same sentiment profile. Using freely floating adaptive thresholds (Buy threshold>=Sell threshold) gave a very similar result.

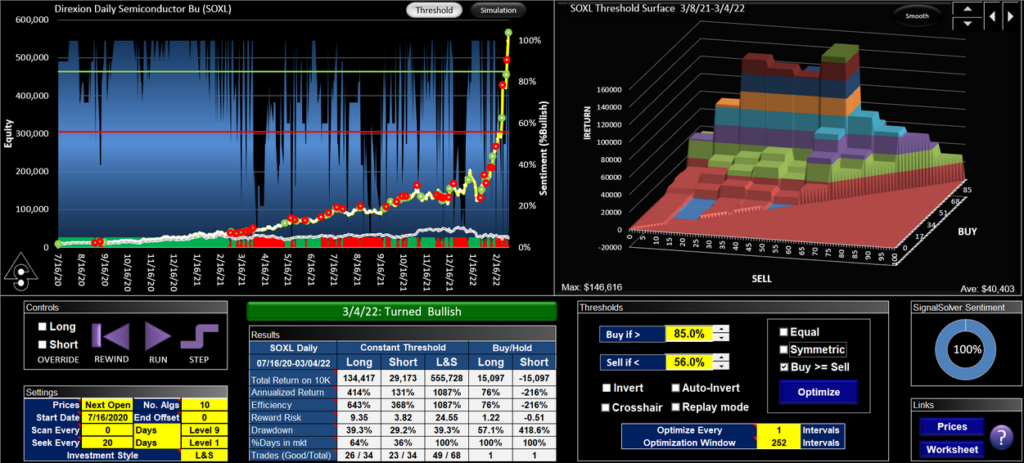
The best constant thresholds for overall gains were 85% buy and 56% sell, shown below. These thresholds were established in July 2021, but the optimum sell threshold shifted several times subsequently, so this was only realizable if you had made a lucky guess.

SOXL trading using SignalSolver Sentiment and a pair of constant buy and sell thresholds

SOXL Sentiment trading using constant 85% buy threshold and 56% sell threshold. Sadly, there was no way to know in advance that these thresholds would have good performance.


TQQQ Trading strategy using SignalSolver Sentiment

TQQQ trading using SignalSolver Sentiment

Using multiple algorithms to drive trading strategy

Original Post July 25 2021

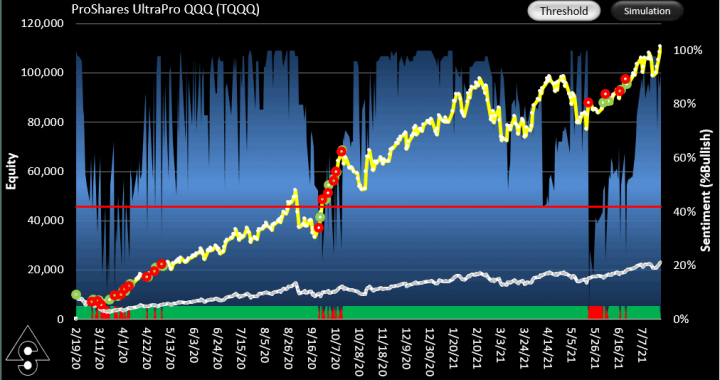
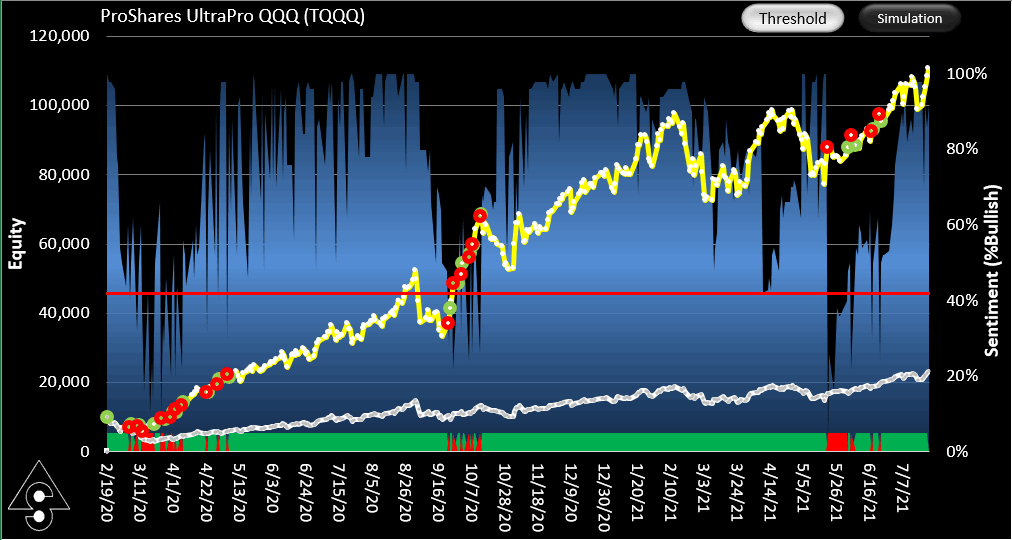
Equity curve for the TQQQ SignalSolver Sentiment trading simulation.

Equity curve for the TQQQ SignalSolver Sentiment trading simulation

Sentiment

Sentiment usually refers to an analyst opinion on whether a financial instrument will increase in value (bullish sentiment), or decrease (bearish sentiment). However, in this TQQQ trading strategy using SignalSolver sentiment we are combining the opinion of multiple backtest algorithms to derive sentiment.

Methodology

Shown above is the simulated result of trading TQQQ using SignalSolver Sentiment. The sentiment is shown as a blue area chart in the background. The equity curve for the strategy is shown in yellow, buy-hold equity in white. Sentiment is calculated each day after the close of business by assessing what percentage of the top 50 SignalSolver backtest algorithms are bullish. The buy and sell thresholds are fixed at 42% (red line) with bullish being above the threshold. A trade is executed at the next open whenever a change in sentiment is indicated, so the trade price is always out-of-sample from the backtest period which is fixed at 200 trading days. The simulation then walks forward to the next day, repetitively. Algorithms are re-parametrized every 4 calendar weeks and flushed and refreshed every 30 calendar weeks.

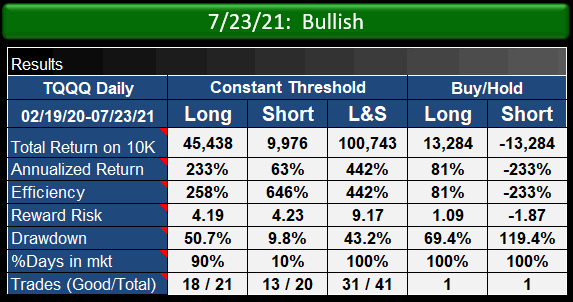
Performance of the TQQQ strategy compared to buy-hold

Performance of the TQQQ strategy compared to buy-hold

Performance

Trading on sentiment (L&S column above) performed around eight times better in this simulation than buy-hold in terms of reward/risk, with final equity being around seven times better for Long/Short trading of the signals and trading long only being about three times as good. In all cases, drawdown was lower for the sentiment trading than for buy-hold.

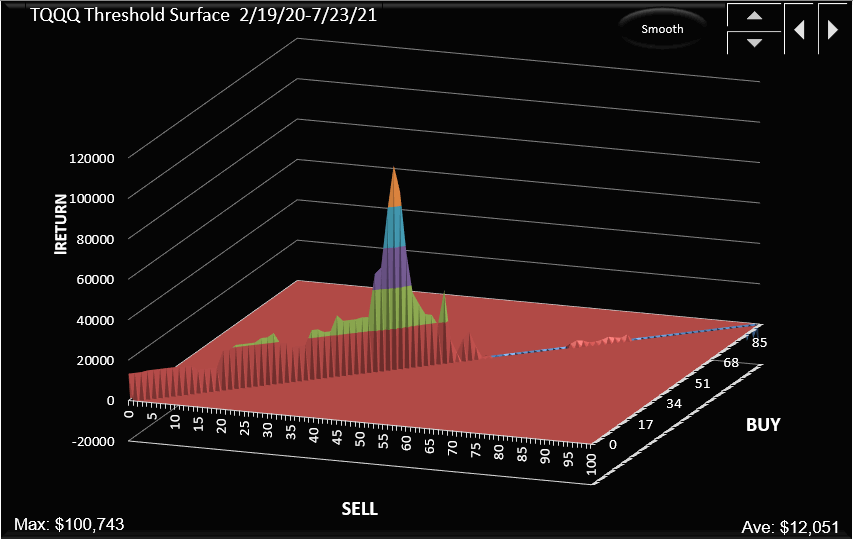
Below is shown the threshold surface for the equal buy/sell thresholds showing that annualized return (CAGR) is sensitive to threshold changes. A 43% optimum threshold was established in April 2020, switching to 42% in April 2021. Optimizing the threshold every 5 trading days would have yielded a return of $65,651 (See Settings .pdf). A 50% threshold would have yielded $35,747. All thresholds between 15% and 50% would have beaten buy-hold. We will continue with the 42% threshold for now even though we may be over-optimized at this value.

Threshold surface for the TQQQ strategy, for equal buy and sell thresholds.

Threshold surface for the TQQQ strategy, for equal buy and sell thresholds.

Click here to see the SignalSolver settings for this strategy: TQQQ Sentiment Settings

We now move into the paper-trading phase for this project. Updates will be shown below.

Updates

We reported the progress of this algorithm daily as we paper traded here. Below we show where we ended up when we stopped tracking it.

TQQQ trading algorithm. We paper traded this from 16th July 2021 until Feb 4th 2022.

We used constant thresholds of 42% buy, 42% sell for TQQQ which worked quite well until the end of 2021 after which we saw a dramatic fall.

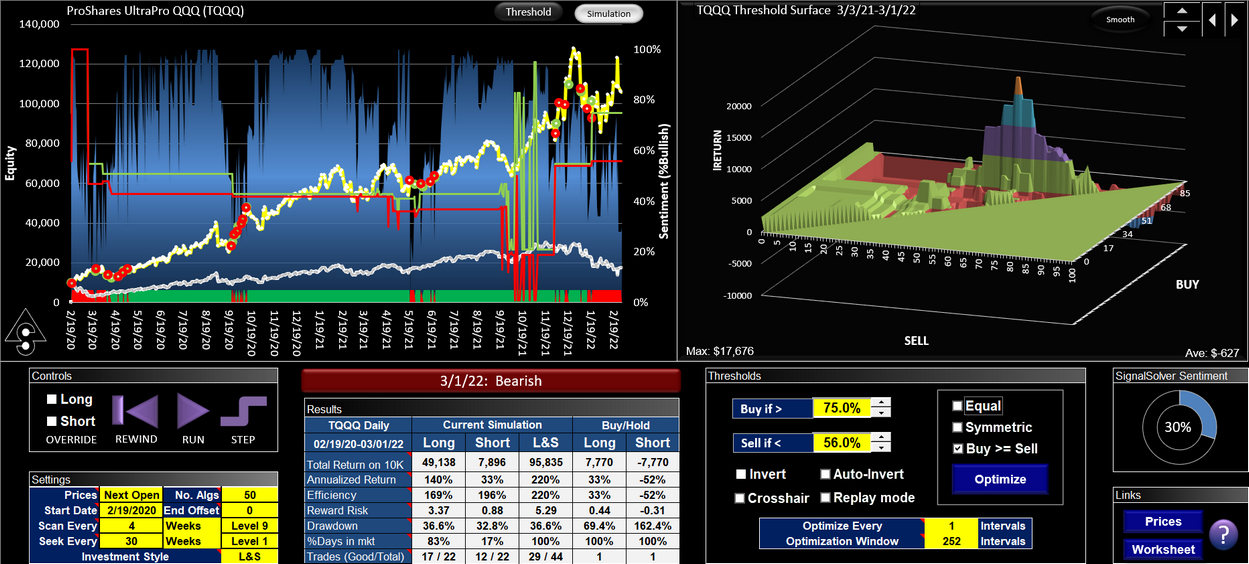
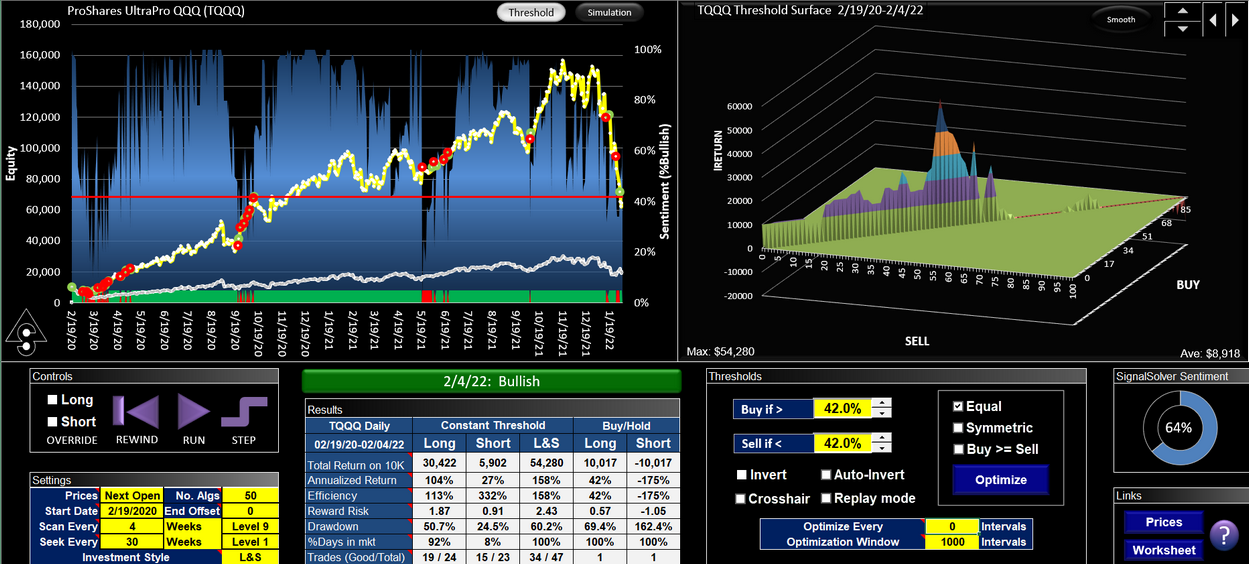
We stopped live paper trading on Feb 4th 2020 with TQQQ being down about 35% since we started paper trading on 16th July 2021. We now ask what, if anything, could have been done better. Well, similarly to AAPL, we would have done much better using adaptive thresholds. Below is an example using a threshold optimization window of 252 days or one trading year, and optimizing the thresholds every day. Using this technique, instead of making a 35% loss, we would have made a profit of 47%. The underlying stock lost 4% in the same period. As of this writing (March 1st 2022) the algorithm is up 63% while the stock is down 15% from its July 16th 2021 value. The algorithm uses the exact same sentiment profile as the original, only the buy and sell thresholds are handled differently.

Note that unlike AAPL, we do not force symmetrical thresholds, we let the thresholds float freely. The peak on the threshold surface is not at a symmetrical point.

TQQQ traded using SignalSolver Sentiment with an adaptive threshold

TQQQ traded using SignalSolver sentiment which is the blue bar chart in the background. The buy threshold is the green line and the sell threshold is the red line. The algorithm equity curve is yellow, buy-hold equity is the white line.

Overall the algorithm traded with a reward/risk about 12 times better than the underlying stock. This is a backtest so it doesn't mean that returns will continue, however we will track it over the next few months to see if it holds up.

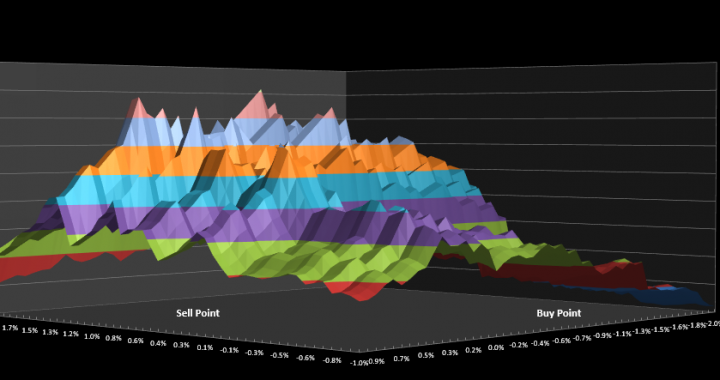
GASX Signals Parameter Surface

GASX Daily (ACS BCS)

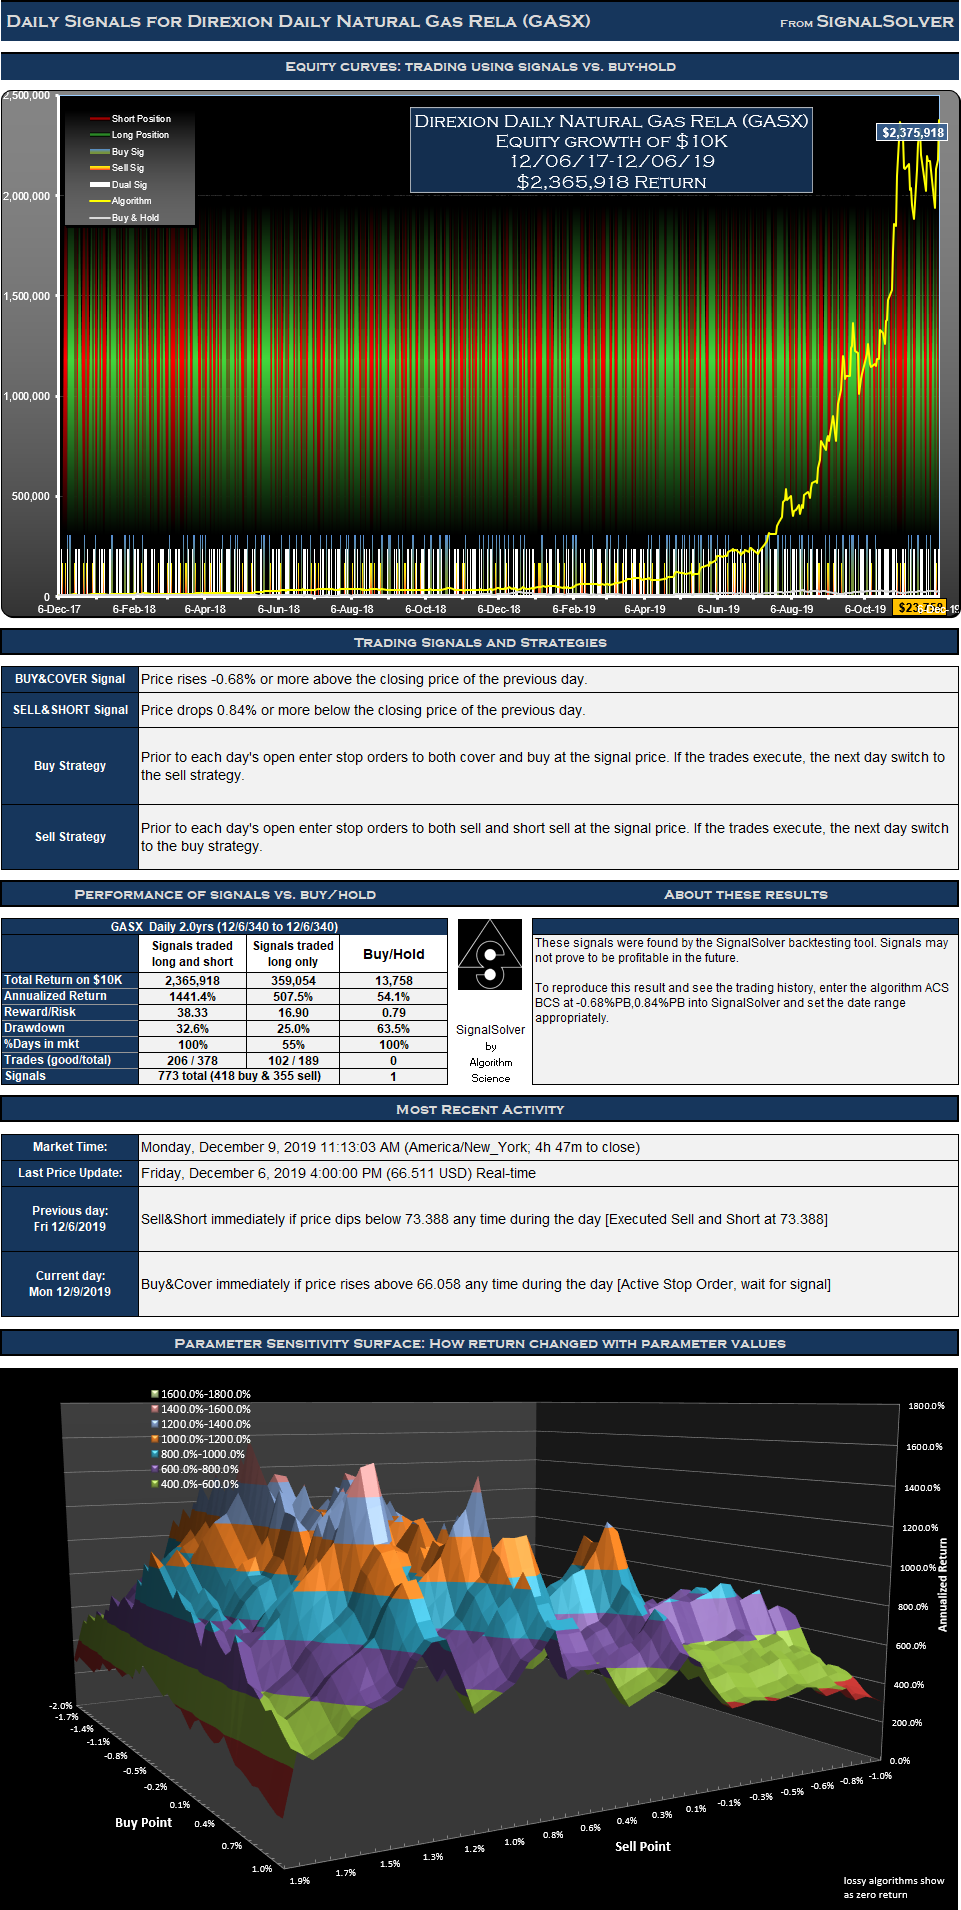
These Direxion Daily Natural Gas Related Bear 3X Shares (GASX) signals traded as directed would have provided returns around 172.0 times better than buy-hold for the period 06-Dec-17 to 06-Dec-19.

GASX Signal Performance

GASX Signals

I was able to optimize this algorithm for around $4m return, but I backed off the optimization a bit to account for lifetime and drawdown factors. The trading signals for Direxion Daily Natural Gas Related Bear 3X Shares (GASX) were selected for their reward/risk, longevity and parameter sensitivity characteristics. Backtests don't always generate reliable signals which can be counted on moving forward but many traders find value in knowing what buy and sell signals would have worked well in the past.

You may think the returns are unrealistically high, but the numbers presented are exactly what the strategy would have returned if followed as described (check the math if you are at all dubious). But as noted above, what the future holds is completely unknown.

Returns for the Direxion Daily Natural Gas Rela (GASX) signals

For the 504 day (2.0 year) period from Dec 6 2017 to Dec 6 2019, these signals for Direxion Daily Natural Gas Related Bear 3X Shares (GASX) traded both long and short would have yielded $2,365,918 in profits from a $10,000 initial investment, an annualized return of 1441.4%. Traded long only (no short selling) the signals would have returned $359,054, an annualized return of 507.5%. 54.9% of time was spent holding stock long. The return would have been $13,758 (an annualized return of 54.1%) if you had bought and held the stock for the same period.

Signals and Trades

We call this a daily strategy as daily OHLC data is used in the numerical analysis leading to at most one buy signal and one sell signal per day. However, not all signals result in trades. If you are already long in a security, buy signals are not acted upon, similarly if you are short you should ignore sell signals. There were 418 buy signals and 355 sell signals for this particular GASX strategy (270 dual signal days) which in turn led to 188 round trip long trades of which 102 were profitable, and 189 short trades of which 104 were profitable.

Drawdown and Reward/Risk

Drawdown (the worst case loss for an single entry and exit into the strategy) was 33% for long-short and 25% for long only. This compares to 63% for buy-hold. The reward/risk for the trading long and short was 38.33 compared to 0.79 for buy-hold, a factor of 48.5 improvement. If traded long only, the reward/risk was 16.90. We use drawdown plus 5% as our risk metric, and annualized return as the reward metric.

The backtests assume a commission per trade of $7. Returns have been adjusted for 6 dividends.

Parameter sensitivity

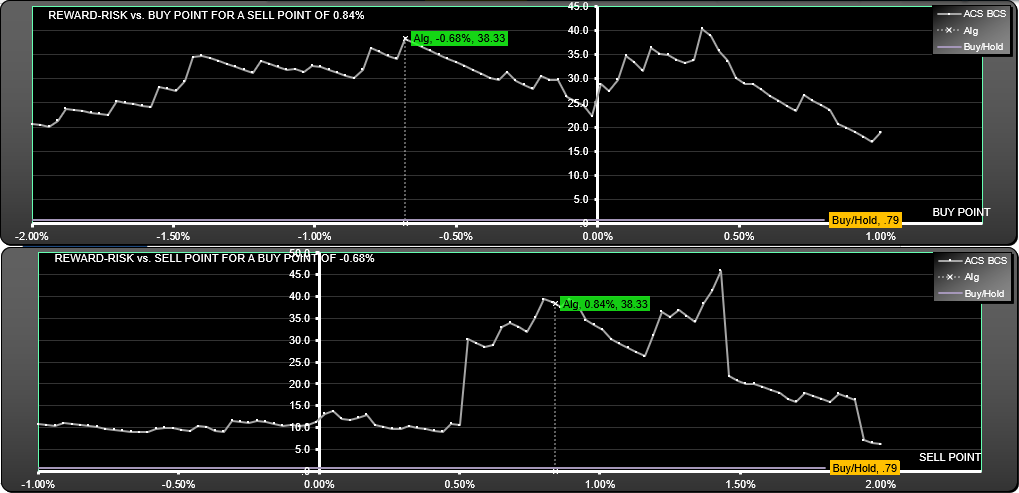
We look for signals which are not too sensitive to changes in the buy or sell point. Here you see the effect on reward-risk when the buy point or sell point is changed. The surface plot above can also be used for this analysis, here we just show the cross section of the surface at the buy and sell points.

GASX D ACS BCS Scan

Trade List

Click to see trades

Day of signal Buy or Sell Price L&S Value Next Open
12/7/2017 C/B S 29.88 9,875
12/7/2017 S/Sh S 29.55 9,875
12/8/2017 Sht S 28.35 9,976
12/12/2017 RvL S 27.89 10,065
12/18/2017 RvS S 30.36 11,389
12/19/2017 RvL S 28.96 11,409
12/20/2017 RvS S 28.57 11,542
12/21/2017 RvL S 27.72 10,417
12/22/2017 RvS S 24.79 10,370
12/27/2017 RvL S 23.10 11,004
12/28/2017 RvS S 23.15 11,074
12/29/2017 RvL S 22.97 10,901
1/2/2018 RvS S 22.64 11,522
1/3/2018 RvL S 21.32 11,327
1/4/2018 RvS S 20.71 11,202
1/5/2018 RvL S 20.65 11,458
1/8/2018 RvS S 20.90 11,669
1/9/2018 RvL S 20.38 11,477
1/10/2018 RvS S 20.20 11,480
1/12/2018 RvL S 19.44 11,562
1/16/2018 RvS S 18.76 10,884
1/17/2018 RvL S 19.77 10,843
1/22/2018 RvS S 20.53 12,246
1/23/2018 RvL S 18.90 11,802
1/24/2018 RvS S 18.30 11,589
1/25/2018 RvL S 18.57 11,910
1/26/2018 RvS S 19.24 11,426
1/29/2018 RvL S 20.00 11,988
1/31/2018 RvS S 22.28 12,461
2/1/2018 RvL S 22.70 12,502
2/6/2018 RvS S 27.55 15,774
2/7/2018 RvL S 26.46 17,071
2/8/2018 RvS S 28.49 15,019
2/9/2018 RvL S 32.09 14,674
2/12/2018 RvS S 32.00 15,306
2/13/2018 RvL S 30.59 16,382
2/14/2018 RvS S 31.15 16,897
2/15/2018 RvL S 28.67 16,622
2/16/2018 RvS S 28.41 16,205
2/20/2018 RvL S 29.10 15,824
2/21/2018 RvS S 28.44 14,364
2/22/2018 RvL S 31.05 13,756
2/23/2018 RvS S 29.77 14,628
2/27/2018 RvL S 27.85 14,908
2/28/2018 RvS S 28.41 13,358
3/1/2018 RvL S 31.34 13,316
3/2/2018 RvS S 30.02 13,564
3/6/2018 RvL S 26.99 15,157
3/8/2018 RvS S 28.55 14,909
3/12/2018 RvL S 27.50 15,200
3/13/2018 RvS S 26.68 14,699
3/14/2018 RvL S 27.09 14,636
3/15/2018 RvS S 27.05 13,330
3/19/2018 RvL S 28.84 14,161
3/20/2018 RvS S 29.94 14,506
3/22/2018 RvL S 27.82 15,135
3/23/2018 RvS S 27.67 14,628
3/26/2018 RvL S 28.42 14,254
3/29/2018 RvS S 30.27 16,461
4/2/2018 RvL S 28.50 17,532
4/3/2018 RvS S 30.38 16,872
4/4/2018 RvL S 31.50 15,723
4/5/2018 RvS S 29.38 16,501
4/6/2018 RvL S 27.90 17,440
4/9/2018 RvS S 29.51 18,173
4/11/2018 RvL S 26.34 18,012
4/12/2018 RvS S 24.60 17,457
4/13/2018 RvL S 25.34 16,865
4/16/2018 RvS S 24.18 16,849
4/17/2018 RvL S 23.87 16,179
4/18/2018 RvS S 22.94 17,138
4/19/2018 RvL S 21.56 17,553
4/23/2018 RvS S 22.15 17,852
4/24/2018 RvL S 21.81 18,623
4/25/2018 RvS S 22.41 18,814
4/26/2018 RvL S 21.86 18,776
4/30/2018 RvS S 21.81 18,685
5/1/2018 RvL S 21.81 18,568
5/2/2018 RvS S 21.51 18,088
5/3/2018 RvL S 21.87 19,339
5/4/2018 RvS S 23.20 20,528
5/8/2018 RvL S 22.10 18,952
5/9/2018 RvS S 20.67 19,464
5/10/2018 RvL S 19.89 19,313
5/14/2018 RvS S 20.10 20,208
5/15/2018 RvL S 19.52 20,030
5/16/2018 RvS S 19.20 20,330
5/18/2018 RvL S 17.73 21,311
5/21/2018 RvS S 17.70 21,875
5/22/2018 RvL S 17.22 23,346
5/30/2018 RvS S 20.54 28,028
5/31/2018 RvL S 18.99 28,442
6/1/2018 RvS S 19.04 27,922
6/4/2018 RvL S 19.27 30,533
6/5/2018 RvS S 20.81 29,925
6/6/2018 RvL S 20.88 29,233
6/7/2018 RvS S 20.47 30,675
6/8/2018 RvL S 19.45 31,418
6/11/2018 RvS S 19.51 31,551
6/12/2018 RvL S 19.00 30,989
6/13/2018 RvS S 18.57 31,432
6/14/2018 RvL S 18.53 32,659
6/18/2018 RvS S 20.69 34,958
6/19/2018 RvL S 20.39 32,796
6/20/2018 RvS S 19.00 33,291
6/21/2018 RvL S 18.54 32,302
6/22/2018 RvS S 18.00 32,288
6/25/2018 RvL S 18.00 34,229
6/26/2018 RvS S 18.97 36,112
6/27/2018 RvL S 17.79 35,104
6/28/2018 RvS S 17.14 34,379
6/29/2018 RvL S 17.34 34,682
7/3/2018 RvS S 17.50 34,707
7/5/2018 RvL S 17.62 33,677
7/6/2018 RvS S 17.25 35,243
7/10/2018 RvL S 15.62 37,523
7/12/2018 RvS S 16.23 37,486
7/13/2018 RvL S 16.55 38,717
7/17/2018 RvS S 17.08 37,211
7/18/2018 RvL S 17.71 35,874
7/19/2018 RvS S 16.94 36,293
7/20/2018 RvL S 16.59 36,353
7/23/2018 RvS S 16.62 35,117
7/24/2018 RvL S 17.18 34,939
7/25/2018 RvS S 16.87 35,220
7/26/2018 RvL S 16.49 35,312
7/30/2018 RvS S 17.74 38,714
7/31/2018 RvL S 17.34 39,530
8/2/2018 RvS S 17.41 37,649
8/3/2018 RvL S 17.95 37,215
8/6/2018 RvS S 17.75 38,438
8/7/2018 RvL S 17.63 38,759
8/10/2018 RvS S 18.44 39,164
8/13/2018 RvL S 18.44 38,916
8/14/2018 RvS S 18.33 35,825
8/15/2018 RvL S 19.78 36,300
8/16/2018 RvS S 20.05 35,182
8/17/2018 RvL S 20.66 34,587
8/20/2018 RvS S 20.29 35,930
8/23/2018 RvL S 18.43 36,606
8/24/2018 RvS S 17.91 36,428
8/27/2018 RvL S 17.99 36,151
8/28/2018 RvS S 17.86 35,045
8/30/2018 RvL S 18.08 36,720
9/4/2018 RvS S 18.47 33,779
9/5/2018 RvL S 19.83 34,140
9/10/2018 RvS S 20.90 34,831
9/11/2018 RvL S 21.34 32,484
9/12/2018 RvS S 19.91 32,943
9/13/2018 RvL S 19.62 32,811
9/14/2018 RvS S 19.55 32,579
9/17/2018 RvL S 19.68 31,870
9/18/2018 RvS S 19.26 32,088
9/20/2018 RvL S 18.33 34,085
9/21/2018 RvS S 18.23 33,818
9/24/2018 RvL S 18.28 32,331
9/27/2018 RvS S 18.72 33,654
9/28/2018 RvL S 18.89 31,895
10/1/2018 RvS S 17.91 32,522
10/2/2018 RvL S 17.67 32,670
10/3/2018 RvS S 17.78 33,981
10/4/2018 RvL S 16.96 34,948
10/8/2018 RvS S 17.32 34,446
10/9/2018 RvL S 17.44 32,695
10/12/2018 RvS S 18.24 34,893
10/15/2018 RvL S 19.09 33,230
10/16/2018 RvS S 18.20 32,456
10/17/2018 RvL S 18.32 34,665
10/19/2018 RvS S 19.74 34,856
10/22/2018 RvL S 19.80 38,819
10/25/2018 RvS S 26.00 44,120
10/26/2018 RvL S 26.92 44,073
10/29/2018 RvS S 26.90 38,555
10/30/2018 RvL S 30.26 33,854
10/31/2018 RvS S 26.58 34,870
11/1/2018 RvL S 26.63 31,866
11/2/2018 RvS S 25.13 32,106
11/6/2018 RvL S 24.11 31,386
11/7/2018 RvS S 22.84 30,836
11/8/2018 RvL S 23.23 33,171
11/9/2018 RvS S 24.42 32,979
11/12/2018 RvL S 24.48 34,499
11/13/2018 RvS S 26.15 34,841
11/14/2018 RvL S 27.76 34,364
11/15/2018 RvS S 28.64 34,658
11/16/2018 RvL S 28.01 35,817
11/19/2018 RvS S 28.38 33,273
11/20/2018 RvL S 29.39 36,359
11/21/2018 RvS S 32.03 35,505
11/23/2018 RvL S 32.67 34,633
11/26/2018 RvS S 31.88 34,350
11/27/2018 RvL S 32.13 35,802
11/28/2018 RvS S 33.23 37,398
11/29/2018 RvL S 31.79 38,564
12/3/2018 RvS S 30.77 37,466
12/4/2018 RvL S 29.35 42,442
12/7/2018 RvS S 33.59 40,387
12/10/2018 RvL S 35.52 40,884
12/11/2018 RvS S 35.97 41,052
12/13/2018 RvL S 36.75 41,301
12/17/2018 RvS S 41.52 39,523
12/18/2018 RvL S 46.69 41,599
12/19/2018 RvS S 48.59 37,268
12/20/2018 RvL S 53.12 39,743
12/21/2018 RvS S 55.93 35,048
12/24/2018 RvL S 61.86 38,874
12/26/2018 RvS S 68.06 46,269
12/27/2018 RvL S 54.40 41,511
12/28/2018 RvS S 48.86 38,397
12/31/2018 RvL S 53.10 40,702
1/2/2019 RvS S 52.69 41,445
1/3/2019 RvL S 47.64 39,613
1/4/2019 RvS S 45.84 45,361
1/10/2019 RvL S 33.43 50,019
1/14/2019 RvS S 32.84 49,710
1/16/2019 RvL S 31.19 53,052
1/17/2019 RvS S 30.96 51,933
1/18/2019 RvL S 30.69 51,614
1/23/2019 RvS S 31.65 49,385
1/24/2019 RvL S 34.10 46,765
1/25/2019 RvS S 32.30 46,245
1/28/2019 RvL S 32.65 45,848
1/29/2019 RvS S 32.38 47,788
1/30/2019 RvL S 31.63 43,937
2/1/2019 RvS S 31.73 45,823
2/4/2019 RvL S 32.53 44,331
2/11/2019 RvS S 39.83 61,476
2/14/2019 RvL S 34.07 61,692
2/15/2019 RvS S 32.75 63,656
2/19/2019 RvL S 31.70 62,277
2/20/2019 RvS S 30.46 62,069
2/21/2019 RvL S 30.00 64,103
2/22/2019 RvS S 30.99 63,014
2/25/2019 RvL S 31.51 61,320
2/26/2019 RvS S 30.62 59,250
2/27/2019 RvL S 32.14 57,831
2/28/2019 RvS S 31.96 57,654
3/4/2019 RvL S 30.78 58,694
3/7/2019 RvS S 32.60 57,357
3/8/2019 RvL S 35.74 59,140
3/11/2019 RvS S 36.55 61,501
3/14/2019 RvL S 31.20 68,576
3/18/2019 RvS S 31.70 74,075
3/19/2019 RvL S 29.43 75,217
3/20/2019 RvS S 30.01 79,271
3/21/2019 RvL S 28.02 78,917
3/25/2019 RvS S 30.10 87,473
3/27/2019 RvL S 28.52 92,533
3/28/2019 RvS S 28.83 93,843
3/29/2019 RvL S 28.01 92,064
4/1/2019 RvS S 27.71 93,591
4/2/2019 RvL S 27.25 95,618
4/3/2019 RvS S 27.81 87,529
4/4/2019 RvL S 30.18 83,739
4/5/2019 RvS S 28.93 89,976
4/8/2019 RvL S 26.77 89,323
4/10/2019 RvS S 27.40 89,209
4/11/2019 RvL S 28.25 81,365
4/12/2019 RvS S 25.77 81,287
4/15/2019 RvL S 25.79 81,904
4/16/2019 RvS S 25.96 82,489
4/17/2019 RvL S 25.74 84,301
4/22/2019 RvS S 26.64 89,638
4/23/2019 RvL S 25.30 88,384
4/29/2019 RvS S 28.24 100,384
4/30/2019 RvL S 28.44 105,174
5/3/2019 RvS S 34.74 122,455
5/6/2019 RvL S 34.41 120,164
5/8/2019 RvS S 33.01 117,199
5/9/2019 RvL S 33.08 115,803
5/10/2019 RvS S 32.29 114,950
5/13/2019 RvL S 32.12 119,874
5/14/2019 RvS S 33.50 120,969
5/15/2019 RvL S 33.19 110,168
5/16/2019 RvS S 30.23 107,166
5/17/2019 RvL S 31.05 113,536
5/21/2019 RvS S 33.12 118,042
5/22/2019 RvL S 32.03 136,048
5/24/2019 RvS S 39.88 146,809
5/28/2019 RvL S 39.99 159,833
6/3/2019 RvS S 46.23 176,494
6/5/2019 RvL S 42.44 202,429
6/6/2019 RvS S 46.65 203,968
6/7/2019 RvL S 46.08 202,803
6/10/2019 RvS S 45.82 197,567
6/11/2019 RvL S 47.85 203,310
6/13/2019 RvS S 49.60 204,430
6/14/2019 RvL S 48.77 224,931
6/17/2019 RvS S 52.06 230,895
6/19/2019 RvL S 47.22 229,330
6/20/2019 RvS S 45.46 234,309
6/21/2019 RvL S 44.66 232,615
6/24/2019 RvS S 44.53 217,296
6/25/2019 RvL S 47.46 210,395
6/26/2019 RvS S 46.08 221,703
6/27/2019 RvL S 43.60 215,740
6/28/2019 RvS S 42.43 234,233
7/1/2019 RvL S 41.42 222,484
7/3/2019 RvS S 45.65 243,570
7/5/2019 RvL S 45.63 232,827
7/8/2019 RvS S 43.24 217,267
7/9/2019 RvL S 45.78 212,792
7/10/2019 RvS S 44.84 225,353
7/11/2019 RvL S 42.27 239,663
7/12/2019 RvS S 44.72 240,566
7/15/2019 RvL S 44.29 260,723
7/19/2019 RvS S 56.81 314,251
7/22/2019 RvL S 55.70 311,416
7/23/2019 RvS S 54.74 311,924
7/24/2019 RvL S 54.18 310,845
7/30/2019 RvS S 68.53 474,578
7/31/2019 RvL S 55.76 481,036
8/2/2019 RvS S 63.74 482,535
8/5/2019 RvL S 69.99 503,203
8/6/2019 RvS S 72.99 438,041
8/7/2019 RvL S 82.44 404,235
8/8/2019 RvS S 76.08 427,173
8/9/2019 RvL S 73.52 433,702
8/13/2019 RvS S 77.81 413,011
8/14/2019 RvL S 82.95 456,462
8/16/2019 RvS S 89.10 506,185
8/20/2019 RvL S 72.87 511,944
8/21/2019 RvS S 71.14 494,587
8/22/2019 RvL S 74.65 541,109
8/26/2019 RvS S 86.93 577,277
8/27/2019 RvL S 87.78 567,311
8/28/2019 RvS S 88.74 640,622
8/30/2019 RvL S 71.54 774,836
9/4/2019 RvS S 77.10 786,938
9/6/2019 RvL S 69.36 774,975
9/9/2019 RvS S 66.93 902,326
9/10/2019 RvL S 57.69 868,043
9/11/2019 RvS S 56.79 818,964
9/12/2019 RvL S 60.00 778,685
9/13/2019 RvS S 57.05 962,113
9/17/2019 RvL S 38.64 1,199,991
9/19/2019 RvS S 44.05 1,086,429
9/20/2019 RvL S 47.81 1,098,911
9/27/2019 RvS S 57.66 1,224,695
9/30/2019 RvL S 60.85 1,217,234
10/1/2019 RvS S 60.06 1,011,179
10/2/2019 RvL S 69.88 1,085,107
10/3/2019 RvS S 72.28 1,110,493
10/4/2019 RvL S 68.41 1,129,288
10/9/2019 RvS S 78.37 1,212,377
10/10/2019 RvL S 81.46 1,159,231
10/11/2019 RvS S 77.89 1,148,054
10/14/2019 RvL S 78.64 1,160,011
10/15/2019 RvS S 78.02 1,150,920
10/16/2019 RvL S 77.20 1,188,027
10/17/2019 RvS S 79.22 1,184,850
10/18/2019 RvL S 78.96 1,332,190
10/21/2019 RvS S 85.77 1,316,822
10/22/2019 RvL S 83.97 1,261,667
10/23/2019 RvS S 80.11 1,372,977
10/24/2019 RvL S 74.87 1,378,959
10/25/2019 RvS S 75.84 1,480,745
10/28/2019 RvL S 70.02 1,529,387
10/29/2019 RvS S 73.50 1,719,349
10/30/2019 RvL S 67.00 1,858,833
10/31/2019 RvS S 74.55 1,848,061
11/5/2019 RvL S 55.62 2,317,776
11/6/2019 RvS S 55.09 2,291,816
11/8/2019 RvL S 59.00 2,133,689
11/12/2019 RvS S 59.51 2,029,346
11/13/2019 RvL S 63.00 2,036,741
11/14/2019 RvS S 63.23 1,951,689
11/15/2019 RvL S 65.87 1,884,120
11/20/2019 RvS S 76.23 2,330,321
11/21/2019 RvL S 74.74 2,202,410
11/22/2019 RvS S 71.36 2,166,071
11/25/2019 RvL S 72.41 2,023,069
11/27/2019 RvS S 73.10 2,172,669
11/29/2019 RvL S 73.57 2,173,245
12/2/2019 RvS S 73.59 1,983,934
12/3/2019 RvL S 80.00 1,937,794
12/4/2019 RvS S 78.14 2,132,202
12/5/2019 RvL S 71.24 2,175,949
12/6/2019 RvS S 73.39 2,375,918
12/9/2019 Last 66.51 2,375,918

Split adjusted prices used throughout.
Key:

RvL S: Reverse Long at signal price (go from a short position to a long position by covering and buying)
RvS S: Reverse Short at signal price (go from a long position to a short position by selling then shorting)
Cov S: Cover at the signal price
Buy S: Buy at the signal price
Sht S: Short at the signal price
Sell S: Sell at the signal price
C/B S: Cover or buy at the signal price (not clear which signal came first)
S/Sh S: Sell or short at the signal price (not clear which signal came first)
Cov o: Cover a short position at the subsequent weekly open
Sell o: Close a long position at the subsequent weekly open

Update 1/9/20

Click to see trades

Showing trades from 12/4 as this was the last clear signal before publication.

Day of signal Buy or Sell Price L&S Value Next Open
12/4/2019 Sht S 78.14 10,996
12/5/2019 RvL S 71.24 11,207
12/6/2019 RvS S 73.39 11,873
12/9/2019 RvL S 68.80 10,595
12/10/2019 RvS S 61.17 10,732
12/11/2019 RvL S 60.00 10,807
12/12/2019 RvS S 60.28 12,017
12/13/2019 RvL S 53.24 12,365
12/16/2019 RvS S 54.87 12,979
12/17/2019 RvL S 52.08 12,315
12/18/2019 RvS S 47.84 12,355
12/19/2019 RvL S 46.00 11,604
12/20/2019 RvS S 43.25 10,997
12/23/2019 RvL S 45.46 9,858
12/24/2019 RvS S 40.70 9,851
12/27/2019 RvL S 40.41 10,503
12/30/2019 RvS S 42.96 10,192
12/31/2019 RvL S 44.10 9,349
1/2/2020 RvS S 40.51 9,453
1/6/2020 RvL S 39.87 9,140
1/7/2020 RvS S 38.48 9,335
1/8/2020 RvL S 37.60 10,392

GASX Daily (ACS BOS OO)

Trade List

Click to see trades

Split adjusted prices used throughout.
Key:
Cov o: Cover at subsequent open
Sell o: Sell at subsequent open
Sht S: Short at the signal price
Buy S: Buy at the signal price
C/B S: Cover or buy at the signal price
S/Sh S: Sell or short at the signal price

Note: Since we can't tell which C/B or S/Sh signal came first, we average the result of both the Sh then Cov and Buy then Sell, which may lead to a small error. Trades assume $0 commission.

Day of signal Buy or Sell Price L&S Value Next Open
12/7/2017 Sht S 29.83 10,480
12/7/2017 Cov o 28.35 10,480
12/8/2017 Sht S 28.30 10,561
12/8/2017 Cov o 28.04 10,561
12/11/2017 Sht S 27.99 10,584
12/11/2017 Cov o 27.89 10,584
12/12/2017 C/B S 27.89 10,551
12/12/2017 S/Sh S 27.84 10,551
12/13/2017 C/B S 28.03 10,521
12/13/2017 S/Sh S 27.99 10,521
12/14/2017 C/B S 28.75 10,496
12/14/2017 S/Sh S 28.72 10,496
12/15/2017 Buy S 29.26 10,874
12/15/2017 Sell o 30.36 10,874
12/18/2017 Sht S 30.33 11,350
12/18/2017 Cov o 28.96 11,350
12/19/2017 Sht S 28.93 11,290
12/19/2017 Cov o 29.05 11,290
12/20/2017 C/B S 29.05 11,263
12/20/2017 S/Sh S 29.01 11,263
12/21/2017 C/B S 27.72 11,238
12/21/2017 S/Sh S 27.69 11,238
12/22/2017 Sht S 25.01 11,404
12/22/2017 Cov o 24.61 11,404
12/26/2017 Sht S 24.55 12,063
12/26/2017 Cov o 23.10 12,063
12/27/2017 Buy S 23.52 11,856
12/27/2017 Sell o 23.15 11,856
12/28/2017 Sht S 23.07 11,892
12/28/2017 Cov o 22.97 11,892
12/29/2017 C/B S 23.07 11,789
12/29/2017 S/Sh S 22.89 11,789
1/2/2018 Sht S 22.58 12,431
1/2/2018 Cov o 21.32 12,431
1/3/2018 Sht S 21.27 12,585
1/3/2018 Cov o 20.99 12,585
1/4/2018 C/B S 21.03 12,520
1/4/2018 S/Sh S 20.94 12,520
1/5/2018 Buy S 20.65 12,809
1/5/2018 Sell o 21.15 12,809
1/8/2018 C/B S 21.21 12,737
1/8/2018 S/Sh S 21.11 12,737
1/9/2018 Sht S 20.21 12,727
1/9/2018 Cov o 20.20 12,727
1/10/2018 C/B S 20.58 12,454
1/10/2018 S/Sh S 20.17 12,454
1/11/2018 Sht S 20.15 12,879
1/11/2018 Cov o 19.44 12,879
1/12/2018 C/B S 19.44 12,853
1/12/2018 S/Sh S 19.42 12,853
1/16/2018 C/B S 19.00 12,768
1/16/2018 S/Sh S 18.90 12,768
1/17/2018 C/B S 20.00 12,542
1/17/2018 S/Sh S 19.66 12,542
1/18/2018 Buy S 19.82 13,021
1/18/2018 Sell o 20.60 13,021
1/19/2018 C/B S 20.60 12,997
1/19/2018 S/Sh S 20.58 12,997
1/22/2018 Sht S 20.58 14,207
1/22/2018 Cov o 18.64 14,207
1/23/2018 C/B S 19.09 13,839
1/23/2018 S/Sh S 18.62 13,839
1/24/2018 C/B S 18.53 13,750
1/24/2018 S/Sh S 18.43 13,750
1/25/2018 Buy S 18.79 14,067
1/25/2018 Sell o 19.24 14,067
1/26/2018 Sht S 19.21 13,477
1/26/2018 Cov o 20.00 13,477
1/29/2018 C/B S 20.00 13,445
1/29/2018 S/Sh S 19.97 13,445
1/30/2018 Buy S 21.01 14,307
1/30/2018 Sell o 22.38 14,307
1/31/2018 C/B S 22.59 14,133
1/31/2018 S/Sh S 22.34 14,133
2/1/2018 C/B S 22.95 13,933
2/1/2018 S/Sh S 22.65 13,933
2/2/2018 Buy S 22.80 15,874
2/2/2018 Sell o 26.00 15,874
2/5/2018 C/B S 26.00 15,821
2/5/2018 S/Sh S 25.94 15,821
2/6/2018 C/B S 28.75 15,762
2/6/2018 S/Sh S 28.67 15,762
2/7/2018 C/B S 26.95 15,309
2/7/2018 S/Sh S 26.21 15,309
2/8/2018 C/B S 29.01 15,150
2/8/2018 S/Sh S 28.74 15,150
2/9/2018 C/B S 32.63 14,604
2/9/2018 S/Sh S 31.50 14,604
2/12/2018 Sht S 31.88 15,179
2/12/2018 Cov o 30.59 15,179
2/13/2018 Buy S 30.59 16,246
2/13/2018 Sell o 32.77 16,246
2/14/2018 C/B S 32.77 16,189
2/14/2018 S/Sh S 32.68 16,189
2/15/2018 C/B S 29.12 15,762
2/15/2018 S/Sh S 28.39 15,762
2/16/2018 C/B S 29.02 15,375
2/16/2018 S/Sh S 28.34 15,375
2/20/2018 Sht S 29.04 15,680
2/20/2018 Cov o 28.44 15,680
2/21/2018 Buy S 29.16 16,678
2/21/2018 Sell o 31.04 16,678
2/22/2018 C/B S 31.39 16,457
2/22/2018 S/Sh S 31.00 16,457
2/23/2018 Sht S 29.73 17,484
2/23/2018 Cov o 27.85 17,484
2/26/2018 Sht S 27.82 17,451
2/26/2018 Cov o 27.85 17,451
2/27/2018 C/B S 27.99 17,331
2/27/2018 S/Sh S 27.82 17,331
2/28/2018 Buy S 29.34 18,497
2/28/2018 Sell o 31.34 18,497
3/1/2018 C/B S 31.34 18,464
3/1/2018 S/Sh S 31.31 18,464
3/2/2018 C/B S 31.27 18,428
3/2/2018 S/Sh S 31.24 18,428
3/5/2018 Sht S 28.10 19,275
3/5/2018 Cov o 26.79 19,275
3/6/2018 C/B S 27.30 18,866
3/6/2018 S/Sh S 26.75 18,866
3/7/2018 C/B S 29.13 18,823
3/7/2018 S/Sh S 29.09 18,823
3/8/2018 Buy S 29.06 18,394
3/8/2018 Sell o 28.42 18,394
3/9/2018 Sht S 28.38 18,949
3/9/2018 Cov o 27.50 18,949
3/12/2018 Sht S 27.46 19,121
3/12/2018 Cov o 27.19 19,121
3/13/2018 C/B S 27.19 19,081
3/13/2018 S/Sh S 27.15 19,081
3/14/2018 Buy S 27.37 18,842
3/14/2018 Sell o 27.05 18,842
3/15/2018 C/B S 27.79 18,296
3/15/2018 S/Sh S 27.02 18,296
3/16/2018 Sht S 29.41 18,638
3/16/2018 Cov o 28.84 18,638
3/19/2018 Buy S 28.84 19,335
3/19/2018 Sell o 29.94 19,335
3/21/2018 Sht S 29.13 20,193
3/21/2018 Cov o 27.82 20,193
3/22/2018 C/B S 27.82 20,148
3/22/2018 S/Sh S 27.78 20,148
3/23/2018 C/B S 28.03 19,950
3/23/2018 S/Sh S 27.78 19,950
3/26/2018 C/B S 28.61 19,774
3/26/2018 S/Sh S 28.38 19,774
3/27/2018 C/B S 27.72 19,732
3/27/2018 S/Sh S 27.68 19,732
3/28/2018 C/B S 29.58 19,692
3/28/2018 S/Sh S 29.54 19,692
3/29/2018 Sht S 30.23 20,805
3/29/2018 Cov o 28.50 20,805
4/2/2018 Buy S 28.50 22,163
4/2/2018 Sell o 30.38 22,163
4/3/2018 Sht S 30.34 21,301
4/3/2018 Cov o 31.50 21,301
4/4/2018 C/B S 31.50 21,259
4/4/2018 S/Sh S 31.46 21,259
4/5/2018 Sht S 29.34 22,292
4/5/2018 Cov o 27.90 22,292
4/6/2018 Buy S 27.90 23,567
4/6/2018 Sell o 29.51 23,567
4/9/2018 Sht S 29.48 24,538
4/9/2018 Cov o 28.25 24,538
4/10/2018 Sht S 28.22 26,157
4/10/2018 Cov o 26.34 26,157
4/11/2018 Sht S 26.29 27,825
4/11/2018 Cov o 24.60 27,825
4/12/2018 Buy S 25.04 28,148
4/12/2018 Sell o 25.34 28,148
4/13/2018 Sht S 25.27 28,993
4/13/2018 Cov o 24.50 28,993
4/16/2018 C/B S 24.61 28,771
4/16/2018 S/Sh S 24.43 28,771
4/17/2018 Sht S 23.80 29,795
4/17/2018 Cov o 22.94 29,795
4/18/2018 Sht S 22.88 31,497
4/18/2018 Cov o 21.56 31,497
4/19/2018 C/B S 21.75 31,135
4/19/2018 S/Sh S 21.51 31,135
4/20/2018 Buy S 22.10 32,177
4/20/2018 Sell o 22.85 32,177
4/23/2018 C/B S 22.85 32,098
4/23/2018 S/Sh S 22.80 32,098
4/24/2018 C/B S 21.82 32,009
4/24/2018 S/Sh S 21.77 32,009
4/25/2018 C/B S 22.77 31,952
4/25/2018 S/Sh S 22.74 31,952
4/26/2018 Sht S 21.78 31,774
4/26/2018 Cov o 21.89 31,774
4/27/2018 C/B S 21.89 31,738
4/27/2018 S/Sh S 21.87 31,738
4/30/2018 Sht S 21.99 31,990
4/30/2018 Cov o 21.81 31,990
5/1/2018 C/B S 21.81 31,952
5/1/2018 S/Sh S 21.79 31,952
5/2/2018 C/B S 21.74 31,841
5/2/2018 S/Sh S 21.67 31,841
5/3/2018 Buy S 21.96 33,915
5/3/2018 Sell o 23.40 33,915
5/4/2018 C/B S 23.46 33,787
5/4/2018 S/Sh S 23.38 33,787
5/7/2018 Sht S 21.53 32,877
5/7/2018 Cov o 22.10 32,877
5/8/2018 C/B S 22.10 32,828
5/8/2018 S/Sh S 22.08 32,828
5/9/2018 Sht S 20.86 34,335
5/9/2018 Cov o 19.89 34,335
5/10/2018 C/B S 20.02 34,034
5/10/2018 S/Sh S 19.85 34,034
5/11/2018 C/B S 19.77 33,906
5/11/2018 S/Sh S 19.71 33,906
5/14/2018 Sht S 20.05 34,794
5/14/2018 Cov o 19.52 34,794
5/15/2018 C/B S 19.67 34,441
5/15/2018 S/Sh S 19.48 34,441
5/16/2018 C/B S 19.47 34,187
5/16/2018 S/Sh S 19.33 34,187
5/17/2018 Sht S 18.70 35,940
5/17/2018 Cov o 17.73 35,940
5/18/2018 Buy S 17.76 35,809
5/18/2018 Sell o 17.70 35,809
5/21/2018 Sht S 17.67 36,713
5/21/2018 Cov o 17.22 36,713
5/22/2018 C/B S 17.40 36,258
5/22/2018 S/Sh S 17.19 36,258
5/23/2018 C/B S 18.39 36,181
5/23/2018 S/Sh S 18.36 36,181
5/24/2018 C/B S 19.27 36,115
5/24/2018 S/Sh S 19.24 36,115
5/25/2018 Buy S 20.23 38,689
5/25/2018 Sell o 21.68 38,689
5/29/2018 C/B S 21.68 38,602
5/29/2018 S/Sh S 21.64 38,602
5/30/2018 Sht S 20.49 41,412
5/30/2018 Cov o 18.99 41,412
5/31/2018 C/B S 18.99 41,291
5/31/2018 S/Sh S 18.94 41,291
6/1/2018 C/B S 19.35 41,033
6/1/2018 S/Sh S 19.24 41,033
6/4/2018 C/B S 19.52 40,145
6/4/2018 S/Sh S 19.11 40,145
6/5/2018 C/B S 21.23 40,071
6/5/2018 S/Sh S 21.20 40,071
6/6/2018 Sht S 20.78 40,647
6/6/2018 Cov o 20.47 40,647
6/7/2018 Sht S 20.44 42,597
6/7/2018 Cov o 19.45 42,597
6/8/2018 C/B S 19.45 42,520
6/8/2018 S/Sh S 19.42 42,520
6/11/2018 C/B S 19.93 42,446
6/11/2018 S/Sh S 19.90 42,446
6/12/2018 C/B S 19.07 42,222
6/12/2018 S/Sh S 18.98 42,222
6/13/2018 C/B S 18.82 41,802
6/13/2018 S/Sh S 18.64 41,802
6/14/2018 C/B S 18.77 40,433
6/14/2018 S/Sh S 18.17 40,433
6/15/2018 Buy S 19.61 43,017
6/15/2018 Sell o 20.87 43,017
6/18/2018 Sht S 20.85 43,948
6/18/2018 Cov o 20.39 43,948
6/19/2018 C/B S 20.39 43,886
6/19/2018 S/Sh S 20.37 43,886
6/20/2018 Sht S 19.14 45,234
6/20/2018 Cov o 18.54 45,234
6/21/2018 C/B S 18.54 45,161
6/21/2018 S/Sh S 18.52 45,161
6/22/2018 Sht S 17.98 45,088
6/22/2018 Cov o 18.00 45,088
6/25/2018 C/B S 18.11 44,732
6/25/2018 S/Sh S 17.97 44,732
6/26/2018 Sht S 19.06 47,695
6/26/2018 Cov o 17.79 47,695
6/27/2018 Sht S 17.76 48,923
6/27/2018 Cov o 17.30 48,923
6/28/2018 C/B S 17.39 48,573
6/28/2018 S/Sh S 17.27 48,573
6/29/2018 C/B S 17.38 48,388
6/29/2018 S/Sh S 17.32 48,388
7/2/2018 Buy S 17.50 48,374
7/2/2018 Sell o 17.50 48,374
7/3/2018 Sht S 17.48 48,357
7/3/2018 Cov o 17.48 48,357
7/5/2018 Sht S 17.46 48,919
7/5/2018 Cov o 17.25 48,919
7/6/2018 Sht S 17.23 51,155
7/6/2018 Cov o 16.44 51,155
7/9/2018 Sht S 16.43 54,465
7/9/2018 Cov o 15.36 54,465
7/10/2018 Sht S 15.34 52,391
7/10/2018 Cov o 15.92 52,391
7/11/2018 C/B S 15.92 52,278
7/11/2018 S/Sh S 15.89 52,278
7/12/2018 Buy S 16.71 51,753
7/12/2018 Sell o 16.55 51,753
7/13/2018 Sht S 16.52 49,936
7/13/2018 Cov o 17.10 49,936
7/16/2018 Buy S 17.10 51,178
7/16/2018 Sell o 17.53 51,178
7/17/2018 C/B S 17.53 51,096
7/17/2018 S/Sh S 17.51 51,096
7/18/2018 C/B S 17.71 51,008
7/18/2018 S/Sh S 17.68 51,008
7/19/2018 Sht S 17.05 52,387
7/19/2018 Cov o 16.59 52,387
7/20/2018 Buy S 16.59 52,481
7/20/2018 Sell o 16.62 52,481
7/23/2018 C/B S 16.98 51,284
7/23/2018 S/Sh S 16.61 51,284
7/24/2018 Sht S 17.17 51,464
7/24/2018 Cov o 17.10 51,464
7/25/2018 C/B S 17.10 51,415
7/25/2018 S/Sh S 17.09 51,415
7/26/2018 C/B S 16.55 51,197
7/26/2018 S/Sh S 16.48 51,197
7/27/2018 Buy S 16.57 54,790
7/27/2018 Sell o 17.74 54,790
7/30/2018 Sht S 17.73 55,984
7/30/2018 Cov o 17.34 55,984
7/31/2018 C/B S 17.38 55,810
7/31/2018 S/Sh S 17.33 55,810
8/1/2018 C/B S 17.71 55,754
8/1/2018 S/Sh S 17.70 55,754
8/2/2018 C/B S 17.95 55,685
8/2/2018 S/Sh S 17.93 55,685
8/3/2018 C/B S 17.95 55,615
8/3/2018 S/Sh S 17.93 55,615
8/6/2018 Sht S 17.73 57,397
8/6/2018 Cov o 17.16 57,397
8/7/2018 Buy S 17.78 58,906
8/7/2018 Sell o 18.25 58,906
8/8/2018 Buy S 18.25 60,538
8/8/2018 Sell o 18.76 60,538
8/9/2018 C/B S 18.76 60,481
8/9/2018 S/Sh S 18.75 60,481
8/10/2018 C/B S 18.75 60,417
8/10/2018 S/Sh S 18.73 60,417
8/13/2018 C/B S 18.44 60,349
8/13/2018 S/Sh S 18.42 60,349
8/15/2018 Buy S 19.78 61,159
8/15/2018 Sell o 20.05 61,159
8/17/2018 Sht S 20.63 62,057
8/17/2018 Cov o 20.32 62,057
8/20/2018 Sht S 20.28 64,564
8/20/2018 Cov o 19.46 64,564
8/21/2018 Sht S 19.43 66,634
8/21/2018 Cov o 18.80 66,634
8/22/2018 Sht S 18.77 67,831
8/22/2018 Cov o 18.43 67,831
8/23/2018 Buy S 18.43 65,903
8/23/2018 Sell o 17.91 65,903
8/24/2018 Sht S 17.88 65,469
8/24/2018 Cov o 17.99 65,469
8/27/2018 Sht S 17.95 65,799
8/27/2018 Cov o 17.86 65,799
8/28/2018 Buy S 18.20 66,523
8/28/2018 Sell o 18.40 66,523
8/29/2018 Sht S 18.37 67,608
8/29/2018 Cov o 18.07 67,608
8/30/2018 Buy S 18.25 68,904
8/30/2018 Sell o 18.60 68,904
8/31/2018 C/B S 18.60 68,859
8/31/2018 S/Sh S 18.59 68,859
9/4/2018 C/B S 18.66 68,612
9/4/2018 S/Sh S 18.60 68,612
9/5/2018 C/B S 19.83 68,553
9/5/2018 S/Sh S 19.82 68,553
9/6/2018 C/B S 20.05 68,455
9/6/2018 S/Sh S 20.03 68,455
9/7/2018 Buy S 21.02 68,057
9/7/2018 Sell o 20.90 68,057
9/10/2018 Sht S 20.86 66,477
9/10/2018 Cov o 21.34 66,477
9/11/2018 C/B S 21.49 65,872
9/11/2018 S/Sh S 21.30 65,872
9/12/2018 Sht S 19.87 66,701
9/12/2018 Cov o 19.62 66,701
9/13/2018 Buy S 19.62 66,449
9/13/2018 Sell o 19.55 66,449
9/14/2018 Sht S 19.53 65,914
9/14/2018 Cov o 19.68 65,914
9/17/2018 C/B S 19.84 65,291
9/17/2018 S/Sh S 19.65 65,291
9/18/2018 Sht S 19.23 65,664
9/18/2018 Cov o 19.12 65,664
9/19/2018 Sht S 19.10 69,151
9/19/2018 Cov o 18.08 69,151
9/20/2018 C/B S 18.53 67,357
9/20/2018 S/Sh S 18.06 67,357
9/21/2018 C/B S 18.72 67,268
9/21/2018 S/Sh S 18.70 67,268
9/24/2018 Sht S 17.85 67,164
9/24/2018 Cov o 17.87 67,164
9/25/2018 C/B S 18.00 66,547
9/25/2018 S/Sh S 17.84 66,547
9/26/2018 Buy S 18.60 66,951
9/26/2018 Sell o 18.72 66,951
9/27/2018 Sht S 18.70 66,249
9/27/2018 Cov o 18.89 66,249
9/28/2018 C/B S 18.89 66,187
9/28/2018 S/Sh S 18.88 66,187
10/1/2018 Sht S 17.90 67,457
10/1/2018 Cov o 17.55 67,457
10/2/2018 Buy S 17.84 67,571
10/2/2018 Sell o 17.87 67,571
10/3/2018 Sht S 17.86 70,957
10/3/2018 Cov o 16.96 70,957
10/4/2018 C/B S 16.96 70,865
10/4/2018 S/Sh S 16.94 70,865
10/5/2018 C/B S 17.47 70,659
10/5/2018 S/Sh S 17.43 70,659
10/8/2018 C/B S 17.98 70,568
10/8/2018 S/Sh S 17.96 70,568
10/9/2018 C/B S 17.44 70,496
10/9/2018 S/Sh S 17.43 70,496
10/10/2018 Buy S 16.56 79,633
10/10/2018 Sell o 18.71 79,633
10/11/2018 C/B S 18.71 79,567
10/11/2018 S/Sh S 18.70 79,567
10/12/2018 Buy S 19.60 76,293
10/12/2018 Sell o 18.80 76,293
10/15/2018 Sht S 18.77 77,368
10/15/2018 Cov o 18.50 77,368
10/16/2018 C/B S 18.50 77,219
10/16/2018 S/Sh S 18.47 77,219
10/17/2018 Buy S 18.32 82,496
10/17/2018 Sell o 19.57 82,496
10/18/2018 C/B S 19.57 82,353
10/18/2018 S/Sh S 19.54 82,353
10/19/2018 C/B S 19.99 81,603
10/19/2018 S/Sh S 19.82 81,603
10/22/2018 Buy S 19.99 90,046
10/22/2018 Sell o 22.06 90,046
10/23/2018 Buy S 22.06 93,126
10/23/2018 Sell o 22.82 93,126
10/24/2018 Buy S 23.10 104,821
10/24/2018 Sell o 26.00 104,821
10/25/2018 C/B S 26.64 101,964
10/25/2018 S/Sh S 25.92 101,964
10/26/2018 C/B S 26.92 101,593
10/26/2018 S/Sh S 26.83 101,593
10/29/2018 C/B S 27.52 98,859
10/29/2018 S/Sh S 26.80 98,859
10/30/2018 Sht S 30.15 110,544
10/30/2018 Cov o 26.58 110,544
10/31/2018 Sht S 26.48 113,476
10/31/2018 Cov o 25.77 113,476
11/1/2018 Sht S 25.70 115,974
11/1/2018 Cov o 25.13 115,974
11/2/2018 Buy S 25.57 113,064
11/2/2018 Sell o 24.93 113,064
11/5/2018 Sht S 24.89 116,579
11/5/2018 Cov o 24.11 116,579
11/6/2018 C/B S 24.40 114,928
11/6/2018 S/Sh S 24.06 114,928
11/7/2018 Sht S 22.78 112,649
11/7/2018 Cov o 23.23 112,649
11/8/2018 C/B S 23.23 112,316
11/8/2018 S/Sh S 23.16 112,316
11/9/2018 C/B S 25.00 112,100
11/9/2018 S/Sh S 24.96 112,100
11/12/2018 Buy S 24.79 118,219
11/12/2018 Sell o 26.15 118,219
11/13/2018 C/B S 27.13 113,660
11/13/2018 S/Sh S 26.11 113,660
11/14/2018 Buy S 28.10 119,258
11/14/2018 Sell o 29.49 119,258
11/15/2018 C/B S 29.49 119,007
11/15/2018 S/Sh S 29.43 119,007
11/16/2018 Buy S 28.46 123,133
11/16/2018 Sell o 29.45 123,133
11/19/2018 C/B S 29.45 122,856
11/19/2018 S/Sh S 29.39 122,856
11/20/2018 Buy S 29.39 134,295
11/20/2018 Sell o 32.13 134,295
11/21/2018 Sht S 32.07 131,777
11/21/2018 Cov o 32.67 131,777
11/23/2018 C/B S 32.67 131,561
11/23/2018 S/Sh S 32.62 131,561
11/26/2018 Sht S 31.82 130,287
11/26/2018 Cov o 32.13 130,287
11/27/2018 Buy S 32.22 135,464
11/27/2018 Sell o 33.50 135,464
11/28/2018 C/B S 33.72 134,324
11/28/2018 S/Sh S 33.44 134,324
11/29/2018 Sht S 31.40 126,936
11/29/2018 Cov o 33.12 126,936
11/30/2018 C/B S 33.12 126,788
11/30/2018 S/Sh S 33.09 126,788
12/3/2018 Sht S 30.74 132,489
12/3/2018 Cov o 29.35 132,489
12/4/2018 Buy S 29.56 149,039
12/4/2018 Sell o 33.26 149,039
12/6/2018 Buy S 33.26 150,504
12/6/2018 Sell o 33.59 150,504
12/7/2018 Sht S 33.52 141,495
12/7/2018 Cov o 35.52 141,495
12/10/2018 C/B S 35.52 141,192
12/10/2018 S/Sh S 35.45 141,192
12/11/2018 Sht S 35.88 141,450
12/11/2018 Cov o 35.81 141,450
12/12/2018 Sht S 35.71 137,875
12/12/2018 Cov o 36.61 137,875
12/13/2018 Buy S 37.35 140,146
12/13/2018 Sell o 37.97 140,146
12/14/2018 Buy S 37.97 156,814
12/14/2018 Sell o 42.49 156,814
12/17/2018 C/B S 42.49 156,531
12/17/2018 S/Sh S 42.42 156,531
12/18/2018 C/B S 46.69 156,134
12/18/2018 S/Sh S 46.58 156,134
12/19/2018 C/B S 49.51 154,516
12/19/2018 S/Sh S 49.01 154,516
12/20/2018 C/B S 53.12 153,975
12/20/2018 S/Sh S 52.94 153,975
12/21/2018 C/B S 57.12 152,164
12/21/2018 S/Sh S 56.46 152,164
12/24/2018 Buy S 61.86 168,826
12/24/2018 Sell o 68.64 168,826
12/26/2018 C/B S 69.79 165,185
12/26/2018 S/Sh S 68.30 165,185
12/27/2018 C/B S 54.40 164,235
12/27/2018 S/Sh S 54.09 164,235
12/28/2018 Buy S 51.87 166,236
12/28/2018 Sell o 52.51 166,236
12/31/2018 C/B S 54.29 159,894
12/31/2018 S/Sh S 52.26 159,894
1/2/2019 C/B S 57.04 159,251
1/2/2019 S/Sh S 56.82 159,251
1/3/2019 C/B S 48.74 153,621
1/3/2019 S/Sh S 47.05 153,621
1/4/2019 Sht S 45.59 175,226
1/4/2019 Cov o 39.17 175,226
1/7/2019 Sht S 38.99 197,628
1/7/2019 Cov o 34.00 197,628
1/9/2019 Sht S 33.58 198,513
1/9/2019 Cov o 33.43 198,513
1/10/2019 C/B S 33.83 194,528
1/10/2019 S/Sh S 33.16 194,528
1/11/2019 C/B S 33.63 190,769
1/11/2019 S/Sh S 32.99 190,769
1/14/2019 C/B S 34.32 189,706
1/14/2019 S/Sh S 34.13 189,706
1/15/2019 Sht S 32.52 198,745
1/15/2019 Cov o 30.97 198,745
1/16/2019 Sht S 30.91 192,461
1/16/2019 Cov o 31.89 192,461
1/17/2019 C/B S 31.89 192,182
1/17/2019 S/Sh S 31.85 192,182
1/18/2019 Sht S 30.65 193,043
1/18/2019 Cov o 30.51 193,043
1/22/2019 Buy S 30.51 200,242
1/22/2019 Sell o 31.65 200,242
1/23/2019 Buy S 32.80 208,185
1/23/2019 Sell o 34.10 208,185
1/24/2019 C/B S 34.45 205,791
1/24/2019 S/Sh S 34.06 205,791
1/25/2019 Sht S 32.25 203,246
1/25/2019 Cov o 32.65 203,246
1/28/2019 C/B S 32.65 202,941
1/28/2019 S/Sh S 32.60 202,941
1/29/2019 Sht S 32.33 211,296
1/29/2019 Cov o 31.00 211,296
1/30/2019 Sht S 30.95 220,251
1/30/2019 Cov o 29.64 220,251
1/31/2019 Buy S 29.73 235,579
1/31/2019 Sell o 31.80 235,579
2/1/2019 C/B S 32.14 232,728
2/1/2019 S/Sh S 31.76 232,728
2/4/2019 C/B S 32.53 232,417
2/4/2019 S/Sh S 32.49 232,417
2/5/2019 C/B S 31.48 232,209
2/5/2019 S/Sh S 31.45 232,209
2/6/2019 C/B S 33.01 232,010
2/6/2019 S/Sh S 32.98 232,010
2/7/2019 Buy S 34.16 266,277
2/7/2019 Sell o 39.21 266,277
2/8/2019 C/B S 39.21 265,807
2/8/2019 S/Sh S 39.14 265,807
2/11/2019 C/B S 41.16 265,063
2/11/2019 S/Sh S 41.05 265,063
2/12/2019 Sht S 35.88 266,575
2/12/2019 Cov o 35.67 266,575
2/13/2019 Sht S 35.56 277,718
2/13/2019 Cov o 34.07 277,718
2/14/2019 Sht S 33.97 287,665
2/14/2019 Cov o 32.75 287,665
2/15/2019 Sht S 32.66 296,096
2/15/2019 Cov o 31.70 296,096
2/19/2019 C/B S 31.70 295,117
2/19/2019 S/Sh S 31.60 295,117
2/20/2019 Sht S 30.90 303,693
2/20/2019 Cov o 30.00 303,693
2/21/2019 C/B S 30.12 301,411
2/21/2019 S/Sh S 29.89 301,411
2/22/2019 Sht S 30.92 295,634
2/22/2019 Cov o 31.51 295,634
2/25/2019 C/B S 31.53 294,898
2/25/2019 S/Sh S 31.46 294,898
2/26/2019 C/B S 31.00 291,328
2/26/2019 S/Sh S 30.63 291,328
2/27/2019 C/B S 32.42 283,727
2/27/2019 S/Sh S 31.58 283,727
2/28/2019 Buy S 32.52 279,598
2/28/2019 Sell o 32.05 279,598
3/1/2019 Sht S 32.02 296,968
3/1/2019 Cov o 30.03 296,968
3/4/2019 C/B S 31.07 286,610
3/4/2019 S/Sh S 30.01 286,610
3/5/2019 C/B S 30.22 285,591
3/5/2019 S/Sh S 30.12 285,591
3/6/2019 Buy S 31.59 294,707
3/6/2019 Sell o 32.60 294,707
3/7/2019 Buy S 33.09 318,310
3/7/2019 Sell o 35.74 318,310
3/8/2019 Buy S 35.74 328,271
3/8/2019 Sell o 36.86 328,271
3/11/2019 Sht S 36.79 346,383
3/11/2019 Cov o 34.76 346,383
3/12/2019 Sht S 34.68 373,931
3/12/2019 Cov o 31.92 373,931
3/13/2019 Sht S 31.84 381,459
3/13/2019 Cov o 31.20 381,459
3/14/2019 Sht S 31.13 372,700
3/14/2019 Cov o 31.84 372,700
3/15/2019 Buy S 31.84 371,047
3/15/2019 Sell o 31.70 371,047
3/18/2019 Sht S 31.63 401,878
3/18/2019 Cov o 29.00 401,878
3/19/2019 C/B S 29.90 388,474
3/19/2019 S/Sh S 28.92 388,474
3/20/2019 Sht S 30.28 417,439
3/20/2019 Cov o 28.02 417,439
3/21/2019 C/B S 28.02 416,579
3/21/2019 S/Sh S 27.96 416,579
3/22/2019 Buy S 27.90 461,805
3/22/2019 Sell o 30.93 461,805
3/25/2019 C/B S 30.93 460,989
3/25/2019 S/Sh S 30.88 460,989
3/26/2019 Sht S 29.23 475,131
3/26/2019 Cov o 28.33 475,131
3/27/2019 Buy S 28.86 485,033
3/27/2019 Sell o 29.46 485,033
3/28/2019 C/B S 29.46 484,434
3/28/2019 S/Sh S 29.42 484,434
3/29/2019 Sht S 27.74 484,862
3/29/2019 Cov o 27.71 484,862
4/1/2019 Sht S 27.67 492,305
4/1/2019 Cov o 27.25 492,305
4/2/2019 C/B S 27.52 486,583
4/2/2019 S/Sh S 27.21 486,583
4/3/2019 C/B S 28.19 479,750
4/3/2019 S/Sh S 27.80 479,750
4/4/2019 C/B S 30.48 473,840
4/4/2019 S/Sh S 30.11 473,840
4/5/2019 Sht S 28.89 508,667
4/5/2019 Cov o 26.77 508,667
4/8/2019 Sht S 26.73 511,602
4/8/2019 Cov o 26.58 511,602
4/9/2019 Buy S 26.60 526,965
4/9/2019 Sell o 27.40 526,965
4/10/2019 Sht S 27.36 509,768
4/10/2019 Cov o 28.25 509,768
4/11/2019 C/B S 28.25 509,007
4/11/2019 S/Sh S 28.21 509,007
4/12/2019 Sht S 25.73 507,793
4/12/2019 Cov o 25.79 507,793
4/15/2019 C/B S 25.79 506,829
4/15/2019 S/Sh S 25.74 506,829
4/16/2019 C/B S 26.30 500,094
4/16/2019 S/Sh S 25.95 500,094
4/17/2019 C/B S 25.94 495,518
4/17/2019 S/Sh S 25.71 495,518
4/18/2019 Buy S 26.65 495,406
4/18/2019 Sell o 26.64 495,406
4/22/2019 Sht S 26.61 519,726
4/22/2019 Cov o 25.30 519,726
4/23/2019 C/B S 25.40 516,983
4/23/2019 S/Sh S 25.27 516,983
4/24/2019 Buy S 25.22 535,751
4/24/2019 Sell o 26.14 535,751
4/25/2019 Buy S 26.32 570,330
4/25/2019 Sell o 28.02 570,330
4/26/2019 C/B S 28.02 569,847
4/26/2019 S/Sh S 28.00 569,847
4/29/2019 C/B S 28.60 566,403
4/29/2019 S/Sh S 28.43 566,403
4/30/2019 C/B S 28.78 552,708
4/30/2019 S/Sh S 28.10 552,708
5/1/2019 C/B S 30.29 548,382
5/1/2019 S/Sh S 30.06 548,382
5/2/2019 Buy S 33.42 574,293
5/2/2019 Sell o 35.00 574,293
5/3/2019 Sht S 34.90 582,366
5/3/2019 Cov o 34.41 582,366
5/6/2019 C/B S 34.41 580,694
5/6/2019 S/Sh S 34.31 580,694
5/7/2019 C/B S 33.77 579,123
5/7/2019 S/Sh S 33.68 579,123
5/8/2019 C/B S 33.57 573,994
5/8/2019 S/Sh S 33.28 573,994
5/9/2019 C/B S 33.08 572,854
5/9/2019 S/Sh S 33.02 572,854
5/10/2019 C/B S 32.69 572,192
5/10/2019 S/Sh S 32.65 572,192
5/13/2019 Buy S 32.12 596,761
5/13/2019 Sell o 33.50 596,761
5/14/2019 Sht S 33.48 601,943
5/14/2019 Cov o 33.19 601,943
5/15/2019 C/B S 33.19 601,561
5/15/2019 S/Sh S 33.17 601,561
5/16/2019 Sht S 30.21 584,795
5/16/2019 Cov o 31.05 584,795
5/17/2019 Buy S 31.05 619,623
5/17/2019 Sell o 32.90 619,623
5/20/2019 C/B S 33.01 616,929
5/20/2019 S/Sh S 32.87 616,929
5/21/2019 Sht S 33.09 636,634
5/21/2019 Cov o 32.03 636,634
5/22/2019 Buy S 32.03 733,814
5/22/2019 Sell o 36.92 733,814
5/23/2019 Buy S 36.92 794,222
5/23/2019 Sell o 39.96 794,222
5/24/2019 C/B S 40.52 781,452
5/24/2019 S/Sh S 39.87 781,452
5/28/2019 Buy S 40.66 838,127
5/28/2019 Sell o 43.61 838,127
5/29/2019 C/B S 43.61 835,659
5/29/2019 S/Sh S 43.48 835,659
5/30/2019 Buy S 42.17 944,933
5/30/2019 Sell o 47.69 944,933
5/31/2019 C/B S 47.69 942,035
5/31/2019 S/Sh S 47.54 942,035
6/3/2019 C/B S 47.23 918,983
6/3/2019 S/Sh S 46.09 918,983
6/4/2019 Sht S 44.20 955,548
6/4/2019 Cov o 42.44 955,548
6/5/2019 Buy S 42.54 1,052,825
6/5/2019 Sell o 46.87 1,052,825
6/6/2019 C/B S 47.27 1,042,387
6/6/2019 S/Sh S 46.80 1,042,387
6/7/2019 C/B S 46.25 1,037,370
6/7/2019 S/Sh S 46.03 1,037,370
6/10/2019 C/B S 46.79 1,014,519
6/10/2019 S/Sh S 45.77 1,014,519
6/11/2019 C/B S 48.31 985,835
6/11/2019 S/Sh S 46.96 985,835
6/12/2019 Buy S 50.21 973,844
6/12/2019 Sell o 49.60 973,844
6/13/2019 Sht S 49.52 989,707
6/13/2019 Cov o 48.71 989,707
6/14/2019 Buy S 49.36 1,077,030
6/14/2019 Sell o 53.72 1,077,030
6/17/2019 C/B S 53.72 1,075,488
6/17/2019 S/Sh S 53.64 1,075,488
6/18/2019 Sht S 48.89 1,112,154
6/18/2019 Cov o 47.22 1,112,154
6/19/2019 C/B S 47.70 1,099,093
6/19/2019 S/Sh S 47.14 1,099,093
6/20/2019 Sht S 45.39 1,121,407
6/20/2019 Cov o 44.47 1,121,407
6/21/2019 C/B S 45.29 1,098,579
6/21/2019 S/Sh S 44.38 1,098,579
6/24/2019 Buy S 45.70 1,140,962
6/24/2019 Sell o 47.46 1,140,962
6/25/2019 C/B S 47.46 1,138,544
6/25/2019 S/Sh S 47.36 1,138,544
6/26/2019 Sht S 45.99 1,197,738
6/26/2019 Cov o 43.60 1,197,738
6/27/2019 C/B S 43.69 1,193,861
6/27/2019 S/Sh S 43.55 1,193,861
6/28/2019 Sht S 42.38 1,294,863
6/28/2019 Cov o 38.79 1,294,863
7/1/2019 Buy S 41.87 1,290,364
7/1/2019 Sell o 41.72 1,290,364
7/2/2019 Buy S 41.94 1,409,554
7/2/2019 Sell o 45.81 1,409,554
7/3/2019 C/B S 46.28 1,393,250
7/3/2019 S/Sh S 45.75 1,393,250
7/5/2019 Sht S 45.56 1,452,516
7/5/2019 Cov o 43.62 1,452,516
7/8/2019 C/B S 43.80 1,444,674
7/8/2019 S/Sh S 43.56 1,444,674
7/9/2019 C/B S 45.78 1,442,917
7/9/2019 S/Sh S 45.72 1,442,917
7/10/2019 Sht S 44.77 1,526,126
7/10/2019 Cov o 42.19 1,526,126
7/11/2019 C/B S 42.78 1,502,635
7/11/2019 S/Sh S 42.13 1,502,635
7/12/2019 Sht S 44.99 1,527,663
7/12/2019 Cov o 44.24 1,527,663
7/15/2019 Buy S 44.72 1,641,274
7/15/2019 Sell o 48.05 1,641,274
7/16/2019 Buy S 48.26 1,750,839
7/16/2019 Sell o 51.48 1,750,839
7/17/2019 Buy S 51.75 1,898,622
7/17/2019 Sell o 56.12 1,898,622
7/18/2019 Buy S 56.49 1,954,560
7/18/2019 Sell o 58.15 1,954,560
7/19/2019 C/B S 58.15 1,948,499
7/19/2019 S/Sh S 57.97 1,948,499
7/22/2019 C/B S 56.57 1,911,688
7/22/2019 S/Sh S 55.51 1,911,688
7/23/2019 C/B S 55.78 1,885,707
7/23/2019 S/Sh S 55.03 1,885,707
7/24/2019 Sht S 54.05 1,887,447
7/24/2019 Cov o 53.99 1,887,447
7/25/2019 Buy S 54.55 2,127,934
7/25/2019 Sell o 61.50 2,127,934
7/26/2019 Buy S 61.50 2,240,025
7/26/2019 Sell o 64.74 2,240,025
7/29/2019 Buy S 65.45 2,357,410
7/29/2019 Sell o 68.88 2,357,410
7/30/2019 Sht S 68.71 2,840,707
7/30/2019 Cov o 54.62 2,840,707
7/31/2019 C/B S 56.74 2,723,251
7/31/2019 S/Sh S 54.44 2,723,251
8/1/2019 C/B S 57.31 2,714,473
8/1/2019 S/Sh S 57.13 2,714,473
8/2/2019 C/B S 65.14 2,647,720
8/2/2019 S/Sh S 63.56 2,647,720
8/5/2019 Buy S 69.99 2,761,195
8/5/2019 Sell o 72.99 2,761,195
8/6/2019 Buy S 74.57 3,052,633
8/6/2019 Sell o 82.44 3,052,633
8/7/2019 C/B S 82.44 3,043,065
8/7/2019 S/Sh S 82.18 3,043,065
8/8/2019 Sht S 75.75 3,203,390
8/8/2019 Cov o 71.76 3,203,390
8/9/2019 C/B S 75.15 3,040,541
8/9/2019 S/Sh S 71.43 3,040,541
8/12/2019 Buy S 76.88 3,192,712
8/12/2019 Sell o 80.73 3,192,712
8/13/2019 C/B S 80.73 3,185,274
8/13/2019 S/Sh S 80.54 3,185,274
8/14/2019 C/B S 82.95 3,181,493
8/14/2019 S/Sh S 82.85 3,181,493
8/15/2019 C/B S 91.68 3,176,520
8/15/2019 S/Sh S 91.54 3,176,520
8/16/2019 Sht S 88.89 3,618,109
8/16/2019 Cov o 76.53 3,618,109
8/19/2019 Sht S 76.31 3,781,206
8/19/2019 Cov o 72.87 3,781,206
8/20/2019 C/B S 72.89 3,768,023
8/20/2019 S/Sh S 72.64 3,768,023
8/21/2019 C/B S 74.80 3,566,448
8/21/2019 S/Sh S 70.91 3,566,448
8/22/2019 C/B S 76.02 3,436,178
8/22/2019 S/Sh S 73.30 3,436,178
8/23/2019 C/B S 83.00 3,425,601
8/23/2019 S/Sh S 82.75 3,425,601
8/26/2019 Sht S 86.68 3,479,674
8/26/2019 Cov o 85.31 3,479,674
8/27/2019 Buy S 89.09 3,466,019
8/27/2019 Sell o 88.74 3,466,019
8/28/2019 Sht S 88.51 3,906,095
8/28/2019 Cov o 77.27 3,906,095
8/29/2019 Sht S 77.05 4,215,363
8/29/2019 Cov o 70.95 4,215,363
8/30/2019 Buy S 72.77 4,741,196
8/30/2019 Sell o 81.85 4,741,196
9/3/2019 C/B S 81.85 4,729,332
9/3/2019 S/Sh S 81.65 4,729,332
9/4/2019 Sht S 76.91 5,088,470
9/4/2019 Cov o 71.07 5,088,470
9/5/2019 Sht S 70.87 5,196,743
9/5/2019 Cov o 69.36 5,196,743
9/6/2019 Buy S 69.36 5,014,663
9/6/2019 Sell o 66.93 5,014,663
9/9/2019 Sht S 66.74 5,826,923
9/9/2019 Cov o 55.93 5,826,923
9/10/2019 Sht S 55.72 5,714,724
9/10/2019 Cov o 56.79 5,714,724
9/11/2019 C/B S 58.85 5,480,121
9/11/2019 S/Sh S 56.49 5,480,121
9/12/2019 C/B S 60.00 5,448,723
9/12/2019 S/Sh S 59.66 5,448,723
9/13/2019 Sht S 56.79 6,713,446
9/13/2019 Cov o 43.61 6,713,446
9/16/2019 Sht S 43.40 7,449,263
9/16/2019 Cov o 38.64 7,449,263
9/17/2019 Buy S 39.16 8,563,705
9/17/2019 Sell o 45.02 8,563,705
9/18/2019 C/B S 45.02 8,509,359
9/18/2019 S/Sh S 44.74 8,509,359
9/19/2019 C/B S 46.51 7,994,603
9/19/2019 S/Sh S 43.79 7,994,603
9/20/2019 C/B S 49.03 7,670,414
9/20/2019 S/Sh S 47.08 7,670,414
9/23/2019 C/B S 48.93 7,631,544
9/23/2019 S/Sh S 48.68 7,631,544
9/24/2019 Buy S 49.12 8,588,579
9/24/2019 Sell o 55.28 8,588,579
9/25/2019 C/B S 55.28 8,569,086
9/25/2019 S/Sh S 55.15 8,569,086
9/26/2019 Buy S 55.59 9,358,309
9/26/2019 Sell o 60.71 9,358,309
9/27/2019 C/B S 60.71 9,334,375
9/27/2019 S/Sh S 60.56 9,334,375
9/30/2019 C/B S 60.85 9,308,097
9/30/2019 S/Sh S 60.68 9,308,097
10/1/2019 C/B S 61.16 9,177,926
10/1/2019 S/Sh S 60.31 9,177,926
10/2/2019 C/B S 69.88 9,155,819
10/2/2019 S/Sh S 69.71 9,155,819
10/3/2019 C/B S 74.99 9,132,498
10/3/2019 S/Sh S 74.80 9,132,498
10/4/2019 C/B S 69.61 8,864,689
10/4/2019 S/Sh S 67.60 8,864,689
10/7/2019 C/B S 70.14 8,837,197
10/7/2019 S/Sh S 69.92 8,837,197
10/8/2019 Buy S 75.13 9,218,289
10/8/2019 Sell o 78.37 9,218,289
10/9/2019 C/B S 81.46 8,838,392
10/9/2019 S/Sh S 78.17 8,838,392
10/10/2019 C/B S 82.33 8,724,250
10/10/2019 S/Sh S 81.27 8,724,250
10/11/2019 Sht S 77.73 8,622,246
10/11/2019 Cov o 78.64 8,622,246
10/14/2019 C/B S 78.64 8,607,044
10/14/2019 S/Sh S 78.50 8,607,044
10/15/2019 C/B S 79.46 8,591,326
10/15/2019 S/Sh S 79.32 8,591,326
10/16/2019 C/B S 77.99 8,491,428
10/16/2019 S/Sh S 77.09 8,491,428
10/17/2019 C/B S 80.12 8,438,902
10/17/2019 S/Sh S 79.62 8,438,902
10/18/2019 C/B S 79.66 8,357,244
10/18/2019 S/Sh S 78.89 8,357,244
10/21/2019 C/B S 88.78 8,349,615
10/21/2019 S/Sh S 88.70 8,349,615
10/22/2019 C/B S 84.95 8,222,185
10/22/2019 S/Sh S 83.67 8,222,185
10/23/2019 C/B S 81.14 8,157,109
10/23/2019 S/Sh S 80.51 8,157,109
10/24/2019 Buy S 75.75 8,322,253
10/24/2019 Sell o 77.28 8,322,253
10/25/2019 C/B S 77.28 8,309,745
10/25/2019 S/Sh S 77.16 8,309,745
10/28/2019 C/B S 70.97 8,022,095
10/28/2019 S/Sh S 68.55 8,022,095
10/29/2019 C/B S 75.04 7,835,907
10/29/2019 S/Sh S 73.32 7,835,907
10/30/2019 Buy S 68.13 8,604,777
10/30/2019 Sell o 74.82 8,604,777
10/31/2019 C/B S 75.72 8,483,936
10/31/2019 S/Sh S 74.66 8,483,936
11/1/2019 Sht S 74.59 9,625,972
11/1/2019 Cov o 64.55 9,625,972
11/4/2019 Sht S 64.45 11,206,432
11/4/2019 Cov o 53.87 11,206,432
11/5/2019 Sht S 53.69 10,826,532
11/5/2019 Cov o 55.51 10,826,532
11/6/2019 C/B S 56.48 10,584,722
11/6/2019 S/Sh S 55.24 10,584,722
11/7/2019 Sht S 55.00 9,814,654
11/7/2019 Cov o 59.00 9,814,654
11/8/2019 C/B S 59.00 9,762,369
11/8/2019 S/Sh S 58.69 9,762,369
11/11/2019 C/B S 58.90 9,712,055
11/11/2019 S/Sh S 58.60 9,712,055
11/12/2019 C/B S 61.06 9,430,725
11/12/2019 S/Sh S 59.31 9,430,725
11/13/2019 C/B S 63.00 9,417,559
11/13/2019 S/Sh S 62.91 9,417,559
11/14/2019 C/B S 64.71 9,183,252
11/14/2019 S/Sh S 63.12 9,183,252
11/15/2019 Sht S 65.75 9,485,082
11/15/2019 Cov o 63.59 9,485,082
11/18/2019 Buy S 63.59 10,724,586
11/18/2019 Sell o 71.90 10,724,586
11/19/2019 Buy S 71.90 11,370,434
11/19/2019 Sell o 76.23 11,370,434
11/20/2019 C/B S 77.53 11,152,007
11/20/2019 S/Sh S 76.05 11,152,007
11/21/2019 C/B S 75.91 10,809,632
11/21/2019 S/Sh S 73.62 10,809,632
11/22/2019 C/B S 72.59 10,614,835
11/22/2019 S/Sh S 71.29 10,614,835
11/25/2019 C/B S 72.41 10,590,641
11/25/2019 S/Sh S 72.25 10,590,641
11/26/2019 Buy S 67.71 11,496,914
11/26/2019 Sell o 73.50 11,496,914
11/27/2019 C/B S 74.05 11,395,772
11/27/2019 S/Sh S 73.40 11,395,772
11/29/2019 C/B S 73.57 11,384,635
11/29/2019 S/Sh S 73.50 11,384,635
12/2/2019 C/B S 76.21 10,974,799
12/2/2019 S/Sh S 73.52 10,974,799
12/3/2019 C/B S 80.00 10,965,070
12/3/2019 S/Sh S 79.93 10,965,070
12/4/2019 Sht S 78.02 12,050,581
12/4/2019 Cov o 70.30 12,050,581
12/5/2019 C/B S 72.10 11,726,912
12/5/2019 S/Sh S 70.19 11,726,912
12/6/2019 Sht S 73.41 12,829,137
12/6/2019 Cov o 66.51 12,829,137

Update 1/9/20

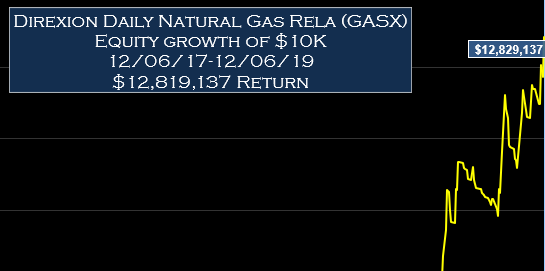
Trades since first publication. Note that some days there was 2 signals and 2 trades, but because we use daily OHLC prices the backtester can't tell if the buy or sell signal came first. In this case we average the profits from the buy-sell and short-cover transactions. These transactions show up as S/Sh and C/B below. Here we show the value at the next open.


Date Type Price Value NOpen
Initial 10,000
12/4/2019 Sht S 78.02 10,975
12/4/2019 Cov o 70.30 10,975
12/5/2019 C/B S 72.10 10,667
12/5/2019 S/Sh S 70.19 10,667
12/6/2019 Sht S 73.41 11,322
12/6/2019 Cov o 68.80 11,322
12/9/2019 C/B S 68.80 11,291
12/9/2019 S/Sh S 68.69 11,291
12/10/2019 Sht S 61.31 11,518
12/10/2019 Cov o 60.00 11,518
12/11/2019 C/B S 60.65 11,337
12/11/2019 S/Sh S 59.78 11,337
12/12/2019 Sht S 60.25 12,649
12/12/2019 Cov o 53.20 12,649
12/13/2019 C/B S 54.35 12,313
12/13/2019 S/Sh S 52.98 12,313
12/16/2019 Sht S 54.66 12,879
12/16/2019 Cov o 52.08 12,879
12/17/2019 Sht S 51.88 13,464
12/17/2019 Cov o 49.47 13,464
12/18/2019 C/B S 49.47 13,405
12/18/2019 S/Sh S 49.30 13,405
12/19/2019 Sht S 45.83 14,147
12/19/2019 Cov o 43.25 14,147
12/20/2019 Buy S 44.57 14,415
12/20/2019 Sell o 45.46 14,415
12/23/2019 Sht S 45.30 15,819
12/23/2019 Cov o 40.84 15,819
12/24/2019 C/B S 41.54 15,480
12/24/2019 S/Sh S 40.69 15,480
12/26/2019 Sht S 40.38 15,456
12/26/2019 Cov o 40.41 15,456
12/27/2019 Buy S 41.01 16,204
12/27/2019 Sell o 43.03 16,204
12/30/2019 C/B S 43.61 15,942
12/30/2019 S/Sh S 42.94 15,942
12/31/2019 C/B S 44.10 15,905
12/31/2019 S/Sh S 44.04 15,905
1/2/2020 C/B S 41.60 15,448
1/2/2020 S/Sh S 40.46 15,448
1/3/2020 Sht S 39.96 15,770
1/3/2020 Cov o 39.09 15,770
1/6/2020 Sht S 39.05 15,986
1/6/2020 Cov o 38.48 15,986
1/7/2020 C/B S 39.12 15,688
1/7/2020 S/Sh S 38.43 15,688
1/8/2020 C/B S 37.60 15,649
1/8/2020 S/Sh S 37.54 15,649
1/9/2020 C/B S 41.92 15,649
ROKU Algorithm

ROKU Signals Daily (MBCYI MBHOI)

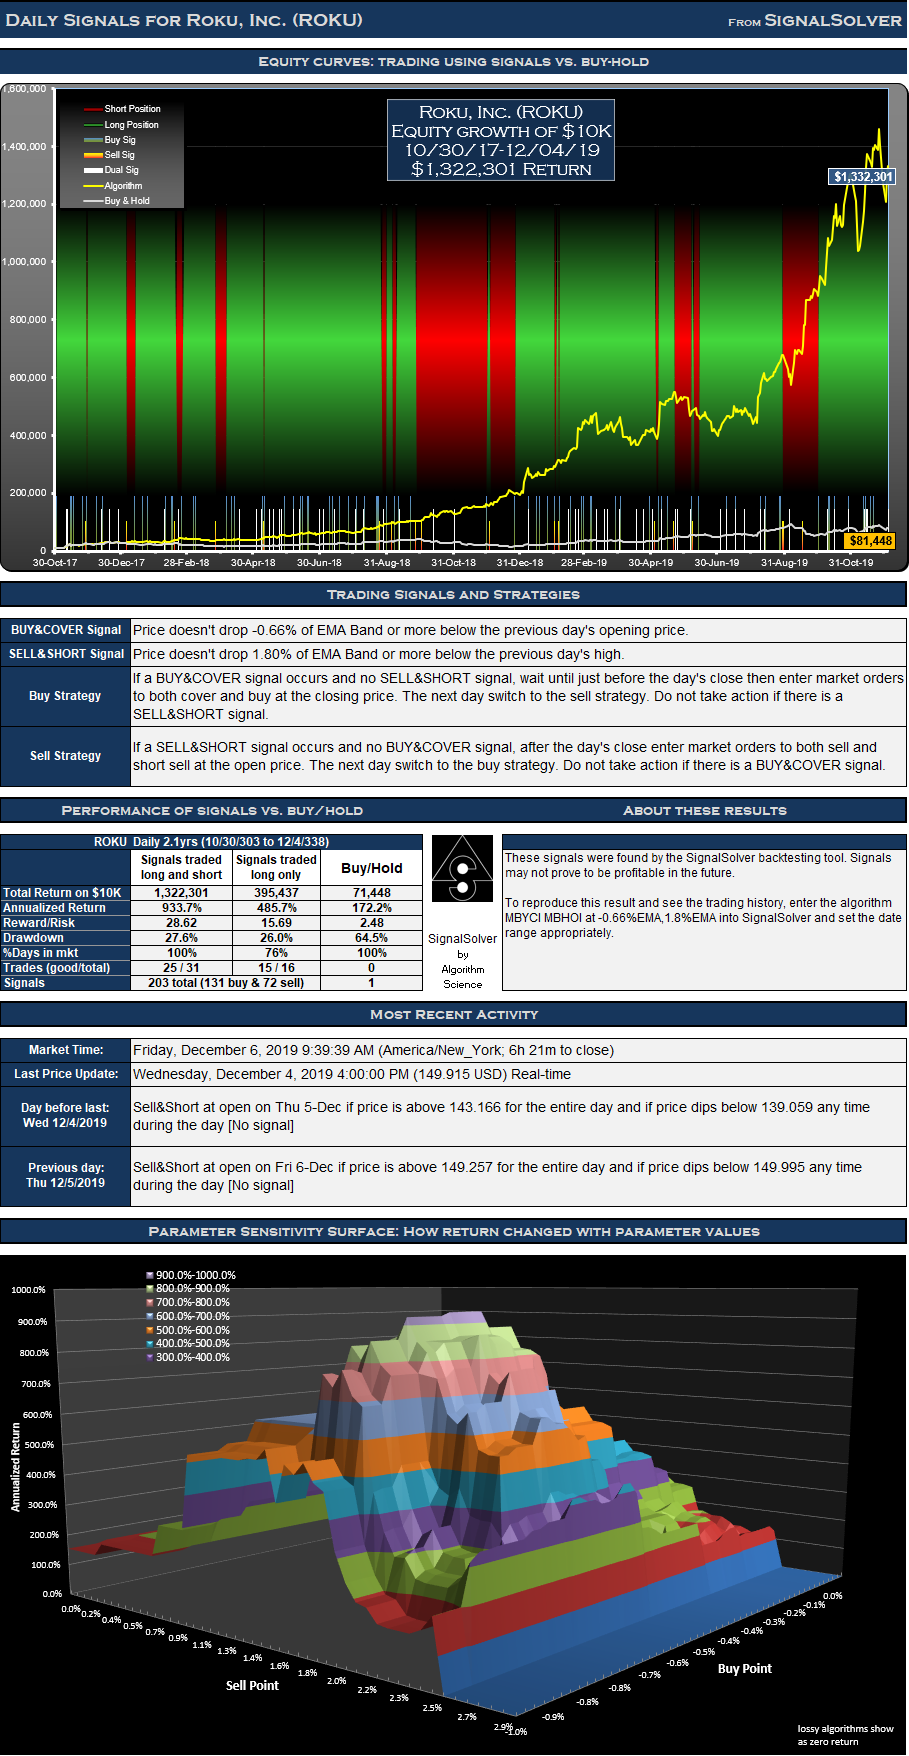
Its not often that I run into algorithms with a Reward/Risk in excess of 28, but here's one. Its kind of obscure, but it shows what SignalSolver is capable of digging up. These Roku, Inc. (ROKU) signals traded as directed would have performed around 18.5 times better than buy-hold with an ROI of 13223% for the period 30-Oct-17 to 04-Dec-19. It has several earmarks of a "good" trading system, very high returns (quarterly returns range from 497% to 1708% annualized) a relatively low drawdown (less than half of ROKU buy-hold), 15 of 16 trades were good on the long side, low trading frequency and smooth parameter sensitivity (especially on the long trade side).

On the negative side, this algorithm is definitely out there. Reading through the strategy there's no obvious logic to it. For one thing it uses the EMA band, a price series derived by taking the exponential moving average of the last 10 median daily prices (H+L)/2 . All buy and sell percentages are relative to this series. Secondly, the parameter for high performance are restricted to quite a narrow range suggesting over-optimization. However, the values are sufficiently close to zero to may be OK. Thirdly, the signals look "confused". The short side did catch the major pullbacks but personally I wouldn't feel very comfortable playing the short side of this one. Regardless, I'll post it because its unusual and I'm curious to see how it does. My expectation is it will nosedive, but you never really know for sure. Check in from time to time--I'm not going to track this on a daily basis.

Incidentally, ROKU is a fertile territory for finding high performance algorithms, most of them "spinners" with high trading frequencies

ROKU Daily MBCYI MBHOI

ROKU Signals

About the ROKU Signals

The trading signals for Roku, Inc. (ROKU) were selected for their reward/risk, longevity and parameter sensitivity characteristics. Backtests don't always generate reliable signals which can be counted on moving forward but many traders find value in knowing what buy and sell signals would have worked well in the past.

Returns for the Roku, Inc. (ROKU) signals

For the 528 day (2.1 year) period from Oct 30 2017 to Dec 4 2019, these signals for Roku, Inc. (ROKU) traded both long and short would have yielded $1,322,301 in profits from a $10,000 initial investment, an annualized return of 933.7%. Traded long only (no short selling) the signals would have returned $395,437, an annualized return of 485.7%. 75.6% of time was spent holding stock long. The return would have been $71,448 (an annualized return of 172.2%) if you had bought and held the stock for the same period.

Signals and Trades

We call this a daily strategy as daily OHLC data is used in the numerical analysis leading to at most one buy signal and one sell signal per day. However, not all signals result in trades. If you are already long in a security, buy signals are not acted upon, similarly if you are short you should ignore sell signals. There were 131 buy signals and 72 sell signals for this particular ROKU strategy which in turn led to 16 round trip long trades of which 15 were profitable, and 15 short trades of which 10 were profitable.

Drawdown and Reward/Risk

Drawdown (the worst case loss for an single entry and exit into the strategy) was 28% for long-short and 26% for long only. This compares to 65% for buy-hold. The reward/risk for the trading long and short was 28.62 compared to 2.48 for buy-hold, a factor of 11.6 improvement. If traded long only, the reward/risk was 15.69. We use drawdown plus 5% as our risk metric, and annualized return as the reward metric.

The backtests assume a commission per trade of $0.

Parameter sensitivity

We look for signals which are not too sensitive to changes in the buy or sell point. Here you see the effect on returns when the buy point or sell point is changed for the Long side of the algorithm. On the short side, the algorithm led to a complete loss for sell points above 2.5%. The surface plot above can also be used for this analysis, here we just show the cross section of the surface at the buy and sell points.

ROKU Parameter Sensitivity

Trade List

Click to see trades

Split adjusted prices used throughout.
Key:
Buy C: Buy at close
RvS O: Reverse to Short at next day open (or sell if using Long style)
RvL C: Reverse to Long at current day close (or buy if using Long style)

Day of signal Buy or Sell Price L&S Value Next Open
10/31/2017 Buy C 20.38 10,029
11/27/2017 RvS O 49.40 24,239
11/28/2017 RvL C 46.43 24,634
1/3/2018 RvS O 51.56 28,536
1/11/2018 RvL C 43.87 33,263
2/16/2018 RvS O 50.45 37,710
2/23/2018 RvL C 41.52 44,706
3/26/2018 RvS O 33.55 35,865
4/5/2018 RvL C 31.76 36,946
5/9/2018 RvS O 38.30 45,558
5/10/2018 RvL C 35.46 46,591
8/24/2018 RvS O 64.00 88,323
8/30/2018 RvL C 60.68 92,430
9/4/2018 RvS O 63.06 96,549
9/7/2018 RvL C 65.23 95,042
9/26/2018 RvS O 73.75 105,403
11/30/2018 RvL C 40.75 162,376
12/3/2018 RvS O 41.59 155,712
12/26/2018 RvL C 30.35 198,837
1/31/2019 RvS O 45.02 293,400
2/1/2019 RvL C 45.21 292,355
2/4/2019 RvS O 48.50 313,423
2/5/2019 RvL C 48.16 314,768
5/3/2019 RvS O 63.05 413,202
5/7/2019 RvL C 64.41 401,716
5/21/2019 RvS O 87.79 551,041
6/6/2019 RvL C 100.25 475,238
6/7/2019 RvS O 102.38 482,878
6/13/2019 RvL C 104.97 467,793
8/29/2019 RvS O 150.98 676,961
10/1/2019 RvL C 102.40 881,764
12/5/2019 Last 152.47 1,332,301

Update 1/9/20

No signals since 10/1/19 for this algorithm.


Date Transaction Buy/Cover Sell/Short  Asset Value
4-Dec-2019 Initial Buy 149.915  $           10,000
9-Jan-2020 last 133.170  $             8,883
Amazon AMZN Signals Daily

Amazon (AMZN) Signals-Daily

These Amazon.com, Inc. (AMZN) signals traded as directed would have performed around 3.6 times better than buy-hold with an ROI of 391% for the period 02-Nov-16 to 07-Dec-18. This is a symmetrical algorithm with no buy or sell bias.

AMZN Daily Signals

"The trading signals for Amazon.com, Inc. (AMZN) were selected for their reward/risk, longevity and parameter sensitivity characteristics. Backtests don't always generate reliable signals which can be counted on moving forward but many traders find value in knowing what buy and sell signals would have worked well in the past.

Returns for the Amazon.com, Inc. (AMZN) signals

For the 528 day (2.1 year) period from Nov 2 2016 to Dec 7 2018, these signals for Amazon.com, Inc. (AMZN) traded both long and short would have yielded $39,084 in profits from a $10,000 initial investment, an annualized return of 113.5%. Traded long only (no short selling) the signals would have returned $23,562, an annualized return of 78.1%. 47.8% of time was spent holding stock long. The return would have been $10,782 (an annualized return of 41.7%) if you had bought and held the stock for the same period.

Signals and Trades

We call this a daily strategy as daily OHLC data is used in the numerical analysis leading to at most one buy signal and one sell signal per day. However, not all signals result in trades. If you are already long in a security, buy signals are not acted upon, similarly if you are short you should ignore sell signals. There were 259 buy signals and 290 sell signals for this particular AMZN strategy which in turn led to 128 round trip long trades of which 81 were profitable, and 128 short trades of which 64 were profitable.

Drawdown and Reward/Risk

Drawdown (the worst case loss for an single entry and exit into the strategy) was 13% for long-short and 8% for long only. This compares to 29% for buy-hold. The reward/risk for the trading long and short was 6.31 compared to 1.21 for buy-hold, a factor of 5.2 improvement. If traded long only, the reward/risk was 5.91. We use drawdown plus 5% as our risk metric, and annualized return as the reward metric.

The algorithm uses Bollinger bands with an SD (Excel STDEVPA) of the trailing 50 (H+L)/2 prices, scaled by a factor of 10.

The backtests assume a commission per trade of $7. "

TSLA Signals Daily Equity

Tesla (TSLA) Signals-Daily

These Tesla (TSLA) signals would have performed around 29 times better than buy-hold with an ROI of 1,043% for the period 24-Aug-16 to 27-Sep-18

TSLA Signals Daily

The trading signals for Tesla (TSLA) were for their reward/risk, longevity and parameter sensitivity characteristics. Backtests don't always generate reliable signals which can be counted on moving forward but many traders find value in knowing what buy and sell signals would have worked well in the past.

Returns for the Tesla (TSLA) signals

For the 528 day (2.1 year) period from Aug 24 2016 to Sep 27 2018, these signals for Tesla (TSLA) traded both long and short would have yielded $104,289 in profits from a $10,000 initial investment, an annualized return of 220.5%. Traded long only (no short selling) the signals would have returned $33,530, an annualized return of 102.0%. 54.8% of time was spent holding stock long. The return would have been $3,606 (an annualized return of 15.9%) if you had bought and held the stock for the same period.

Signals and Trades

Not all signals are acted upon and signals are often reinforced in this type of strategy. If you are long in the security, buy signals are not acted on, for example. Similarly if you are short you must ignore sell signals. There were 194 buy signals and 205 sell signals for this particular TSLA strategy. These led to 77 round trip long trades of which 42 were profitable, and 77 short trades of which 34 were profitable. This is a daily strategy--daily OHLC data is used to derive all signals and there is at most one buy and sell signal and one trade per day.

Drawdown and Reward/Risk

Drawdown (the worst case loss for an single entry and exit into the strategy) was 16% for long-short and 16% for long only. This compares to 35% for buy-hold. The reward/risk for the trading long and short was 10.38 compared to 0.40 for buy-hold, a factor of 25.9 improvement. If traded long only, the reward/risk was 4.92. We use drawdown plus 5% as our risk metric, and annualized return as the reward metric.

The backtests assume a commission per trade of $7.

Click here to see the list of Trades

These are the trades which would have occurred had you used the signals as directed. They are the results of a simulation, not actual trades.

Day of signal Buy or Sell Price L&S Value Next Open
8/29/2016 Sell 216.11 9,993
9/6/2016 Buy 202.24 10,791
9/8/2016 Sell 199.09 10,441
9/12/2016 Buy 198.16 10,417
9/13/2016 Sell 195.75 10,334
9/15/2016 Buy 199.67 10,151
9/21/2016 Sell 206.40 10,440
9/23/2016 Buy 209.33 10,139
9/27/2016 Sell 207.51 10,174
10/18/2016 Buy 199.17 10,600
10/20/2016 Sell 198.60 10,526
11/4/2016 Buy 192.06 10,944
11/9/2016 Sell 191.05 10,787
11/11/2016 Buy 187.22 11,034
11/14/2016 Sell 182.78 10,714
11/15/2016 Buy 185.74 10,351
11/21/2016 Sell 185.84 10,518
11/22/2016 Buy 188.85 10,430
11/29/2016 Sell 191.00 10,437
12/5/2016 Buy 185.47 10,729
12/29/2016 Sell 216.30 12,495
1/3/2017 Buy 218.34 12,159
1/30/2017 Sell 249.24 14,098
1/31/2017 Buy 253.28 13,843
2/15/2017 Sell 277.60 15,173
2/17/2017 Buy 270.11 15,876
2/22/2017 Sell 264.00 15,202
2/24/2017 Buy 256.75 15,084
2/27/2017 Sell 244.19 14,828
2/28/2017 Buy 248.15 14,928
3/8/2017 Sell 247.63 14,529
3/14/2017 Buy 250.10 14,767
3/21/2017 Sell 251.56 14,441
3/24/2017 Buy 259.84 13,992
4/5/2017 Sell 296.88 15,926
4/6/2017 Buy 301.69 15,437
4/11/2017 Sell 306.34 15,881
4/13/2017 Buy 301.51 16,182
5/2/2017 Sell 317.67 16,968
5/5/2017 Buy 302.83 18,220
5/15/2017 Sell 317.59 18,598
5/18/2017 Buy 311.97 19,126
5/22/2017 Sell 310.46 18,807
5/25/2017 Buy 316.06 18,525
6/9/2017 Sell 357.99 20,888
6/12/2017 Buy 363.79 20,752
6/15/2017 Sell 377.98 21,323
6/22/2017 Buy 384.11 20,872
6/26/2017 Sell 376.40 20,528
7/11/2017 Buy 321.12 24,209
7/13/2017 Sell 323.19 23,666
7/18/2017 Buy 322.64 24,103
7/27/2017 Sell 336.89 24,724
7/31/2017 Buy 340.94 23,129
8/1/2017 Sell 318.94 22,825
8/2/2017 Buy 324.11 23,910
8/10/2017 Sell 356.97 24,702
8/23/2017 Buy 344.48 26,149
8/25/2017 Sell 347.28 25,746
8/29/2017 Buy 344.98 26,255
9/5/2017 Sell 349.50 26,228
9/7/2017 Buy 351.58 25,865
9/8/2017 Sell 351.35 26,026
9/11/2017 Buy 357.04 26,124
9/19/2017 Sell 373.00 26,720
10/3/2017 Buy 341.34 29,815
10/9/2017 Sell 346.80 29,423
10/10/2017 Buy 352.42 29,054
10/16/2017 Sell 350.91 28,795
10/18/2017 Buy 361.74 27,416
10/19/2017 Sell 352.69 27,181
10/31/2017 Buy 325.42 29,883
11/1/2017 Sell 300.13 26,980
11/2/2017 Buy 304.99 26,052
11/3/2017 Sell 307.00 26,690
11/7/2017 Buy 305.90 26,737
11/9/2017 Sell 302.50 26,461
11/10/2017 Buy 307.40 25,403
11/15/2017 Sell 313.99 26,562
11/21/2017 Buy 315.90 26,459
11/29/2017 Sell 308.56 25,760
12/5/2017 Buy 306.89 25,312
12/15/2017 Sell 344.90 29,077
1/2/2018 Buy 317.05 31,801
1/4/2018 Sell 316.62 31,353
1/8/2018 Buy 321.12 32,244
1/24/2018 Sell 348.27 33,492
1/29/2018 Buy 345.36 33,737
2/2/2018 Sell 337.97 33,022
2/5/2018 Buy 343.45 30,749
2/6/2018 Sell 338.99 32,038
2/7/2018 Buy 344.48 31,398
2/8/2018 Sell 319.93 29,245
2/13/2018 Buy 320.12 29,279
2/27/2018 Sell 352.57 32,161
3/2/2018 Buy 332.28 34,009
3/6/2018 Sell 325.44 33,284
3/7/2018 Buy 330.71 32,944
3/9/2018 Sell 328.61 32,509
3/12/2018 Buy 333.93 31,459
3/13/2018 Sell 336.76 32,225
3/21/2018 Buy 315.28 34,116
3/22/2018 Sell 311.25 33,815
3/29/2018 Buy 260.65 38,638
4/2/2018 Sell 269.82 40,668
4/4/2018 Buy 256.88 47,990
4/9/2018 Sell 298.97 49,573
4/10/2018 Buy 303.81 48,263
4/12/2018 Sell 303.60 48,708
4/18/2018 Buy 295.80 49,150
4/20/2018 Sell 291.29 49,171
4/26/2018 Buy 283.27 50,887
5/3/2018 Sell 283.00 50,451
5/4/2018 Buy 287.58 51,330
5/11/2018 Sell 303.32 52,320
5/16/2018 Buy 288.43 54,394
5/18/2018 Sell 281.33 53,511
5/21/2018 Buy 285.89 52,974
5/22/2018 Sell 277.76 51,119
5/29/2018 Buy 283.02 50,185
5/31/2018 Sell 285.86 50,626
6/1/2018 Buy 290.49 50,451
6/5/2018 Sell 300.50 51,493
6/6/2018 Buy 305.37 52,433
6/13/2018 Sell 347.63 57,640
6/14/2018 Buy 353.26 56,785
6/19/2018 Sell 358.04 57,445
6/20/2018 Buy 363.84 56,215
6/21/2018 Sell 351.54 54,577
6/25/2018 Buy 335.47 57,157
6/26/2018 Sell 345.00 58,665
6/27/2018 Buy 350.59 57,383
6/29/2018 Sell 360.07 59,247
7/6/2018 Buy 309.89 67,947
7/11/2018 Sell 321.43 69,989
7/17/2018 Buy 313.81 74,187
7/19/2018 Sell 321.23 73,313
7/25/2018 Buy 301.55 78,643
7/27/2018 Sell 295.90 76,320
7/31/2018 Buy 296.98 76,284
8/6/2018 Sell 343.84 88,007
8/7/2018 Buy 349.41 91,443
8/9/2018 Sell 354.00 87,691
8/10/2018 Buy 359.73 86,590
8/13/2018 Sell 358.45 85,934
8/20/2018 Buy 296.43 105,612
8/27/2018 Sell 318.41 108,251
9/6/2018 Buy 289.41 106,133
9/7/2018 Sell 273.26 111,489
9/10/2018 Buy 277.69 110,373
9/11/2018 Sell 281.44 111,137
9/12/2018 Buy 286.00 110,095
9/18/2018 Sell 280.51 107,210
9/19/2018 Buy 285.05 112,306
9/28/2018 Last 308.92 114,289