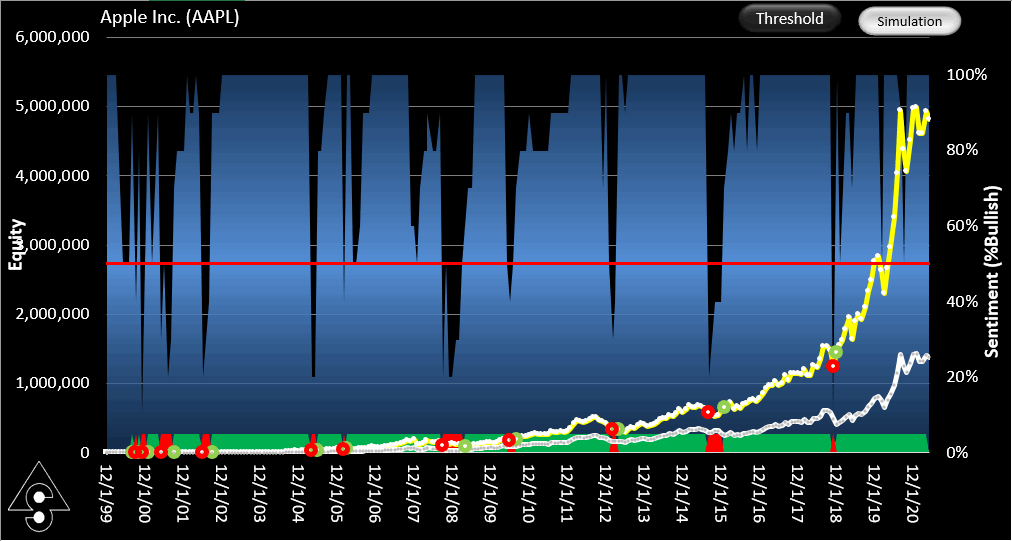
AAPL traded monthly using SignalSolver Sentiment (yellow) vs Buy-Hold (white). In the background (blue) is the sentiment.
What is sentiment?
When an analyst expresses a "bullish" sentiment about an investment it means that they think that the investment will increase in value. Similarly, "bearish" sentiment means the opposite-they think the value will fall. These are opinions usually based on many factors such as earnings forecasts and past performance.
How does SignalSolver calculate sentiment?
In contrast, SignalSolver sentiment is based purely on numerical analysis of historical price movements. The backtester finds the top N trading methodologies which have been profitable. N is user set. Some of these strategies are bullish, others are bearish. By simply taking the ratio of bullish to the total number of algorithms, you arrive at a "Bullish %" sentiment on which to base a trading decision.
Its quite easy to see the current sentiment of any algorithm. First, run a Solve on current data, then on the Report tab you can look to the algorithm list and see if it is showing red (bearish) or green (bullish)

Or you can read the Sentiment off the Sentiment column on the Algorithms tab:

How are sentiments combined?
Sentiment provides us with an extremely simple way to aggregate algorithms. A single algorithm is either bullish (100% bullish) if it is in a 'bought' state, or bearish (0% Bullish) if it is in a 'sold' state. If two algorithms disagree about sentiment, that would be 50% bullish. Three algorithms would combine t0 give 100%, 66.6%, 33.3% or 0% bullishness levels. 100 algorithms would have 101 bullishness levels, and so on. All algorithms carry equal weight in this method. The Sentiment Dashboard uses this method to graph SignalSolver Sentiment over time. Current Sentiment can be calculated for a number of securities using the Curr. Sent tab.
How is sentiment trading simulated?
The simulations of trading using SignalSolver Sentiment uses kind of walk-forward testing. The backtester works out the sentiment for the day, week or month, and this is used to make a trading decision. The trade can take place either at the close or at the following open. It then moves forward one time (OHLC) period and repeats the cycle. At each step, algorithms are sorted from best to worst, so as algorithms deteriorate or strengthen, they are automatically excluded or included into the top N algorithms.
How is this different to regular SignalSolver methodology?
Using older versions of SignalSolver, the user had to evaluate many algorithms and opt for an algorithm using the scanning tools in the program. Typically the algorithm would perform well for some period then performance would fall off. The user would have to frequently re-evaluate to decide if to switch to another algorithm or whether to re-parametize the original algorithm, and the evaluation could be a complex process.
Using SignalSolver Sentiment, the user is less concerned with individual algorithms since each algorithm contributes to only a fraction of the Sentiment. Algorithms which do well are included in the Sentiment calculation, those that do badly are automatically excluded as the simulation progresses. The user focuses on issues like how often to seek (find new algorithms) versus scan (re-parameterize existing algorithms), how many algorithms to average, and where on the buy-sell threshold surface to be positioned for the best performance. Once you are comfortable with the simulation settings you can consider paper trading or live trading it.
How would you trade live using SignalSolver Sentiment?
The program must be run every day, week or month (depending on the data interval) to see if a trade is indicated. If you prefer to trade at the close, you must run the program just prior to the close to read the sentiment, then trade accordingly. If trading at the following open, you should run the program after the close. A trade is indicated by the directive "Turned bullish" or "Turned bearish".
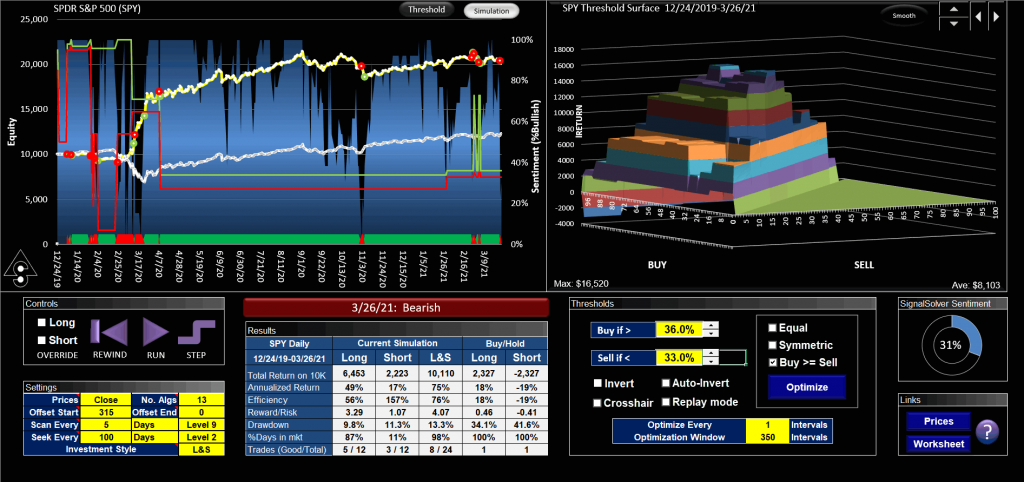
The Sentiment Dashboard
The "Current Sentiment" Tab
The "Current Sentiment" Tab
The idea of the "Current Sentiment" tab is to give the user a quick way to get the current sentiment for each of a list of symbols. SignalSolver reads the symbols list and gets current data for the first symbol. It then runs a seek or a scan (depending on the Report->Seek/Scan setting) on that data. When the backtester has finished, the algorithms are sorted on the Algorithms tab according to the Report tab->Optimization setting. The top N algorithms (depending on the Curr. Sent. tab->No. Algs setting) are then examined and a combined sentiment generated. The next symbol is then processed in the same way.
Sentiment results can change with-
- Days/Weeks/Months To Analyze (the number of data points in the sample)
- The type of Optimization
- If Sell % = Buy %
- Investment style
- The seek/scan level
- The buy and sell scan ranges
- The band selected
and other settings, so its a good idea to check sentiments for different settings before drawing any conclusions. Of these, the most significant is the number of days/weeks/months to analyze since its often true that a security has different long and short term sentiment.