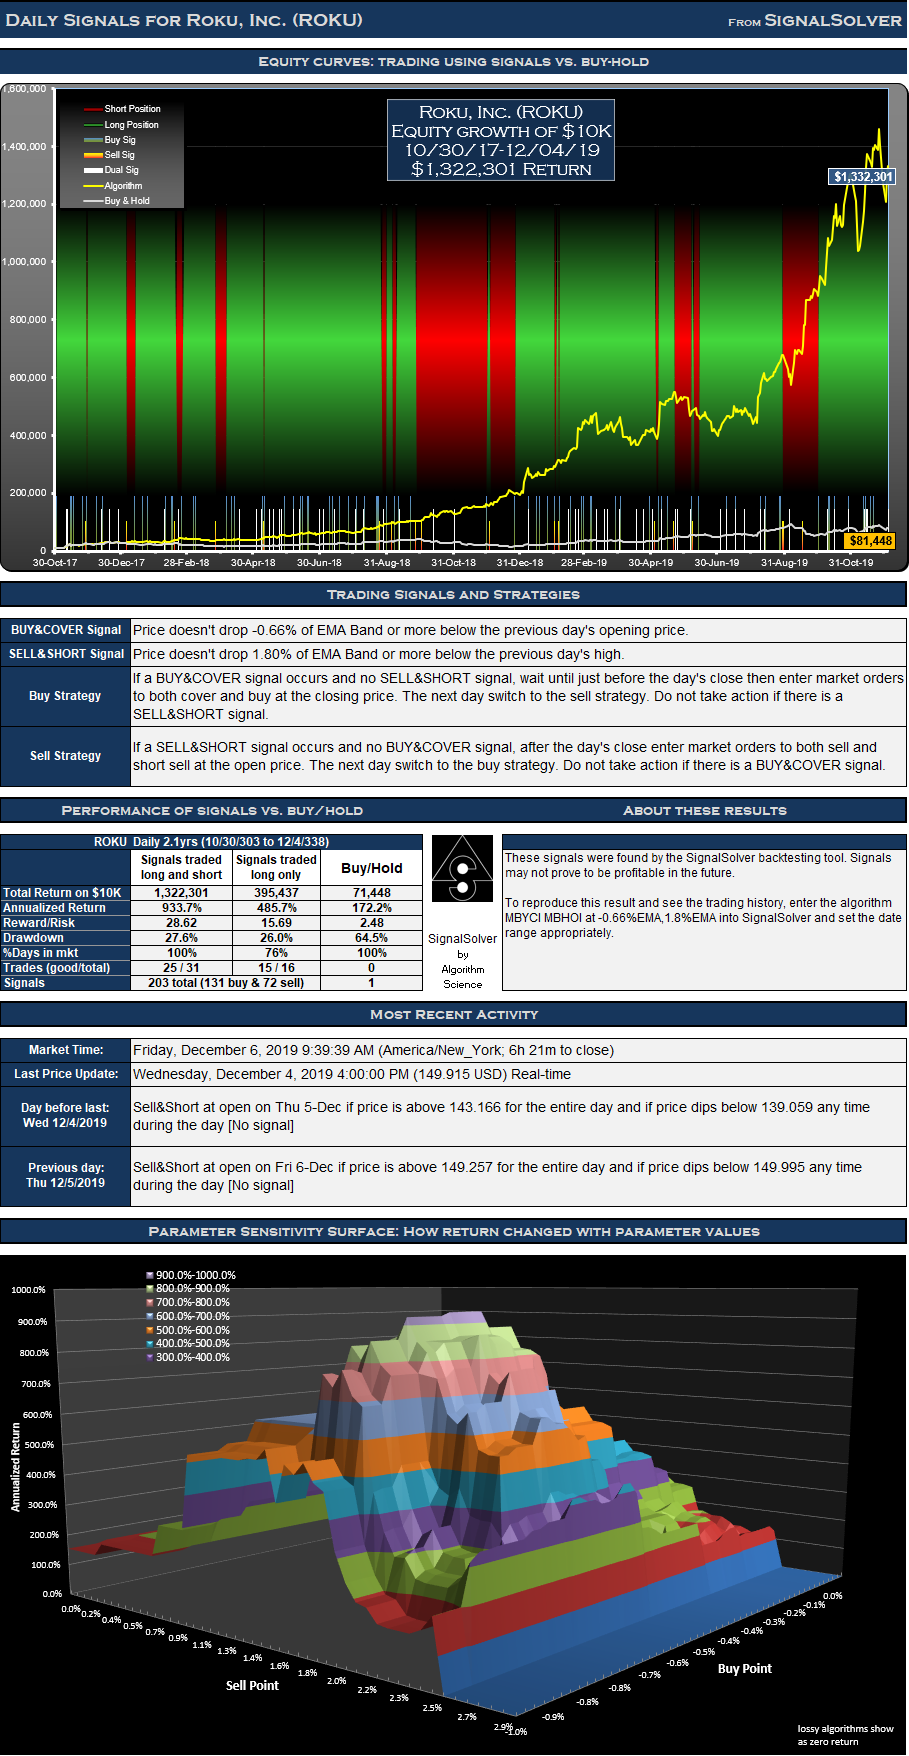
Its not often that I run into algorithms with a Reward/Risk in excess of 28, but here's one. Its kind of obscure, but it shows what SignalSolver is capable of digging up. These Roku, Inc. (ROKU) signals traded as directed would have performed around 18.5 times better than buy-hold with an ROI of 13223% for the period 30-Oct-17 to 04-Dec-19. It has several earmarks of a "good" trading system, very high returns (quarterly returns range from 497% to 1708% annualized) a relatively low drawdown (less than half of ROKU buy-hold), 15 of 16 trades were good on the long side, low trading frequency and smooth parameter sensitivity (especially on the long trade side).
On the negative side, this algorithm is definitely out there. Reading through the strategy there's no obvious logic to it. For one thing it uses the EMA band, a price series derived by taking the exponential moving average of the last 10 median daily prices (H+L)/2 . All buy and sell percentages are relative to this series. Secondly, the parameter for high performance are restricted to quite a narrow range suggesting over-optimization. However, the values are sufficiently close to zero to may be OK. Thirdly, the signals look "confused". The short side did catch the major pullbacks but personally I wouldn't feel very comfortable playing the short side of this one. Regardless, I'll post it because its unusual and I'm curious to see how it does. My expectation is it will nosedive, but you never really know for sure. Check in from time to time--I'm not going to track this on a daily basis.
Incidentally, ROKU is a fertile territory for finding high performance algorithms, most of them "spinners" with high trading frequencies
ROKU Daily MBCYI MBHOI
About the ROKU Signals
The trading signals for Roku, Inc. (ROKU) were selected for their reward/risk, longevity and parameter sensitivity characteristics. Backtests don't always generate reliable signals which can be counted on moving forward but many traders find value in knowing what buy and sell signals would have worked well in the past.
Returns for the Roku, Inc. (ROKU) signals
For the 528 day (2.1 year) period from Oct 30 2017 to Dec 4 2019, these signals for Roku, Inc. (ROKU) traded both long and short would have yielded $1,322,301 in profits from a $10,000 initial investment, an annualized return of 933.7%. Traded long only (no short selling) the signals would have returned $395,437, an annualized return of 485.7%. 75.6% of time was spent holding stock long. The return would have been $71,448 (an annualized return of 172.2%) if you had bought and held the stock for the same period.
Signals and Trades
We call this a daily strategy as daily OHLC data is used in the numerical analysis leading to at most one buy signal and one sell signal per day. However, not all signals result in trades. If you are already long in a security, buy signals are not acted upon, similarly if you are short you should ignore sell signals. There were 131 buy signals and 72 sell signals for this particular ROKU strategy which in turn led to 16 round trip long trades of which 15 were profitable, and 15 short trades of which 10 were profitable.
Drawdown and Reward/Risk
Drawdown (the worst case loss for an single entry and exit into the strategy) was 28% for long-short and 26% for long only. This compares to 65% for buy-hold. The reward/risk for the trading long and short was 28.62 compared to 2.48 for buy-hold, a factor of 11.6 improvement. If traded long only, the reward/risk was 15.69. We use drawdown plus 5% as our risk metric, and annualized return as the reward metric.
The backtests assume a commission per trade of $0.
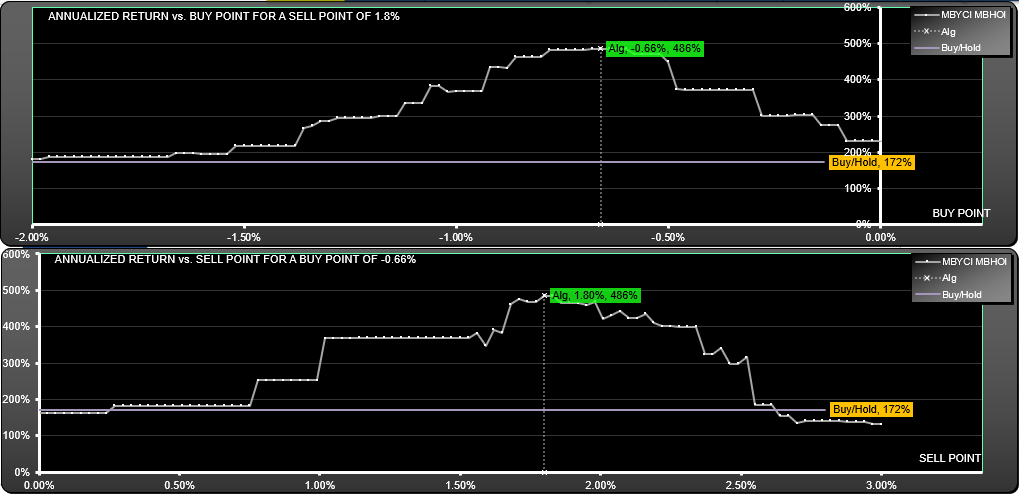
Parameter sensitivity
We look for signals which are not too sensitive to changes in the buy or sell point. Here you see the effect on returns when the buy point or sell point is changed for the Long side of the algorithm. On the short side, the algorithm led to a complete loss for sell points above 2.5%. The surface plot above can also be used for this analysis, here we just show the cross section of the surface at the buy and sell points.
Trade List
Split adjusted prices used throughout.
Key:
Buy C: Buy at close
RvS O: Reverse to Short at next day open (or sell if using Long style)
RvL C: Reverse to Long at current day close (or buy if using Long style)
| Day of signal | Buy or Sell | Price | L&S Value Next Open |
| 10/31/2017 | Buy C | 20.38 | 10,029 |
| 11/27/2017 | RvS O | 49.40 | 24,239 |
| 11/28/2017 | RvL C | 46.43 | 24,634 |
| 1/3/2018 | RvS O | 51.56 | 28,536 |
| 1/11/2018 | RvL C | 43.87 | 33,263 |
| 2/16/2018 | RvS O | 50.45 | 37,710 |
| 2/23/2018 | RvL C | 41.52 | 44,706 |
| 3/26/2018 | RvS O | 33.55 | 35,865 |
| 4/5/2018 | RvL C | 31.76 | 36,946 |
| 5/9/2018 | RvS O | 38.30 | 45,558 |
| 5/10/2018 | RvL C | 35.46 | 46,591 |
| 8/24/2018 | RvS O | 64.00 | 88,323 |
| 8/30/2018 | RvL C | 60.68 | 92,430 |
| 9/4/2018 | RvS O | 63.06 | 96,549 |
| 9/7/2018 | RvL C | 65.23 | 95,042 |
| 9/26/2018 | RvS O | 73.75 | 105,403 |
| 11/30/2018 | RvL C | 40.75 | 162,376 |
| 12/3/2018 | RvS O | 41.59 | 155,712 |
| 12/26/2018 | RvL C | 30.35 | 198,837 |
| 1/31/2019 | RvS O | 45.02 | 293,400 |
| 2/1/2019 | RvL C | 45.21 | 292,355 |
| 2/4/2019 | RvS O | 48.50 | 313,423 |
| 2/5/2019 | RvL C | 48.16 | 314,768 |
| 5/3/2019 | RvS O | 63.05 | 413,202 |
| 5/7/2019 | RvL C | 64.41 | 401,716 |
| 5/21/2019 | RvS O | 87.79 | 551,041 |
| 6/6/2019 | RvL C | 100.25 | 475,238 |
| 6/7/2019 | RvS O | 102.38 | 482,878 |
| 6/13/2019 | RvL C | 104.97 | 467,793 |
| 8/29/2019 | RvS O | 150.98 | 676,961 |
| 10/1/2019 | RvL C | 102.40 | 881,764 |
| 12/5/2019 | Last | 152.47 | 1,332,301 |
Update 1/9/20
No signals since 10/1/19 for this algorithm.
| Date | Transaction | Buy/Cover | Sell/Short | Asset Value |
| 4-Dec-2019 | Initial Buy | 149.915 | $ 10,000 | |
| 9-Jan-2020 | last | 133.170 | $ 8,883 |