Summary of Signalgorithm trading strategy Oct 2016

Summary of Strategy Performance Oct 2016

This update covers 26 strategies published 2/10/15 through 9/18/15. For the analysis we measure the results of investing $10K in each strategy on the day of publication. 17 of the strategies made a loss over the entire period, however 5 of these were strategies that broke down after showing a profit.

Overall Results vs Hold

Total return on all the strategies as of Oct 2016 ($10K starting capital) was $4600 or 1.8% of capital. This compares with a loss of  $10,740 (-4.1% return) for buy-hold (or a gain of $10,740 for short-hold).

Successful Strategies

9 strategies ended the period with a profit, (BRK,GOOGL,TSLA,TQQQ,DUST,AAPL,PANW,MU,LRN). The combined profit was $36,280 or 40.3% of capital. We will continue to track these strategies.

Partially Successful Strategies

5 strategies (TQQQ,UWTI,NUGT,GILD,MSFT) made at least a 10% profit for a period (typically 100 days) then went on to make a loss over the entire period. Combined opportunity for profit was $28,377 (56%), final loss was $16,766 (33.5%), $10,000 of which was due to UWTI. These strategies will no longer be tracked.

Failed Strategies

There were 12 failed strategies (DIS,GLD,GLD,AAPL,TNA,TNA,FAS,IBM,GOOGL,SPY,WMT,MSFT) losing a combined $14,914 or 12.4%. Losses ranged between $109 through to $3786 for GOOGL. These strategies will no longer be tracked.

Best profits and worst losses

If a single exit for each strategy was timed perfectly, the best case profit for the strategies would have been $92,407 (35.5%). Worst case loss for the strategies was $73,490 (28.3%). Best case gain or loss for buy-hold/short-hold was $115,319--achieving this would have required correctly picking long or short and exiting each at the optimum time.

Strategies vs. 50 day MA crossover strategy

Strategies are sometimes compared with the results of a benchmark SMA crossover algorithm which buys when the price goes above a SMA and sells when the price crosses below an SMA.  We compared the strategies with the performance of SignalSolver algorithm AMC 0% BMC 0% using 50 day, 10 week or 3 month (H+L)/2 averaging. AMC BMC gave a loss of $73,490, compared with a gain of $4600 for the strategies presented here. 16 strategies beat the SMA crossover strategy.

Spreadsheet:

summary-spreadsheet-oct-25-2016

 

IBB Trading Strategy Details and Performance

IBB Trading System (Weekly)

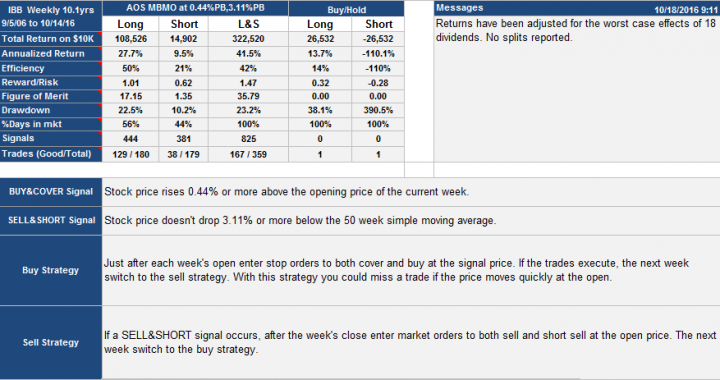
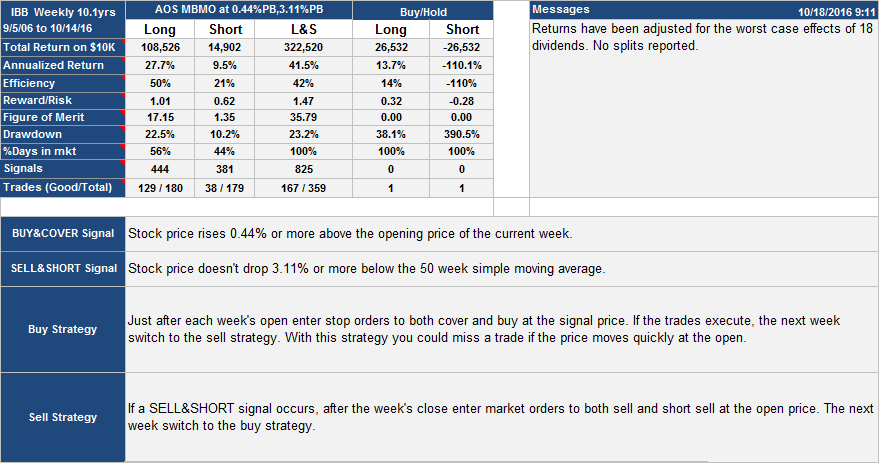
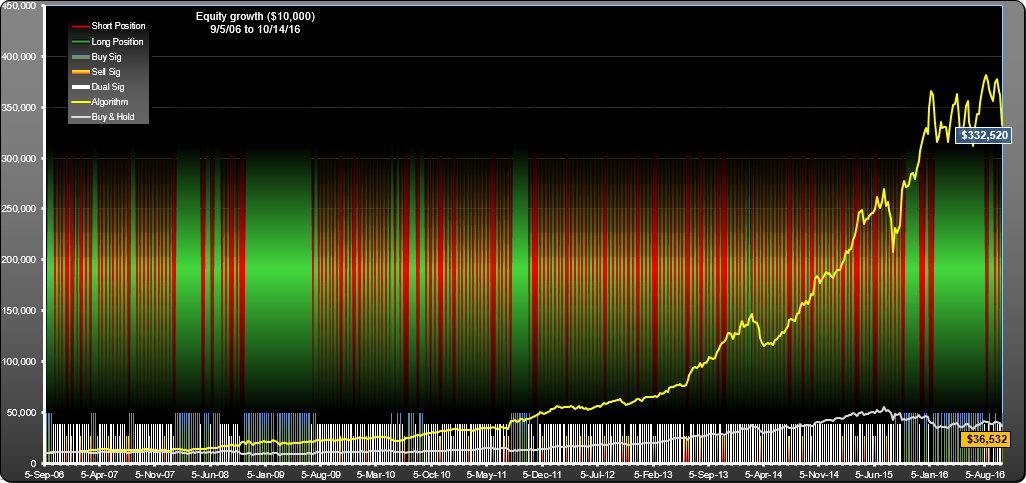
This weekly trading strategy for IBB had 3 times better annualized returns than IBB and more than 10 times better return over the 10.1 years. For each 2.5 year period within the 10 years,  the annualized return was between 30 and 50%.

IBB Trading Strategy Details and Performance

IBB Trading Strategy Details and Performance

IBB Weekly Trading Strategy: Equity Curve

IBB Weekly Trading Strategy: Equity Curve

FEYE Trading System: Performance

FEYE Trading System

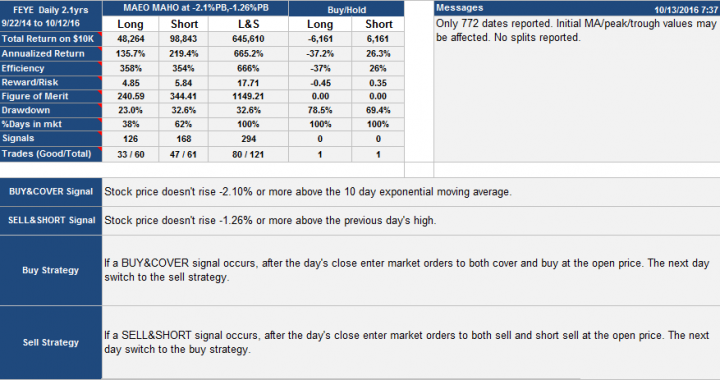
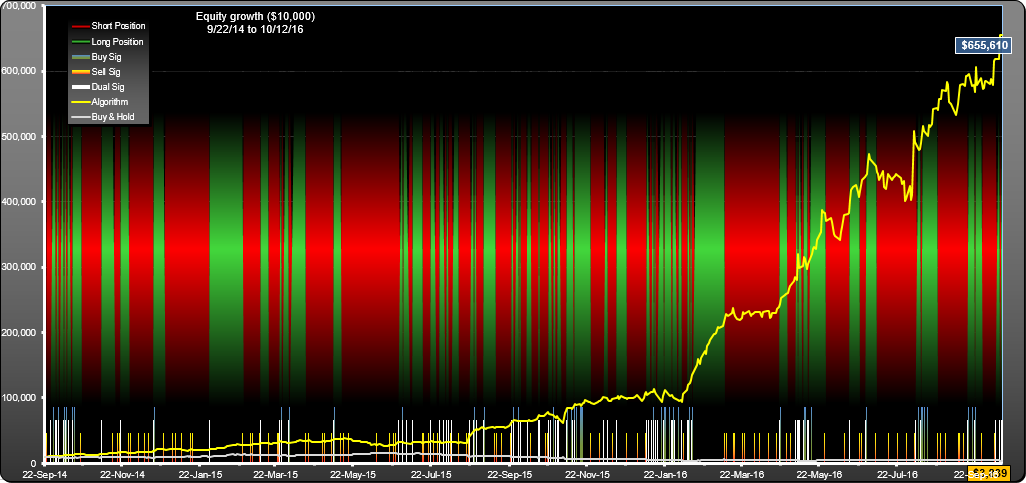
A trading system which worked for FEYE (FireEye). This is based on daily data, so traded at most once per day.

FEYE Trading System: Performance

FEYE Trading System: Performance

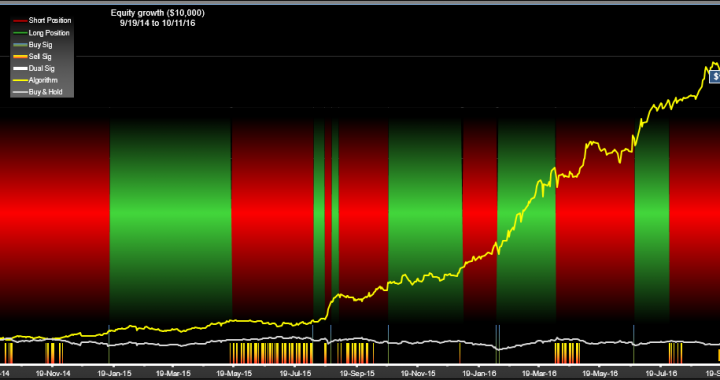
FEYE Trading System: Equity curve, signals and positions

FEYE Trading System: Equity curve, signals and positions

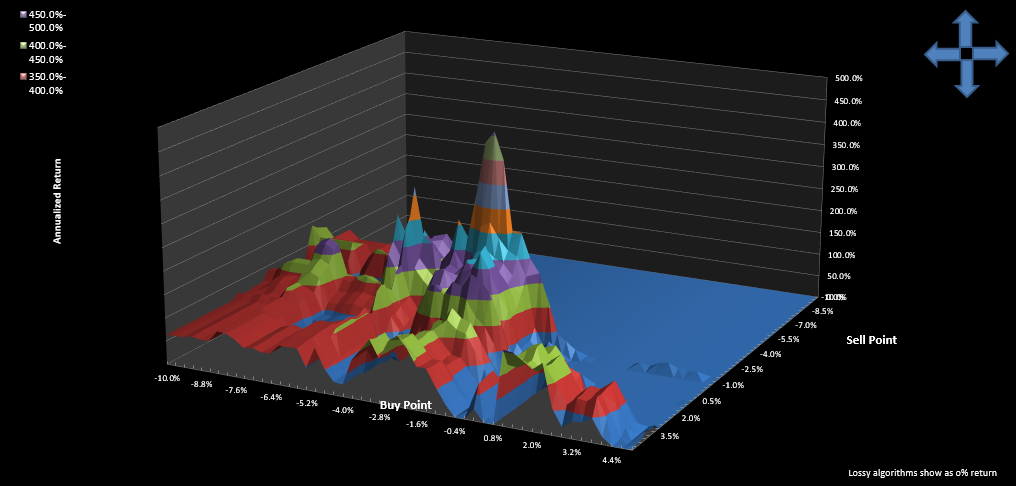
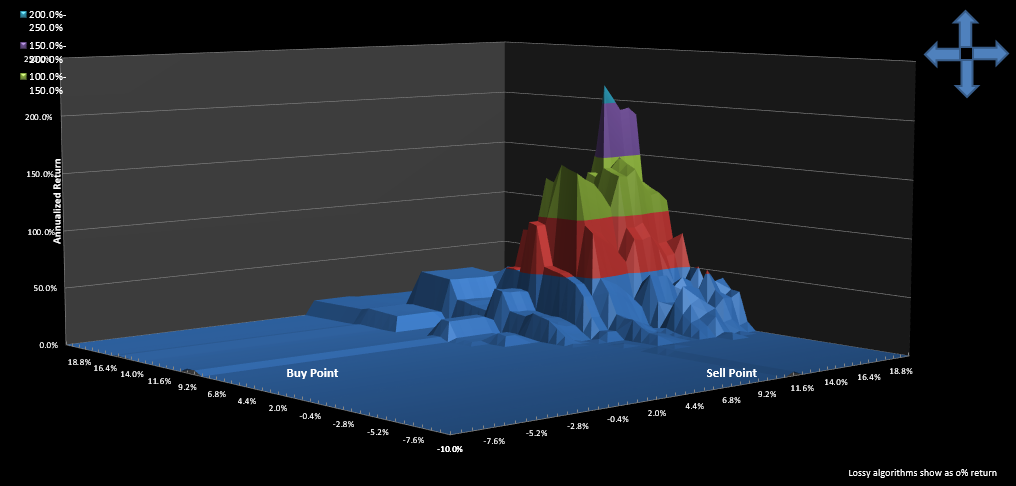
FEYE Trading System: Parameter surface

FEYE Trading System: Parameter surface

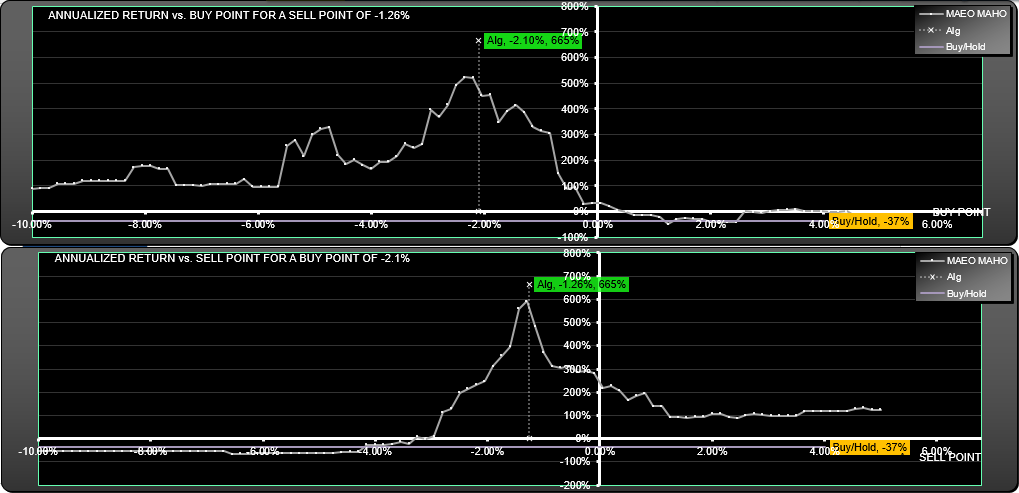
FEYE Trading System: Parameter scan

FEYE Trading System: Parameter scan

FEYE Trading System: Trades List

As always, future performance is not guaranteed.

AMZN 20,000,000% total return

Over 500 times better return than buy-hold

In the time frame May 16th 1997 to Aug 1st 2016, this strategy gave a return of 88.9% compounded which amounts to over $219,000 for every dollar invested, that's 518 times better than the performance of buy-hold which only gave $423.

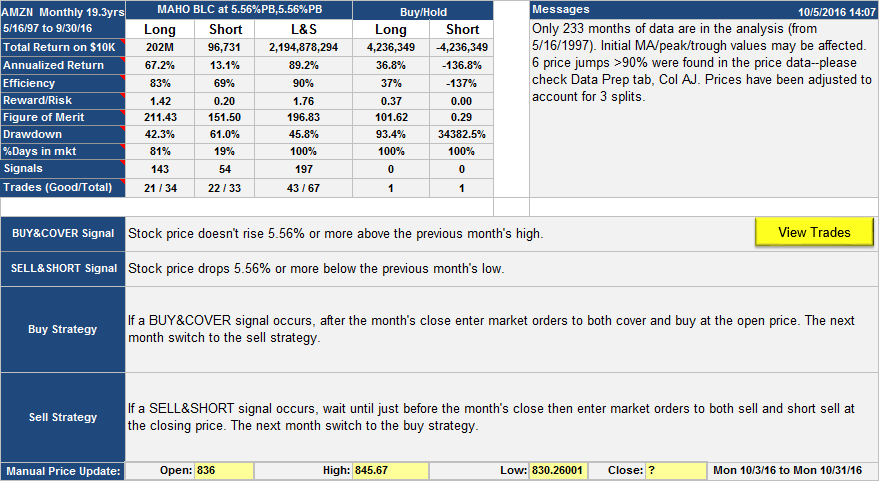
This screenshot shows the strategy description and performance along with messages warning if something looks odd about the data. The data was checked and all the price jumps turn out to be real with the prices agreeing with prices from other sources.

amzn-m-table

The strategy used Long and Short investment style, so was always in the market long or short. The short side trades didn't do nearly as well as the long side trades, but well enough to boost the overall performance by a factor of almost 10. Also, the short trades had an efficiency of 69%, so for the short time that the strategy was short it did quite well.

Trading was at most once per month, trading a total of 67 round trips over the lifetime. 43 of these trades were good

This is a straightforward type of Percentage Band algorithm. Buy signals occurred in months when the stock price failed to rise, at any time, 5.6%  above the high of the previous month. This happened 143 times out of the 243 months of data. The buy was at the following month's open, but it only happened 34 times because the position was already long in most cases.

Sell signals occurred whenever the stock price fell 5.56% below the previous month's low at any time in the month. Usually, there was a buy signal the same month as a sell signal; there were 92 buy signal only months, 3 sell signal only months and 53 dual signal months. For this type of algorithm, if you are long you have to sell if a sell signal occurs, and you have to buy if a buy signal occurs when you are short. This is all explained in this video.

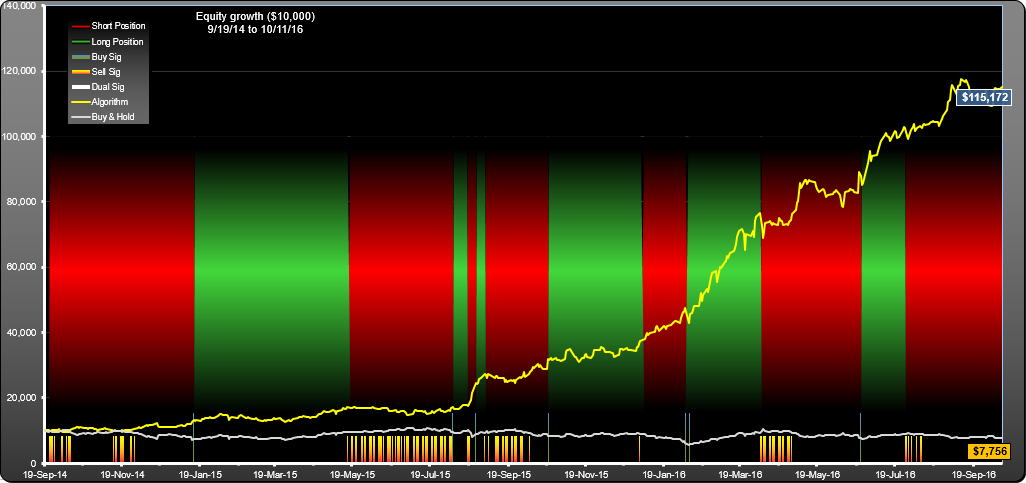
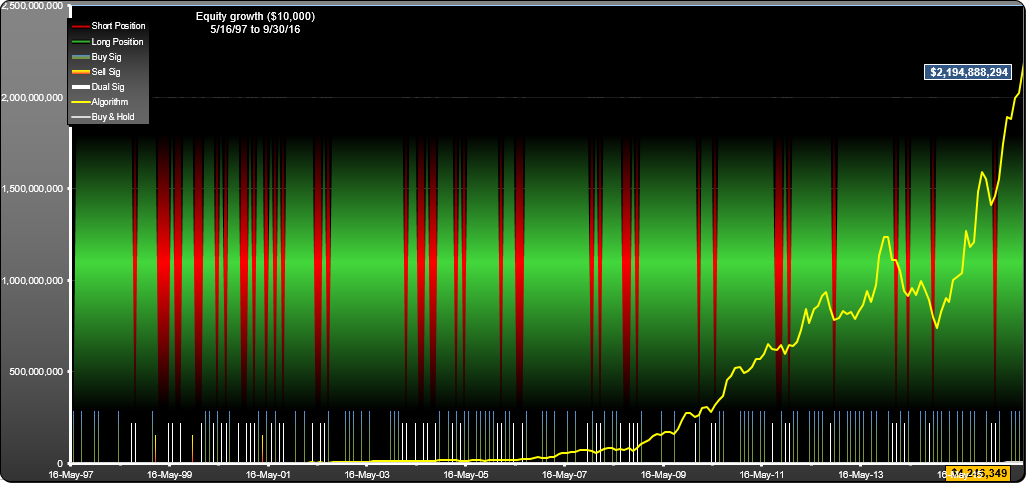
Here is the equity curve for the strategy, along with the signals and positions mapped out.

amzn-m-equity-curve

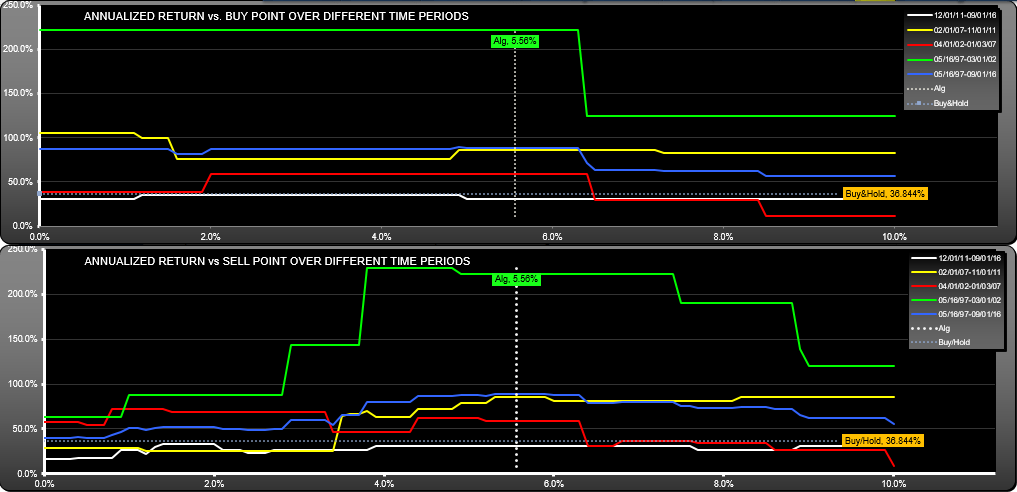
It looks as though the equity curve is still rising rapidly, however a closer look at the returns over different time periods (below) shows that most of the strategy gains occurred in the 1997 to 2002 time period. In fact, in the most recent quartus  (one fourth of the data, 2011 -16) the strategy did not quite keep up with buy/hold (31% vs 35.6% annualized).

amzn-m-longevity-scan

amzn-m-longevity

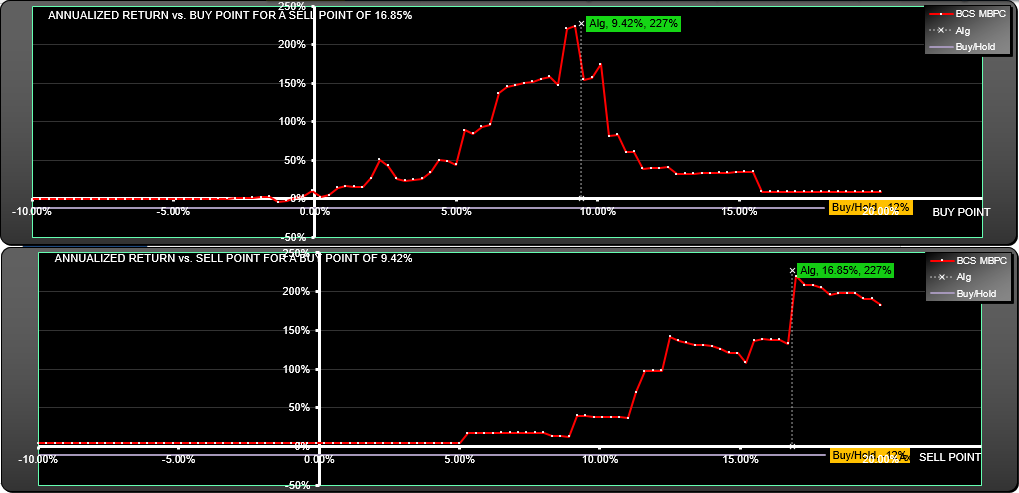
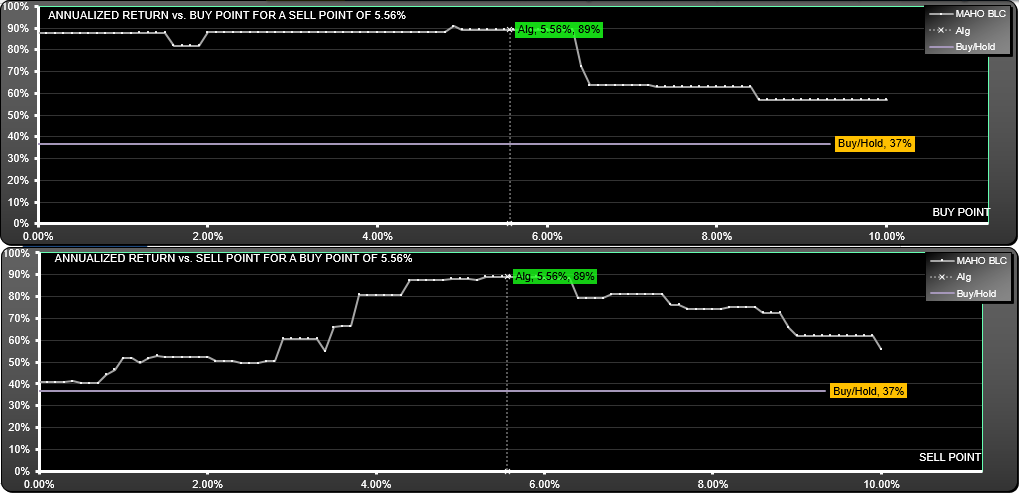
Looking at how changes in the parameters affect return, we see a broad area over which the buy parameters worked with a slightly narrower range for the sell parameter.

amzn-m-return-scan

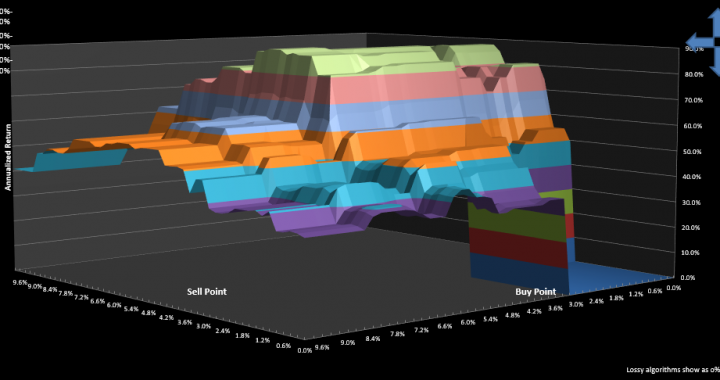
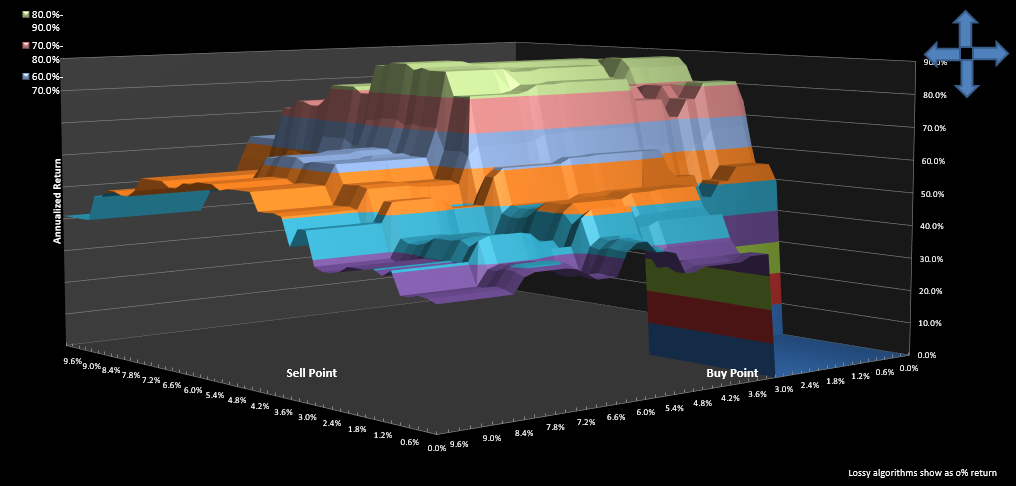
The parameter surface shows a nice large structure, showing that sensitivity to parameter changes was fairly low, but remember most of the gains were focused in the 97-02 timeframe.

amzn-m-return-surface-scan

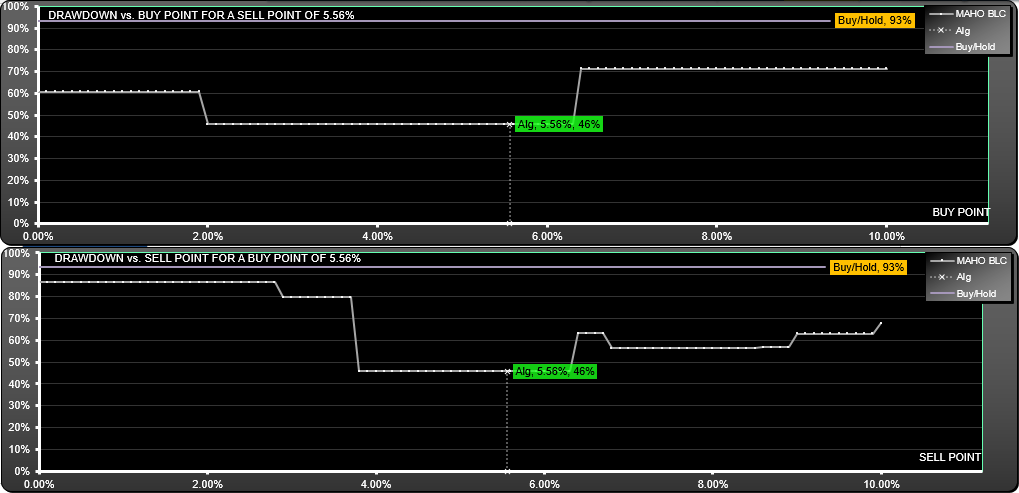
Drawdown for the strategy was much better than for buy-hold (46% vs 93%) and not overly sensitive to parameter change:

amzn-m-drawdown-scan

You can take a look at the buy-sell points on the trades list. As always, please be aware that there is no guarantee that this strategy will work in the future.

Recent performance

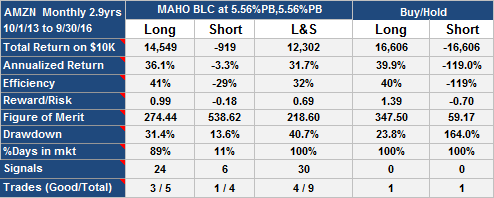
For the most recent 2.9 years, here is the performance table.

amzn-m-recent-table

There are not enough trades to make any firm conclusions about where the optimum parameters are now, but there is evidence to suggest that the buy point has pulled in somewhat. I suggest you download SignalSolver and optimize for different timeframes to get a feel for where the parameters might have moved to.