Gush signals parameter surface

GUSH Signals Weekly (BCS BOS OO)

These Direxion Daily S&P Oil & Gas Ex (GUSH) signals traded as directed would have performed around 27.7 times better than short-hold with an ROI of 2639% for the period 02-Nov-15 to 25-Oct-19

GUSH Signals Performance

GUSH Signals

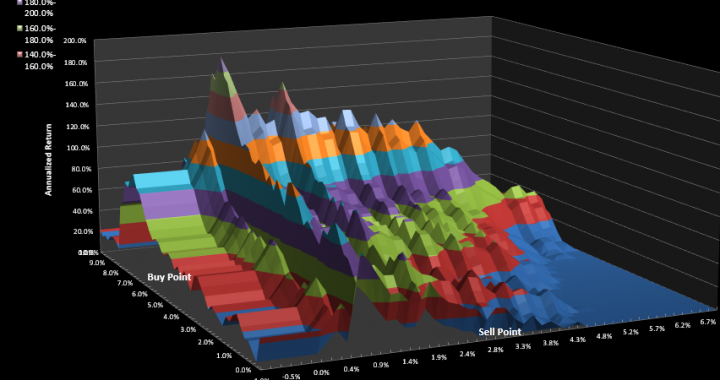
The trading signals for Direxion Daily S&P Oil & Gas Ex (GUSH) were selected for their reward/risk, longevity and parameter sensitivity characteristics. Backtests don't always generate reliable signals which can be counted on moving forward but many traders find value in knowing what buy and sell signals would have worked well in the past.

Returns for the Direxion Daily S&P Oil & Gas Ex (GUSH) signals

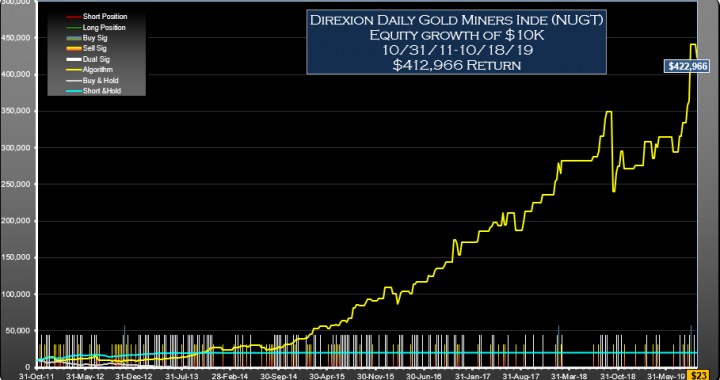
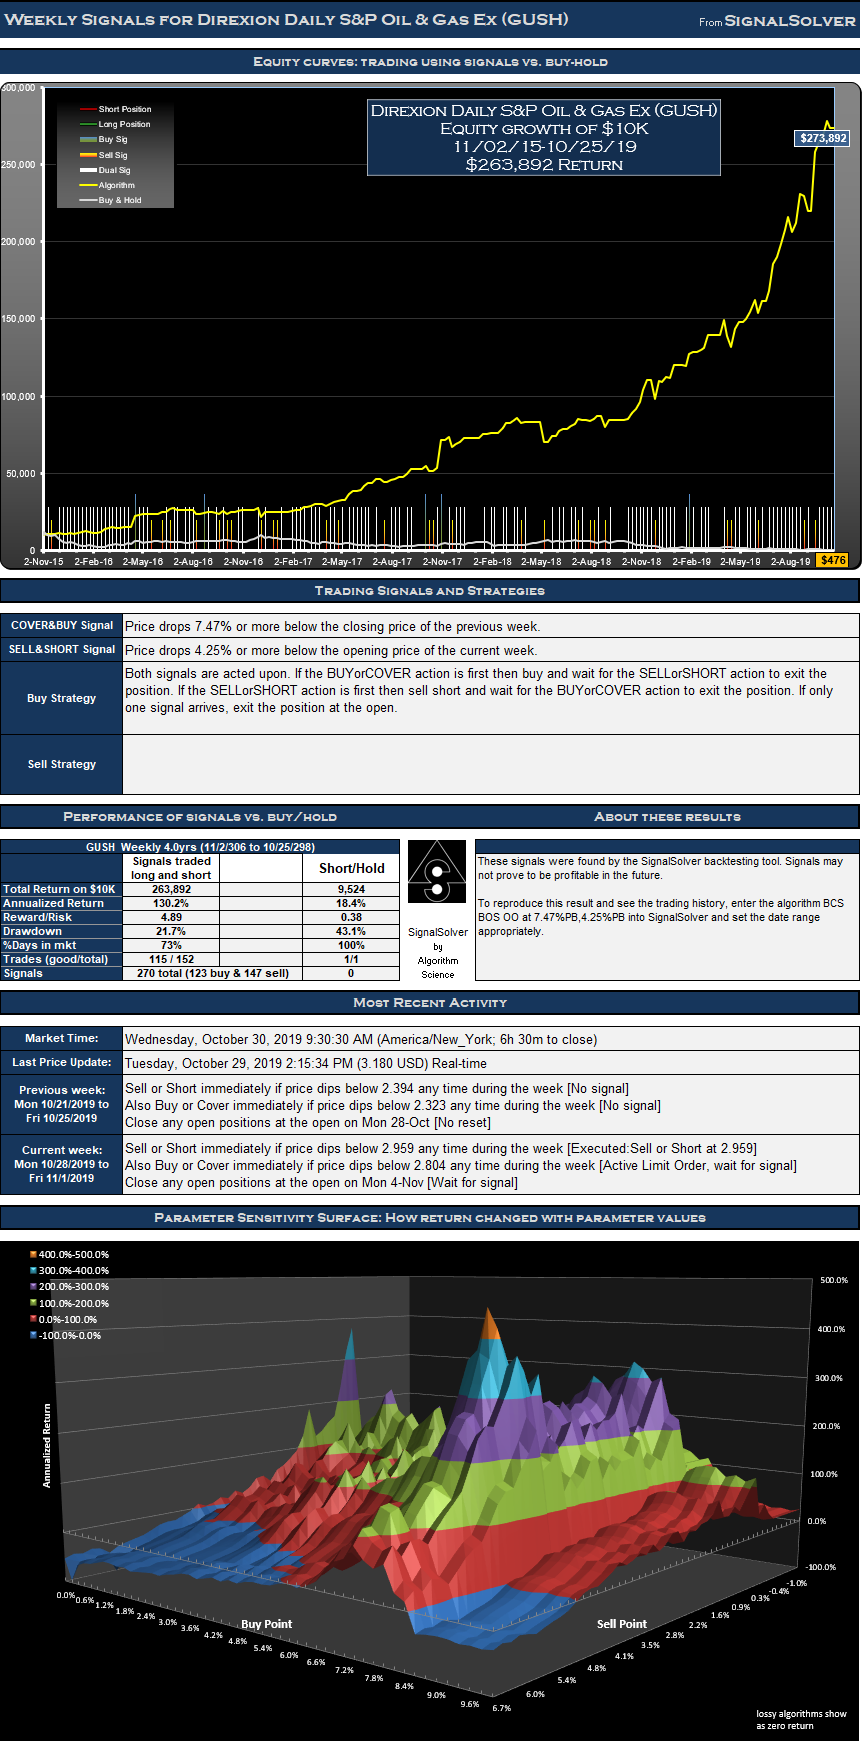
For the 208 week (4.0 year) period from Nov 2 2015 to Oct 25 2019, these signals for Direxion Daily S&P Oil & Gas Ex (GUSH) traded both long and short would have yielded $263,892 in profits from a $10,000 initial investment, an annualized return of 130.2%. 73% of the weeks was spent in the market. The return would have been $9,524 (an annualized return of 18.4%) if you had shorted the stock for the same period.

Signals and Trades

We call this a weekly strategy as weekly OHLC data is used in the numerical analysis leading to at most one buy signal and one sell signal per week. Each week there can be zero, one or two signals and all open positions are closed at the subsequent weekly open.  There were 123 buy signals and 147 sell signals for this particular GUSH strategy which in turn led to 152 trades of which 115 were profitable.

Drawdown and Reward/Risk

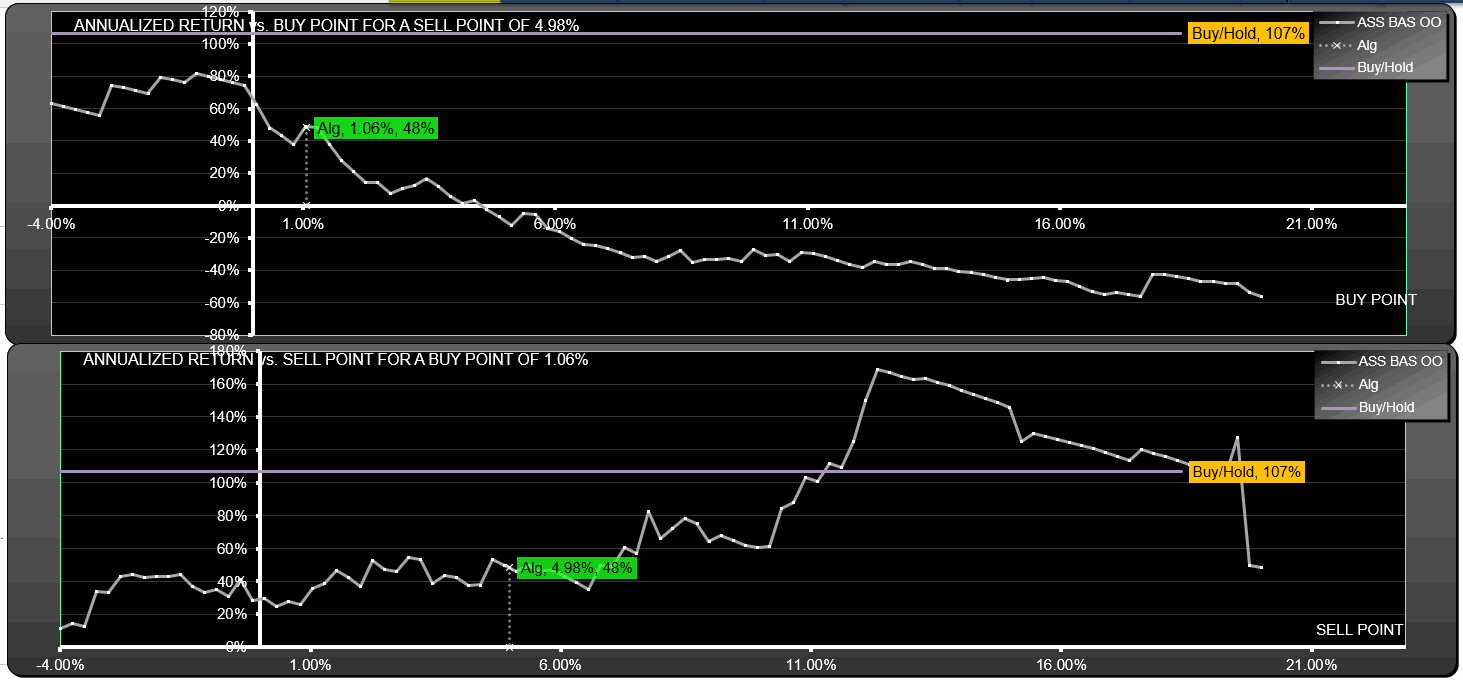
Drawdown (the worst case loss for an single entry and exit into the strategy) was 22%. This compares to 43% for short-hold. The reward/risk for the trading long and short was 4.89 compared to 0.38 for short-hold, a factor of 12.8 improvement.  We use drawdown plus 5% as our risk metric, and annualized return as the reward metric. Note that the strategy was chosen for peak reward/risk rather than peak annualized return (which was 204% for $817,831 return over the period for buy-point 7.47% and sell-point 0.57%).

The backtests assume a commission per trade of $0. Returns have been adjusted for the worst case effects of 6 dividends.

Trade List

Click to see trades

Week of signal Buy or Sell Price L&S Value Next Open
11/9/2015 C/B S 71.80 10,601
11/9/2015 S/Sh S 76.36 10,601
11/16/2015 Sht S 62.52 10,702
11/16/2015 Cov o 61.85 10,702
11/30/2015 C/B S 59.91 11,144
11/30/2015 S/Sh S 62.52 11,144
12/7/2015 C/B S 47.40 10,646
12/7/2015 S/Sh S 45.39 10,646
12/14/2015 C/B S 35.67 10,717
12/14/2015 S/Sh S 35.95 10,717
12/21/2015 C/B S 28.01 10,953
12/21/2015 S/Sh S 28.68 10,953
12/28/2015 C/B S 33.45 10,834
12/28/2015 S/Sh S 33.13 10,834
1/4/2016 C/B S 30.67 11,353
1/4/2016 S/Sh S 32.22 11,353
1/11/2016 C/B S 22.86 11,859
1/11/2016 S/Sh S 23.94 11,859
1/18/2016 C/B S 17.07 12,474
1/18/2016 S/Sh S 18.00 12,474
1/25/2016 C/B S 18.85 11,918
1/25/2016 S/Sh S 18.05 11,918
2/1/2016 C/B S 23.00 11,387
2/1/2016 S/Sh S 22.02 11,387
2/8/2016 C/B S 17.86 11,126
2/8/2016 S/Sh S 17.47 11,126
2/15/2016 C/B S 14.30 12,157
2/15/2016 S/Sh S 15.70 12,157
2/22/2016 C/B S 13.05 13,634
2/22/2016 S/Sh S 14.75 13,634
2/29/2016 C/B S 14.11 14,396
2/29/2016 S/Sh S 14.94 14,396
3/7/2016 C/B S 22.25 15,023
3/7/2016 S/Sh S 23.27 15,023
3/14/2016 C/B S 23.30 14,356
3/14/2016 S/Sh S 22.31 14,356
3/21/2016 C/B S 26.09 14,577
3/21/2016 S/Sh S 26.52 14,577
3/28/2016 C/B S 23.24 15,067
3/28/2016 S/Sh S 24.06 15,067
4/4/2016 C/B S 23.31 15,269
4/4/2016 S/Sh S 23.65 15,269
4/18/2016 Buy S 28.01 22,216
4/18/2016 Sell o 40.78 22,216
4/25/2016 C/B S 37.76 22,951
4/25/2016 S/Sh S 39.05 22,951
5/2/2016 C/B S 38.54 23,358
5/2/2016 S/Sh S 39.26 23,358
5/9/2016 C/B S 31.00 23,331
5/9/2016 S/Sh S 30.98 23,331
5/16/2016 Sht S 35.03 23,384
5/16/2016 Cov o 34.93 23,384
6/6/2016 Sht S 39.92 25,117
6/6/2016 Cov o 36.94 25,117
6/13/2016 C/B S 35.54 24,978
6/13/2016 S/Sh S 35.37 24,978
6/20/2016 Sht S 38.33 27,006
6/20/2016 Cov o 35.20 27,006
6/27/2016 C/B S 33.38 27,249
6/27/2016 S/Sh S 33.70 27,249
7/4/2016 C/B S 35.22 26,266
7/4/2016 S/Sh S 33.99 26,266
7/18/2016 C/B S 32.89 26,374
7/18/2016 S/Sh S 33.04 26,374
7/25/2016 C/B S 30.97 26,360
7/25/2016 S/Sh S 30.97 26,360
8/1/2016 C/B S 30.95 26,350
8/1/2016 S/Sh S 30.95 26,350
8/8/2016 Sht S 35.32 23,254
8/8/2016 Cov o 39.46 23,254
8/22/2016 Buy S 40.26 24,028
8/22/2016 Sell o 41.62 24,028
8/29/2016 C/B S 38.93 24,575
8/29/2016 S/Sh S 39.85 24,575
9/12/2016 C/B S 40.43 24,473
9/12/2016 S/Sh S 40.28 24,473
9/19/2016 Sht S 37.68 23,762
9/19/2016 Cov o 38.75 23,762
9/26/2016 C/B S 34.96 25,164
9/26/2016 S/Sh S 37.10 25,164
10/3/2016 Sht S 43.23 23,562
10/3/2016 Cov o 45.96 23,562
10/10/2016 Sht S 44.01 24,708
10/10/2016 Cov o 41.84 24,708
10/24/2016 C/B S 39.45 25,545
10/24/2016 S/Sh S 40.83 25,545
10/31/2016 C/B S 34.22 25,969
10/31/2016 S/Sh S 34.81 25,969
11/28/2016 C/B S 44.05 27,509
11/28/2016 S/Sh S 46.76 27,509
12/5/2016 Sht S 55.09 21,552
12/5/2016 Cov o 67.00 21,552
12/12/2016 C/B S 54.90 24,906
12/12/2016 S/Sh S 64.15 24,906
12/26/2016 Sht S 52.43 24,670
12/26/2016 Cov o 52.90 24,670
1/3/2017 Sht S 50.65 24,674
1/3/2017 Cov o 50.62 24,674
1/9/2017 C/B S 47.92 24,938
1/9/2017 S/Sh S 48.46 24,938
1/30/2017 C/B S 46.08 25,299
1/30/2017 S/Sh S 46.78 25,299
2/6/2017 C/B S 43.81 25,960
2/6/2017 S/Sh S 44.99 25,960
2/13/2017 C/B S 42.62 26,365
2/13/2017 S/Sh S 43.32 26,365
2/21/2017 C/B S 39.35 28,138
2/21/2017 S/Sh S 42.11 28,138
3/6/2017 C/B S 34.65 29,015
3/6/2017 S/Sh S 35.77 29,015
3/13/2017 C/B S 29.88 29,926
3/13/2017 S/Sh S 30.85 29,926
3/20/2017 C/B S 30.81 30,092
3/20/2017 S/Sh S 31.00 30,092
4/3/2017 Sht S 34.23 28,677
4/3/2017 Cov o 35.83 28,677
4/10/2017 C/B S 32.51 30,206
4/10/2017 S/Sh S 34.30 30,206
4/17/2017 C/B S 30.07 31,512
4/17/2017 S/Sh S 31.41 31,512
4/24/2017 Sht S 29.04 31,950
4/24/2017 Cov o 28.62 31,950
5/1/2017 C/B S 26.69 32,784
5/1/2017 S/Sh S 27.40 32,784
5/15/2017 C/B S 27.04 36,361
5/15/2017 S/Sh S 30.16 36,361
5/22/2017 C/B S 27.46 38,259
5/22/2017 S/Sh S 28.95 38,259
5/30/2017 C/B S 23.92 38,534
5/30/2017 S/Sh S 24.10 38,534
6/5/2017 C/B S 20.52 39,137
6/5/2017 S/Sh S 20.85 39,137
6/12/2017 C/B S 20.77 41,884
6/12/2017 S/Sh S 22.29 41,884
6/19/2017 C/B S 18.92 43,751
6/19/2017 S/Sh S 19.79 43,751
7/3/2017 C/B S 19.27 46,314
7/3/2017 S/Sh S 20.44 46,314
7/17/2017 Sht S 19.56 44,245
7/17/2017 Cov o 20.43 44,245
7/31/2017 C/B S 20.56 45,304
7/31/2017 S/Sh S 21.07 45,304
8/7/2017 C/B S 17.65 45,903
8/7/2017 S/Sh S 17.89 45,903
8/14/2017 C/B S 16.26 47,668
8/14/2017 S/Sh S 16.90 47,668
8/28/2017 C/B S 15.10 49,721
8/28/2017 S/Sh S 15.77 49,721
9/5/2017 C/B S 16.40 52,711
9/5/2017 S/Sh S 17.42 52,711
10/2/2017 Buy S 22.50 54,633
10/2/2017 Sell o 23.33 54,633
10/9/2017 Sht S 22.34 51,486
10/9/2017 Cov o 23.62 51,486
10/16/2017 Sht S 22.62 51,463
10/16/2017 Cov o 22.62 51,463
10/23/2017 C/B S 20.87 53,346
10/23/2017 S/Sh S 21.66 53,346
10/30/2017 Buy S 20.22 71,402
10/30/2017 Sell o 27.07 71,402
11/13/2017 C/B S 27.02 73,708
11/13/2017 S/Sh S 27.91 73,708
11/20/2017 Sht S 23.87 67,274
11/20/2017 Cov o 25.95 67,274
11/27/2017 C/B S 24.30 68,762
11/27/2017 S/Sh S 24.85 68,762
12/4/2017 C/B S 26.53 70,280
12/4/2017 S/Sh S 27.13 70,280
12/11/2017 C/B S 23.91 72,833
12/11/2017 S/Sh S 24.80 72,833
1/16/2018 C/B S 33.83 75,669
1/16/2018 S/Sh S 35.18 75,669
1/29/2018 C/B S 31.86 76,171
1/29/2018 S/Sh S 32.08 76,171
2/5/2018 C/B S 23.76 76,168
2/5/2018 S/Sh S 23.77 76,168
2/20/2018 C/B S 20.26 79,142
2/20/2018 S/Sh S 21.07 79,142
2/26/2018 C/B S 21.46 82,380
2/26/2018 S/Sh S 22.36 82,380
3/12/2018 C/B S 21.49 83,969
3/12/2018 S/Sh S 21.91 83,969
3/19/2018 C/B S 20.90 85,478
3/19/2018 S/Sh S 21.29 85,478
3/26/2018 Sht S 22.54 82,732
3/26/2018 Cov o 23.26 82,732
4/2/2018 C/B S 22.06 83,511
4/2/2018 S/Sh S 22.27 83,511
5/7/2018 Sht S 32.56 70,069
5/7/2018 Cov o 37.79 70,069
5/21/2018 C/B S 39.30 73,971
5/21/2018 S/Sh S 41.56 73,971
6/4/2018 C/B S 36.06 77,413
6/4/2018 S/Sh S 37.78 77,413
6/11/2018 C/B S 35.56 78,603
6/11/2018 S/Sh S 36.12 78,603
6/25/2018 C/B S 36.64 80,840
6/25/2018 S/Sh S 37.71 80,840
7/2/2018 C/B S 37.58 81,576
7/2/2018 S/Sh S 37.93 81,576
7/9/2018 Sht S 40.75 85,308
7/9/2018 Cov o 38.88 85,308
7/16/2018 C/B S 37.63 84,372
7/16/2018 S/Sh S 37.23 84,372
7/30/2018 Sht S 37.66 83,996
7/30/2018 Cov o 37.82 83,996
8/6/2018 Sht S 36.21 84,939
8/6/2018 Cov o 35.80 84,939
8/13/2018 C/B S 33.54 86,770
8/13/2018 S/Sh S 34.28 86,770
8/27/2018 Sht S 35.43 80,211
8/27/2018 Cov o 38.10 80,211
9/4/2018 C/B S 34.59 84,473
9/4/2018 S/Sh S 36.48 84,473
10/8/2018 C/B S 37.35 85,100
10/8/2018 S/Sh S 37.63 85,100
10/15/2018 C/B S 31.03 89,032
10/15/2018 S/Sh S 32.51 89,032
10/22/2018 C/B S 28.36 91,773
10/22/2018 S/Sh S 29.25 91,773
10/29/2018 C/B S 20.10 96,242
10/29/2018 S/Sh S 21.10 96,242
11/5/2018 C/B S 20.31 104,025
11/5/2018 S/Sh S 22.02 104,025
11/12/2018 C/B S 20.59 110,660
11/12/2018 S/Sh S 21.95 110,660
11/19/2018 C/B S 17.72 110,730
11/19/2018 S/Sh S 17.73 110,730
11/26/2018 Sht S 15.40 97,890
11/26/2018 Cov o 17.18 97,890
12/3/2018 C/B S 14.60 109,573
12/3/2018 S/Sh S 16.45 109,573
12/10/2018 C/B S 12.86 109,047
12/10/2018 S/Sh S 12.80 109,047
12/17/2018 C/B S 9.93 112,152
12/17/2018 S/Sh S 10.22 112,152
12/24/2018 C/B S 6.53 111,767
12/24/2018 S/Sh S 6.51 111,767
12/31/2018 C/B S 7.09 119,876
12/31/2018 S/Sh S 7.62 119,876
1/22/2019 C/B S 11.92 119,314
1/22/2019 S/Sh S 11.86 119,314
1/28/2019 Buy S 10.68 127,255
1/28/2019 Sell o 11.39 127,255
2/4/2019 C/B S 10.78 128,722
2/4/2019 S/Sh S 10.91 128,722
2/19/2019 C/B S 10.94 130,137
2/19/2019 S/Sh S 11.06 130,137
2/25/2019 C/B S 10.49 131,439
2/25/2019 S/Sh S 10.60 131,439
3/4/2019 C/B S 10.22 139,678
3/4/2019 S/Sh S 10.89 139,678
4/1/2019 C/B S 10.28 149,268
4/1/2019 S/Sh S 11.01 149,268
4/8/2019 Sht S 11.86 138,980
4/8/2019 Cov o 12.68 138,980
4/15/2019 Sht S 12.14 131,997
4/15/2019 Cov o 12.75 131,997
4/22/2019 C/B S 11.20 143,418
4/22/2019 S/Sh S 12.21 143,418
4/29/2019 C/B S 10.59 148,186
4/29/2019 S/Sh S 10.95 148,186
5/13/2019 C/B S 9.01 150,011
5/13/2019 S/Sh S 9.12 150,011
5/20/2019 C/B S 8.66 154,325
5/20/2019 S/Sh S 8.91 154,325
5/28/2019 C/B S 6.60 162,169
5/28/2019 S/Sh S 6.94 162,169
6/3/2019 Sht S 5.89 153,856
6/3/2019 Cov o 6.19 153,856
6/10/2019 C/B S 5.64 161,361
6/10/2019 S/Sh S 5.93 161,361
6/24/2019 C/B S 6.16 168,075
6/24/2019 S/Sh S 6.42 168,075
7/1/2019 C/B S 6.51 185,821
7/1/2019 S/Sh S 7.24 185,821
7/8/2019 C/B S 5.94 190,126
7/8/2019 S/Sh S 6.08 190,126
7/15/2019 C/B S 6.02 198,941
7/15/2019 S/Sh S 6.31 198,941
7/22/2019 C/B S 4.79 208,026
7/22/2019 S/Sh S 5.02 208,026
7/29/2019 C/B S 4.44 215,995
7/29/2019 S/Sh S 4.62 215,995
8/5/2019 C/B S 3.83 206,598
8/5/2019 S/Sh S 3.67 206,598
8/12/2019 C/B S 3.35 212,507
8/12/2019 S/Sh S 3.45 212,507
8/19/2019 C/B S 2.96 230,784
8/19/2019 S/Sh S 3.23 230,784
8/26/2019 Sht S 2.90 230,072
8/26/2019 Cov o 2.91 230,072
9/3/2019 C/B S 2.91 220,063
9/3/2019 S/Sh S 2.79 220,063
9/16/2019 Sht S 4.79 258,085
9/16/2019 Cov o 3.96 258,085
9/23/2019 C/B S 3.69 264,952
9/23/2019 S/Sh S 3.79 264,952
9/30/2019 C/B S 3.12 268,440
9/30/2019 S/Sh S 3.16 268,440
10/7/2019 C/B S 2.61 278,561
10/7/2019 S/Sh S 2.71 278,561
10/14/2019 C/B S 2.61 273,892
10/14/2019 S/Sh S 2.57 273,892
10/28/2019 C/B S 2.80 273,892
10/28/2019 S/Sh S 2.96 273,892

Update 1/9/20

This algorithm not doing well, especially when compared to the underlying stock which has increased 20% or more.


Date Trade Buy/Cov Sell/Sht  Asset Value
27-Oct-2019  $           10,000
28-Oct-2019 Short 29.590  $             9,861
29-Oct-2019 Cover 28.040  $           10,524
6-Nov-2019 Short 30.540  $             9,642
11-Nov-2019 Cover 31.700  $           10,124
12-Nov-2019 Buy 31.090  $           10,124
12-Nov-2019 Sell 30.350  $             9,883
18-Nov-2019 Short 28.050  $             9,883
18-Nov-2019 Cover 27.570  $           10,052
18-Nov-2019 Short 28.055  $           10,052
18-Nov-2019 Cover 27.574  $           10,225
26-Nov-2019 Short 24.569  $           10,225
26-Nov-2019 Cover 24.030  $           10,449
3-Dec-2019 Short 22.980  $           10,449
9-Dec-2019 Cover 25.540  $             9,285
31-Dec-2019 Short 34.403  $             9,285
6-Jan-2020 Cover 39.180  $             7,996
8-Jan-2020 Short 37.515  $             7,996
8-Jan-2020 Cover 35.013  $             8,529

NUGT Signals Weekly (BYS BAS OO)

These Direxion Daily Gold Miners Inde (NUGT) signals traded as directed would have performed only around 0.7 times as well as buy-hold with an ROI of 56% for the period 22-Oct-18 to 18-Oct-19. However the reward/risk was twice as good as buy-hold because drawdown was only 8% compared with 34% for buy-hold. Furthermore the capital was in the market for about a third of the time of buy-hold so efficiency (=return/%time in mkt) was around 159% for the year, meaning that return would have been 159% if the capital could have been invested for the whole period at the same rate.

The trading signals for Direxion Daily Gold Miners Inde (NUGT) were selected for their reward/risk, longevity and parameter sensitivity characteristics. Backtests don't always generate reliable signals which can be counted on moving forward but many traders find value in knowing what buy and sell signals would have worked well in the past.

Returns for the Direxion Daily Gold Miners Inde (NUGT) signals

For the 52 week (1.0 year) period from Oct 22 2018 to Oct 18 2019, these signals for Direxion Daily Gold Miners Inde (NUGT) traded both long and short would have yielded $5,649 in profits from a $10,000 initial investment, an annualized return of 58.1%. Traded long only (no short selling)  the signals would have returned $4,169, an annualized return of 42.8%. 10.6% of time was spent holding stock long. The return would have been $8,360 (an annualized return of 86.1%)  if you had bought and held the stock for the same period.

Signals and Trades

We call this a weekly strategy as weekly OHLC data is used in the numerical analysis leading to at most one buy signal and one sell signal per week. The strategy detailed has cover/buy and sell/short signals, which often result in a buy and sell each week or short and cover, but any open positions must be closed out at the following open. For the 52 week period here, positions were only held for 37% of the weeks, leaving capital free to be used for other purposes for the remainder.

Drawdown and Reward/Risk

Drawdown (the worst case loss for an single entry and exit into the strategy) was 8%. This compares to 35% for buy-hold. The reward/risk for the trading long and short was 4.42 compared to 2.17 for buy-hold, a factor of  2.0 improvement. We use drawdown plus 5% as our risk metric, and annualized return as the reward metric.

The backtests assume a commission per trade of $7. Returns have been adjusted for the worst case effects of 3 dividends.

Trade List

Click to see trades

Week of signal Buy or Sell Price L&S Value Next Open
10/29/2018 Buy 13.08 10,353
10/29/2018 Sell 13.57 10,353
11/12/2018 Buy 11.80 11,122
11/12/2018 Sell 12.73 11,122
11/26/2018 Buy 13.91 10,215
11/26/2018 Sell 12.88 10,215
1/14/2019 Buy 15.55 10,388
1/14/2019 Sell 15.84 10,388
2/25/2019 Buy 18.10 11,559
2/25/2019 Sell 20.43 11,559
3/4/2019 Buy 18.10 11,545
3/4/2019 Sell 18.10 11,545
4/1/2019 Buy 20.52 10,688
4/1/2019 Sell 19.12 10,688
4/15/2019 Buy 16.90 11,429
4/15/2019 Sell 18.14 11,429
4/22/2019 Buy 16.51 11,248
4/22/2019 Sell 16.27 11,248
4/29/2019 Buy 14.06 11,761
4/29/2019 Sell 14.74 11,761
7/1/2019 Buy 26.74 10,984
7/1/2019 Sell 25.11 10,984
7/29/2019 Buy 29.17 11,748
7/29/2019 Sell 31.31 11,748
8/12/2019 Buy 33.02 12,450
8/12/2019 Sell 35.16 12,450
8/19/2019 Buy 33.02 12,436
8/19/2019 Sell 33.02 12,436
9/3/2019 Buy 35.30 13,284
9/3/2019 Sell 37.93 13,284
9/9/2019 Buy 34.80 13,459
9/9/2019 Sell 35.30 13,459
9/16/2019 Buy 29.08 16,347
9/16/2019 Sell 35.35 16,347
9/30/2019 Buy 28.60 16,333
9/30/2019 Sell 28.60 16,333
10/14/2019 Buy 29.00 15,649
10/14/2019 Sell 27.86 15,649

8 year performance

For completeness, below is the 8 year performance for the same algorithm. This would have averaged 60% annualized return a year which translates to $412,966 for a $10,000 outlay. Short-hold would have returned $9,977 (9.1% annualized return) over the period with a drawdown of 17.9% and efficiency 122% (weeks in mkt=49%).


Update Jan 9th 2020

Algorithm didn't trade in Dec 2019, but yesterday shorted at 31.98. Performance is pretty flat right now for the algorithm and the underlying.

Trades since inception as of 1/9/20

Date Type Buy/Cov Sell/Sht  Asset Value
23-Oct-2019  $           10,000
7-Nov-2019 Short 26.743  $           10,278
11-Nov-2019 Cover 25.560  $           10,442
11-Nov-2019 Short 25.501  $           10,442
11-Nov-2019 Cover 25.329  $           10,513
25-Nov-2019 Short 25.183  $           10,513
27-Nov-2019 Cover 27.130  $             9,700
8-Jan-2020 Short 31.980  $             9,700
9-Jan-2020 Last 31.380  $             9,882

TQQQ Signals Weekly (ASS BAS OO)

Author's Note Dec 4th 2021

We tracked this algorithm from Oct 2019 through to Dec 2021. The optimum time to exit the algorithm would have been in April 2020 when the equity was about 3 times the underlying stock. But algorithms don't typically perform forever. We keep the original posts as an illustration of the value of SignalSolver in finding useful trading algorithms but do not advise trading this algorithm at the present time as the optimum parameters have changed.

Original Post Oct 2019:

These ProShares UltraPro QQQ (TQQQ) signals traded as directed would have performed around 2.8 times better than buy-hold with an ROI of 549% for the period 24-Oct-16 to 18-Oct-19 with relatively low drawdown.

The algorithm is a little unusual, the buy point is usually above the sell point, which means that they act as defensive stops for each other, however hitting both buy and sell point in the same week only happened 20 times in the last 3 years and generally the position has been closed out at the following week open, at a profit.

"The trading signals for ProShares UltraPro QQQ (TQQQ) were selected for their reward/risk, longevity and parameter sensitivity characteristics. Backtests don't always generate reliable signals which can be counted on moving forward but many traders find value in knowing what buy and sell signals would have worked well in the past.

Returns for the ProShares UltraPro QQQ (TQQQ) signals

For the 156 week (3.0 year) period from Oct 24 2016 to Oct 18 2019, these signals for ProShares UltraPro QQQ (TQQQ) traded both long and short would have yielded $54,918 in profits from a $10,000 initial investment, an annualized return of 87.6%. Traded long only (no short selling) the signals would have returned $46,325, an annualized return of 78.9%. 67.9% of time was spent holding stock long. The return would have been $19,792 (an annualized return of 44.4%) if you had bought and held the stock for the same period.

Signals and Trades

We call this a weekly strategy as weekly OHLC data is used in the numerical analysis leading to at most one buy signal and one sell signal per week. For this algorithm, all open positions must be exited at the start of the week. There were 116 buy signals and 47 sell signals for this particular TQQQ strategy which in turn led to 96 round trip long trades of which 72 were profitable, and 27 short trades of which 19 were profitable.

Drawdown and Reward/Risk

Drawdown (the worst case loss for an single entry and exit into the strategy) was 17% for long-short and 9% for long only. This compares to 56% for buy-hold. The reward/risk for the trading long and short was 4.02 compared to 0.73 for buy-hold, a factor of 5.5 improvement. If traded long only, the reward/risk was 5.56. We use drawdown plus 5% as our risk metric, and annualized return as the reward metric.

The backtests assume a commission per trade of $7. Returns have been adjusted for the worst case effects of 2 dividends. "

Trade List

Click to see trades

Week of signal Buy or Sell Price Long Value Next Open Short Value Next Open L&S Value Next Open
10/31/2016 Buy 19.63 10,000 10,203 10,203
10/31/2016 Sell 20.07 10,000 10,203 10,203
11/7/2016 Buy 20.28 9,740 10,203 9,938
11/7/2016 Sell 19.78 9,740 10,203 9,938
11/14/2016 Buy 19.99 9,496 9,935 9,428
11/14/2016 Sell 19.02 9,496 9,935 9,428
11/21/2016 Buy 20.65 9,724 9,935 9,655
11/21/2016 Sell 21.18 9,724 9,935 9,655
11/28/2016 Buy 21.40 9,404 9,586 8,997
11/28/2016 Sell 20.02 9,404 9,586 8,997
12/5/2016 Buy 20.23 9,878 9,586 9,450
12/5/2016 Sell 21.29 9,878 9,586 9,450
12/12/2016 Buy 21.51 10,046 9,586 9,610
12/12/2016 Sell 21.91 10,046 9,586 9,610
12/19/2016 Buy 22.14 10,089 9,586 9,651
12/19/2016 Sell 22.27 10,089 9,586 9,651
12/26/2016 Buy 22.50 9,756 9,247 8,990
12/26/2016 Sell 21.04 9,756 9,247 8,990
1/3/2017 Buy 21.60 10,421 9,247 9,602
1/3/2017 Sell 23.11 10,421 9,247 9,602
1/9/2017 Buy 23.35 10,488 9,247 9,662
1/9/2017 Sell 23.53 10,488 9,247 9,662
1/17/2017 Buy 23.78 10,437 9,247 9,615
1/17/2017 Sell 23.70 10,437 9,247 9,615
1/23/2017 Buy 23.95 10,876 9,247 10,017
1/23/2017 Sell 24.99 10,876 9,247 10,017
2/6/2017 Buy 25.25 11,369 9,247 10,471
2/6/2017 Sell 26.43 11,369 9,247 10,471
2/13/2017 Buy 26.71 11,848 9,247 10,911
2/13/2017 Sell 27.87 11,848 9,247 10,911
2/21/2017 Buy 28.17 11,689 9,247 10,763
2/21/2017 Sell 27.82 11,689 9,247 10,763
2/27/2017 Buy 28.12 11,676 9,247 10,750
2/27/2017 Sell 28.12 11,676 9,247 10,750
3/6/2017 Buy 28.42 11,738 9,247 10,806
3/6/2017 Sell 28.60 11,738 9,247 10,806
3/13/2017 Buy 28.91 11,760 9,247 10,825
3/13/2017 Sell 29.00 11,760 9,247 10,825
3/20/2017 Buy 29.30 11,096 9,247 10,213
3/20/2017 Sell 27.68 11,096 9,247 10,213
3/27/2017 Buy 27.98 11,682 9,247 10,751
3/27/2017 Sell 29.49 11,682 9,247 10,751
4/3/2017 Buy 29.80 11,442 9,247 10,530
4/3/2017 Sell 29.23 11,442 9,247 10,530
4/17/2017 Buy 29.54 11,769 9,247 10,829
4/17/2017 Sell 30.42 11,769 9,247 10,829
4/24/2017 Buy 30.74 12,264 9,247 11,284
4/24/2017 Sell 32.07 12,264 9,247 11,284
5/1/2017 Buy 32.41 12,429 9,247 11,434
5/1/2017 Sell 32.88 12,429 9,247 11,434
5/8/2017 Buy 33.23 12,559 9,247 11,553
5/8/2017 Sell 33.62 12,559 9,247 11,553
5/15/2017 Buy 33.97 12,242 9,247 11,260
5/15/2017 Sell 33.15 12,242 9,247 11,260
5/22/2017 Buy 33.50 12,882 9,247 11,847
5/22/2017 Sell 35.29 12,882 9,247 11,847
5/30/2017 Buy 35.67 13,358 9,247 12,284
5/30/2017 Sell 37.03 13,358 9,247 12,284
6/5/2017 Buy 33.47 13,358 9,427 12,528
6/5/2017 Sell 34.19 13,358 9,427 12,528
6/12/2017 Buy 34.55 13,126 9,255 12,084
6/12/2017 Sell 33.38 13,126 9,255 12,084
6/19/2017 Buy 34.19 13,810 9,255 12,713
6/19/2017 Sell 36.01 13,810 9,255 12,713
6/26/2017 Buy 33.13 13,810 9,223 12,674
6/26/2017 Sell 33.07 13,810 9,223 12,674
7/3/2017 Buy 32.78 13,810 9,058 12,453
7/3/2017 Sell 32.25 13,810 9,058 12,453
7/10/2017 Buy 32.78 15,144 9,058 13,654
7/10/2017 Sell 35.98 15,144 9,058 13,654
7/17/2017 Buy 36.36 15,537 9,058 14,007
7/17/2017 Sell 37.34 15,537 9,058 14,007
7/24/2017 Buy 37.74 15,396 9,058 13,878
7/24/2017 Sell 37.43 15,396 9,058 13,878
8/7/2017 Buy 37.83 14,823 8,692 12,803
8/7/2017 Sell 35.04 14,823 8,692 12,803
8/14/2017 Buy 36.48 14,460 8,466 12,159
8/14/2017 Sell 34.73 14,460 8,466 12,159
8/21/2017 Buy 35.10 14,301 8,368 11,886
8/21/2017 Sell 34.36 14,301 8,368 11,886
8/28/2017 Buy 35.73 15,232 8,368 12,658
8/28/2017 Sell 38.10 15,232 8,368 12,658
9/11/2017 Buy 38.50 15,232 8,368 12,655
9/11/2017 Sell 38.54 15,232 8,368 12,655
9/25/2017 Buy 38.28 15,232 7,830 11,850
9/25/2017 Sell 36.03 15,232 7,830 11,850
10/2/2017 Buy 38.28 15,889 7,830 12,358
10/2/2017 Sell 39.97 15,889 7,830 12,358
10/9/2017 Buy 40.39 15,976 7,830 12,422
10/9/2017 Sell 40.65 15,976 7,830 12,422
10/23/2017 Buy 41.08 16,497 7,830 12,824
10/23/2017 Sell 42.45 16,497 7,830 12,824
10/30/2017 Buy 42.90 16,967 7,830 13,186
10/30/2017 Sell 44.16 16,967 7,830 13,186
11/6/2017 Buy 44.63 16,756 7,830 13,019
11/6/2017 Sell 44.11 16,756 7,830 13,019
11/13/2017 Buy 44.58 16,829 7,830 13,073
11/13/2017 Sell 44.81 16,829 7,830 13,073
11/20/2017 Buy 45.29 17,334 7,830 13,461
11/20/2017 Sell 46.68 17,334 7,830 13,461
11/27/2017 Buy 45.97 17,334 7,342 12,632
11/27/2017 Sell 43.34 17,334 7,342 12,632
12/4/2017 Buy 45.97 17,055 7,342 12,424
12/4/2017 Sell 45.27 17,055 7,342 12,424
12/11/2017 Buy 45.75 18,129 7,342 13,203
12/11/2017 Sell 48.67 18,129 7,342 13,203
1/2/2018 Buy 49.19 19,094 7,342 13,902
1/2/2018 Sell 51.84 19,094 7,342 13,902
1/8/2018 Buy 52.39 20,161 7,342 14,675
1/8/2018 Sell 55.36 20,161 7,342 14,675
1/16/2018 Buy 55.95 20,163 7,342 14,673
1/16/2018 Sell 55.99 20,163 7,342 14,673
1/22/2018 Buy 56.59 21,473 7,342 15,622
1/22/2018 Sell 60.30 21,473 7,342 15,622
1/29/2018 Buy 52.58 21,473 7,695 16,390
1/29/2018 Sell 55.36 21,473 7,695 16,390
2/5/2018 Buy 46.93 21,473 8,508 18,139
2/5/2018 Sell 52.58 21,473 8,508 18,139
2/12/2018 Buy 53.14 21,324 8,508 18,011
2/12/2018 Sell 52.81 21,324 8,508 18,011
2/20/2018 Buy 53.37 22,870 8,508 19,314
2/20/2018 Sell 57.27 22,870 8,508 19,314
2/26/2018 Buy 57.88 21,676 8,009 17,180
2/26/2018 Sell 51.87 21,676 8,009 17,180
3/5/2018 Buy 53.43 25,070 8,009 19,867
3/5/2018 Sell 61.83 25,070 8,009 19,867
3/12/2018 Buy 62.49 23,054 8,009 18,266
3/12/2018 Sell 57.50 23,054 8,009 18,266
3/19/2018 Buy 49.67 23,054 9,085 20,739
3/19/2018 Sell 57.50 23,054 9,085 20,739
3/26/2018 Buy 46.84 23,054 9,568 21,860
3/26/2018 Sell 49.55 23,054 9,568 21,860
4/2/2018 Buy 45.65 23,054 9,706 22,194
4/2/2018 Sell 46.38 23,054 9,706 22,194
4/9/2018 Buy 46.88 24,317 9,706 23,409
4/9/2018 Sell 49.47 24,317 9,706 23,409
4/16/2018 Buy 50.00 24,233 9,706 23,328
4/16/2018 Sell 49.85 24,233 9,706 23,328
4/23/2018 Buy 50.38 23,792 9,519 22,462
4/23/2018 Sell 48.58 23,792 9,519 22,462
4/30/2018 Buy 49.14 25,141 9,519 23,735
4/30/2018 Sell 51.95 25,141 9,519 23,735
5/7/2018 Buy 52.50 26,729 9,519 25,233
5/7/2018 Sell 55.85 26,729 9,519 25,233
5/14/2018 Buy 56.44 25,877 9,519 24,429
5/14/2018 Sell 54.67 25,877 9,519 24,429
5/21/2018 Buy 55.25 25,647 9,519 24,210
5/21/2018 Sell 54.79 25,647 9,519 24,210
5/29/2018 Buy 55.37 27,267 9,519 25,739
5/29/2018 Sell 58.90 27,267 9,519 25,739
6/4/2018 Buy 59.52 27,466 9,519 25,926
6/4/2018 Sell 59.99 27,466 9,519 25,926
6/11/2018 Buy 60.63 27,848 9,519 26,286
6/11/2018 Sell 61.50 27,848 9,519 26,286
6/18/2018 Buy 62.15 26,700 9,519 25,202
6/18/2018 Sell 59.62 26,700 9,519 25,202
6/25/2018 Buy 55.66 26,700 10,012 26,530
6/25/2018 Sell 58.79 26,700 10,012 26,530
7/2/2018 Buy 59.42 27,882 10,012 27,705
7/2/2018 Sell 62.08 27,882 10,012 27,705
7/9/2018 Buy 62.74 29,011 10,012 28,827
7/9/2018 Sell 65.31 29,011 10,012 28,827
7/16/2018 Buy 66.00 28,104 10,012 27,925
7/16/2018 Sell 63.97 28,104 10,012 27,925
7/23/2018 Buy 64.65 27,352 10,012 27,178
7/23/2018 Sell 62.95 27,352 10,012 27,178
7/30/2018 Buy 63.62 27,007 9,878 26,483
7/30/2018 Sell 62.04 27,007 9,878 26,483
8/6/2018 Buy 65.25 27,340 9,878 26,810
8/6/2018 Sell 66.09 27,340 9,878 26,810
8/13/2018 Buy 66.79 26,605 9,593 25,327
8/13/2018 Sell 63.23 26,605 9,593 25,327
8/20/2018 Buy 65.37 27,983 9,593 26,638
8/20/2018 Sell 68.79 27,983 9,593 26,638
8/27/2018 Buy 69.52 28,834 9,593 27,448
8/27/2018 Sell 71.67 28,834 9,593 27,448
9/4/2018 Buy 67.09 28,834 9,617 27,544
9/4/2018 Sell 67.36 28,834 9,617 27,544
9/10/2018 Buy 68.07 29,051 9,617 27,751
9/10/2018 Sell 68.62 29,051 9,617 27,751
9/17/2018 Buy 69.35 28,100 9,617 26,842
9/17/2018 Sell 67.11 28,100 9,617 26,842
9/24/2018 Buy 67.82 30,024 9,617 28,679
9/24/2018 Sell 72.50 30,024 9,617 28,679
10/1/2018 Buy 63.84 30,024 9,871 29,463
10/1/2018 Sell 65.67 30,024 9,871 29,463
10/8/2018 Buy 57.46 30,024 10,843 32,393
10/8/2018 Sell 63.84 30,024 10,843 32,393
10/15/2018 Buy 57.41 30,024 10,514 31,439
10/15/2018 Sell 55.79 30,024 10,514 31,439
10/22/2018 Buy 57.41 29,544 10,336 30,419
10/22/2018 Sell 55.60 29,544 10,336 30,419
10/29/2018 Buy 52.08 29,544 9,976 29,384
10/29/2018 Sell 50.39 29,544 9,976 29,384
11/5/2018 Buy 52.08 29,769 9,976 29,607
11/5/2018 Sell 52.50 29,769 9,976 29,607
11/12/2018 Buy 48.92 29,769 10,366 30,793
11/12/2018 Sell 50.99 29,769 10,366 30,793
11/19/2018 Buy 44.18 29,769 10,981 32,648
11/19/2018 Sell 47.03 29,769 10,981 32,648
11/26/2018 Buy 47.53 33,853 10,981 37,130
11/26/2018 Sell 54.08 33,853 10,981 37,130
12/3/2018 Buy 43.16 33,853 11,387 38,537
12/3/2018 Sell 44.88 33,853 11,387 38,537
12/10/2018 Buy 45.35 33,028 11,091 36,612
12/10/2018 Sell 43.16 33,028 11,091 36,612
12/17/2018 Buy 32.00 33,028 13,809 45,622
12/17/2018 Sell 42.47 33,028 13,809 45,622
12/24/2018 Buy 37.36 33,028 11,483 37,967
12/24/2018 Sell 32.00 33,028 11,483 37,967
12/31/2018 Buy 37.36 33,995 11,483 39,081
12/31/2018 Sell 38.47 33,995 11,483 39,081
1/7/2019 Buy 38.88 35,338 11,483 40,627
1/7/2019 Sell 40.43 35,338 11,483 40,627
1/14/2019 Buy 40.86 38,049 11,483 43,746
1/14/2019 Sell 44.01 38,049 11,483 43,746
1/22/2019 Buy 44.48 36,781 11,483 42,290
1/22/2019 Sell 43.01 36,781 11,483 42,290
1/28/2019 Buy 43.47 39,308 11,483 45,198
1/28/2019 Sell 46.47 39,308 11,483 45,198
2/4/2019 Buy 46.96 39,970 11,483 45,961
2/4/2019 Sell 47.77 39,970 11,483 45,961
2/11/2019 Buy 48.28 41,019 11,483 47,169
2/11/2019 Sell 49.56 41,019 11,483 47,169
2/19/2019 Buy 50.09 42,581 11,483 48,968
2/19/2019 Sell 52.01 42,581 11,483 48,968
3/4/2019 Buy 52.97 40,794 10,953 44,673
3/4/2019 Sell 48.54 40,794 10,953 44,673
3/11/2019 Buy 49.73 45,405 10,953 49,725
3/11/2019 Sell 55.37 45,405 10,953 49,725
3/18/2019 Buy 55.96 44,664 10,953 48,914
3/18/2019 Sell 55.06 44,664 10,953 48,914
3/25/2019 Buy 55.64 44,241 10,842 47,981
3/25/2019 Sell 54.61 44,241 10,842 47,981
4/1/2019 Buy 58.30 46,336 10,842 50,255
4/1/2019 Sell 61.08 46,336 10,842 50,255
4/8/2019 Buy 61.73 46,880 10,842 50,845
4/8/2019 Sell 62.47 46,880 10,842 50,845
4/15/2019 Buy 63.13 46,879 10,842 50,845
4/15/2019 Sell 63.15 46,879 10,842 50,845
4/22/2019 Buy 63.82 49,392 10,842 53,572
4/22/2019 Sell 67.26 49,392 10,842 53,572
5/6/2019 Buy 56.48 49,392 11,847 58,595
5/6/2019 Sell 62.34 49,392 11,847 58,595
5/13/2019 Buy 56.38 49,392 11,854 58,685
5/13/2019 Sell 56.48 49,392 11,854 58,685
5/20/2019 Buy 57.08 48,553 11,640 56,658
5/20/2019 Sell 55.15 48,553 11,640 56,658
5/28/2019 Buy 49.82 48,553 12,284 59,849
5/28/2019 Sell 52.81 48,553 12,284 59,849
6/3/2019 Buy 53.37 46,932 11,840 55,716
6/3/2019 Sell 49.82 46,932 11,840 55,716
6/10/2019 Buy 57.36 47,434 11,840 56,314
6/10/2019 Sell 57.99 47,434 11,840 56,314
6/17/2019 Buy 58.60 51,535 11,840 61,186
6/17/2019 Sell 63.69 51,535 11,840 61,186
7/1/2019 Buy 65.30 51,118 11,840 60,694
7/1/2019 Sell 64.79 51,118 11,840 60,694
7/8/2019 Buy 65.48 53,824 11,840 63,908
7/8/2019 Sell 68.96 53,824 11,840 63,908
7/22/2019 Buy 69.69 54,017 11,840 64,141
7/22/2019 Sell 69.96 54,017 11,840 64,141
7/29/2019 Buy 57.94 54,017 13,096 71,008
7/29/2019 Sell 64.90 54,017 13,096 71,008
8/5/2019 Buy 59.28 54,017 12,779 69,352
8/5/2019 Sell 57.94 54,017 12,779 69,352
8/12/2019 Buy 59.28 55,999 12,779 71,900
8/12/2019 Sell 61.47 55,999 12,779 71,900
8/19/2019 Buy 62.12 53,359 12,109 64,775
8/19/2019 Sell 56.28 53,359 12,109 64,775
8/26/2019 Buy 57.49 55,016 12,109 66,789
8/26/2019 Sell 59.29 55,016 12,109 66,789
9/3/2019 Buy 59.92 59,639 12,109 72,405
9/3/2019 Sell 64.97 59,639 12,109 72,405
9/9/2019 Buy 65.66 58,110 12,109 70,551
9/9/2019 Sell 63.99 58,110 12,109 70,551
9/16/2019 Buy 64.67 56,848 12,109 69,022
9/16/2019 Sell 63.28 56,848 12,109 69,022
9/23/2019 Buy 63.95 55,749 11,860 66,302
9/23/2019 Sell 61.49 55,749 11,860 66,302
9/30/2019 Buy 62.14 54,165 11,498 62,424
9/30/2019 Sell 58.63 54,165 11,498 62,424
10/7/2019 Buy 60.86 56,277 11,498 64,861
10/7/2019 Sell 63.25 56,277 11,498 64,861
10/14/2019 Buy 63.92 56,325 11,498 64,918
10/14/2019 Sell 63.99 56,325 11,498 64,918

Update Jan 9th 2020

Please refer to trades below. Algorithm is doing ok with annualized returns running at around 180% since inception. Buy-hold has also been good with this stock around twice the returns of the algorithm. Hard to compete with that.


Trades

This table shows the trades since publication. Current profit is around 21% (163% annualized), with drawdown around 5.4%. 8 of 12 trades were good.

Date Type Buy Sell  Asset Value
20-Oct-2019  $           10,000
21-Oct-2019 Buy 65.719  $           10,000
28-Oct-2019 Sell 68.860  $           10,478
28-Oct-2019 Buy 69.590  $           10,478
4-Nov-2019 Sell 72.610  $           10,933
7-Nov-2019 Buy 73.380  $           10,933
11-Nov-2019 Sell 72.570  $           10,812
11-Nov-2019 Buy 73.339  $           10,812
15-Nov-2019 Sell 75.110  $           11,073
18-Nov-2019 Buy 75.906  $           11,073
25-Nov-2019 Sell 75.120  $           10,958
25-Nov-2019 Buy 75.916  $           10,958
2-Dec-2019 Sell 77.740  $           11,222
3-Dec-2019 Short 73.120  $           11,222
9-Dec-2019 Cover 77.090  $           10,612
9-Dec-2019 Buy 77.090  $           10,612
16-Dec-2019 Sell 81.420  $           11,209
16-Dec-2019 Buy 82.283  $           11,209
23-Dec-2019 Sell 86.020  $           11,718
26-Dec-2019 Buy 86.932  $           11,718
30-Dec-2019 Sell 87.730  $           11,825
2-Jan-2020 Buy 88.660  $           11,825
6-Jan-2020 Sell 86.270  $           11,506
6-Jan-2020 Buy 87.184  $           11,506
9-Jan-2020 Last 92.100  $           12,155

Final Update and wrap-up Dec 4th 2021

In the interest of completeness, lets take a look at how this algorithm has performed over the longer term. In the graphic, buy-hold is in the white and the algorithm is in yellow. You can see that the algorithm did extremely well until April 13th 2020, while buy-hold had a period of significant drawdown during the early days of the Covid pandemic. After this, the performance of buy-hold was spectacular (shorting would have been a total loss, of course) while the algorithm equity improved only slightly. Nevertheless, the algorithm overall gave a 48% annualized return, which is decent, and you always have to remember that the algorithm makes all the buy/sell decisions for you. Drawdown for the algorithm was much less (37%) than for buy-hold (68%) so reward-risk was 1.45 for buy-hold vs. 1.15 for the algorithm. Had you traded the algorithm long only, drawdown was only 16% and reward-risk was 4.5, but that is academic.

Also worth remembering is that the algorithm was never re-parameterized over the whole period, however if you look at the scans you can see that the parameters are a long way off the optimums:

Had we adjusted the parameters as we went, the performance could have been most likely been much improved, although certainly not to the 241% annualized return suggested by the backtests. The improved parameters were established at least a year ago, and kept the algorithm long for the most part.