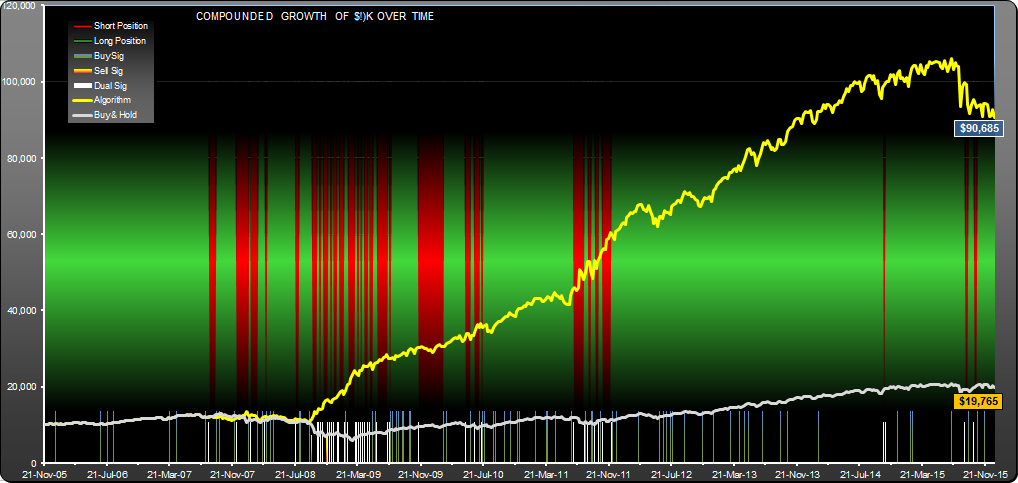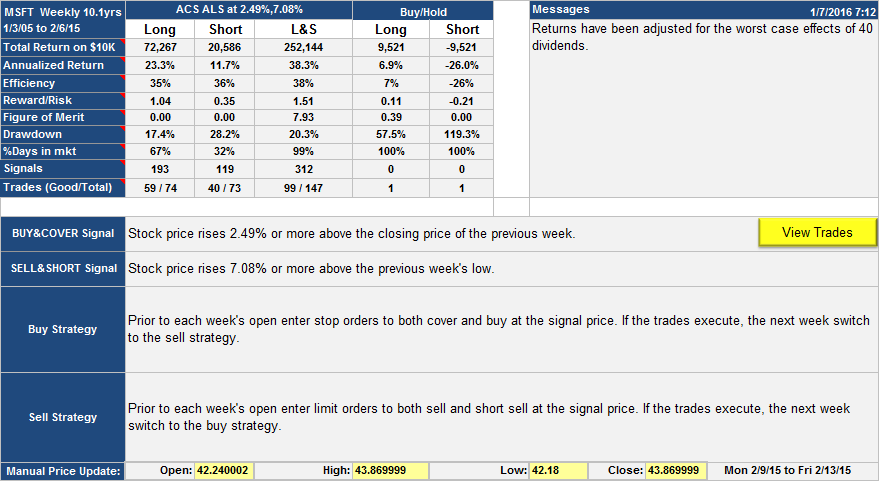
MSFT daily trading strategy
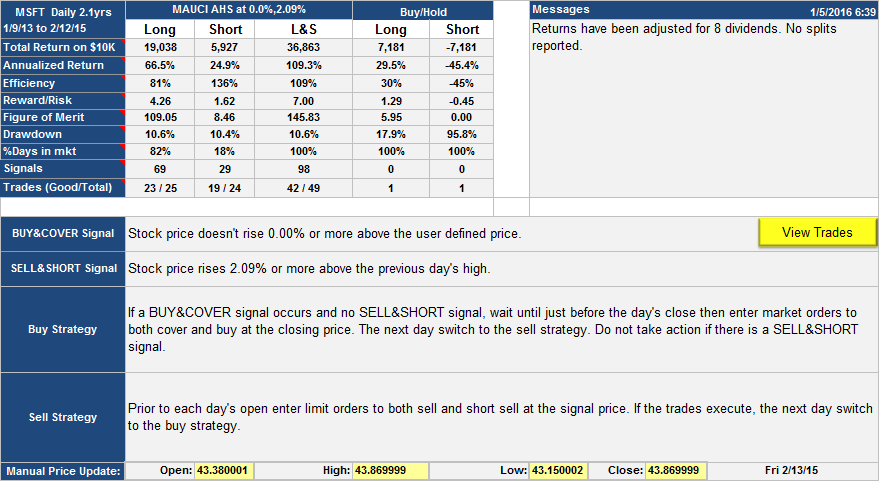
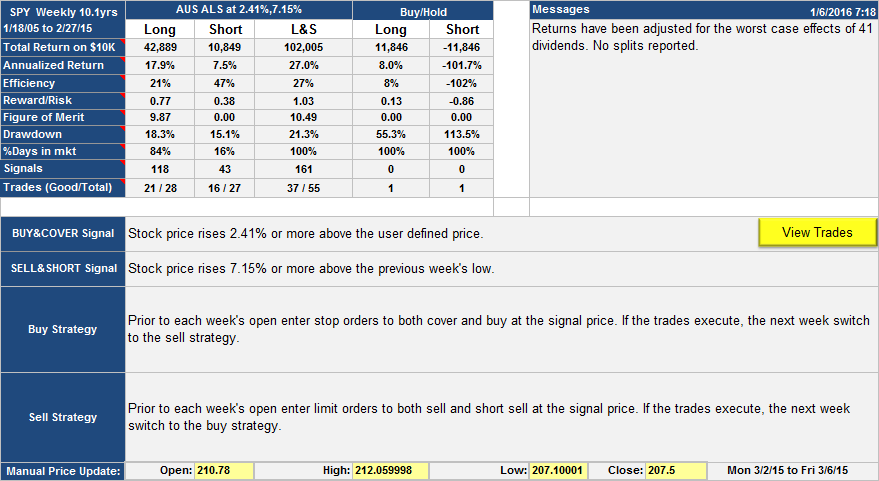
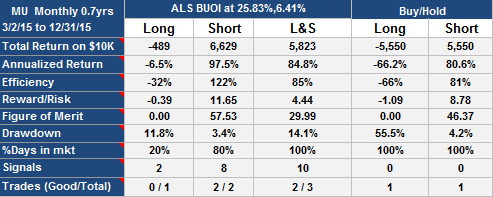
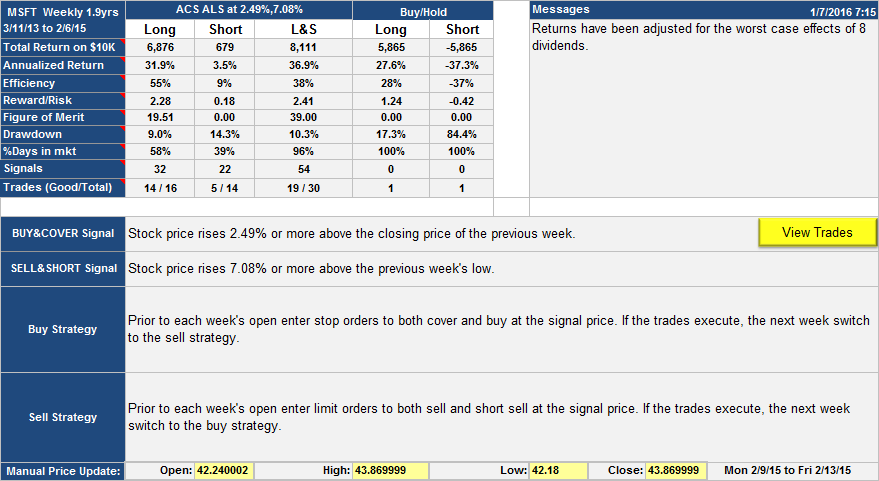
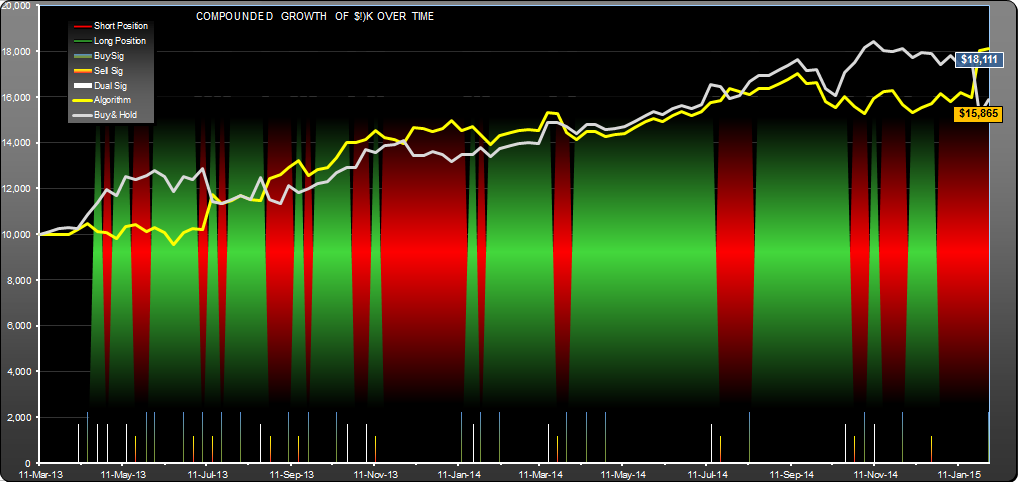
MSFT daily trading strategy, performance table and strategy details. Note that "user defined price" is the average of the high and low of previous day and the open of current day [ (h+l+o)/3 ]. A few observations; return and reward/risk was 5x better than buy-hold. Drawdown of 10.6% vs. 17.9% for buy-hold. Long side worked much better than short side.
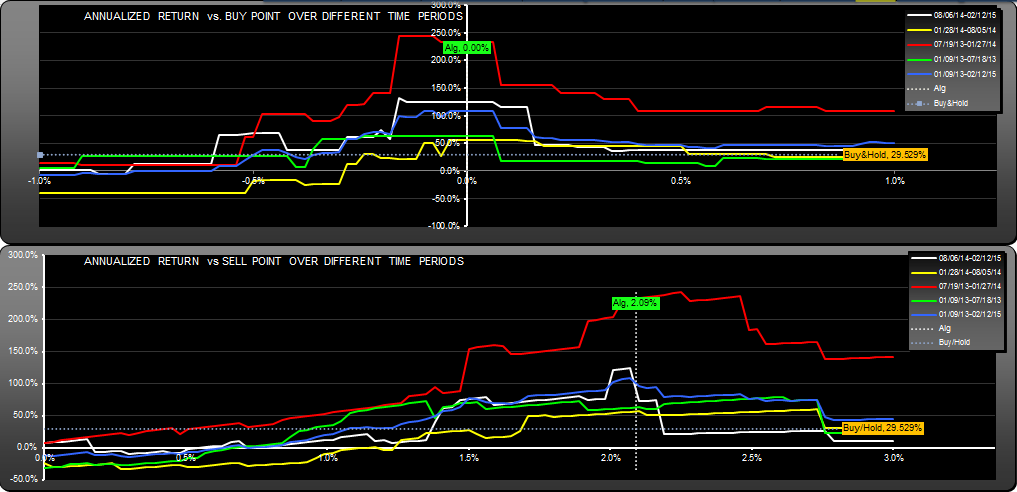
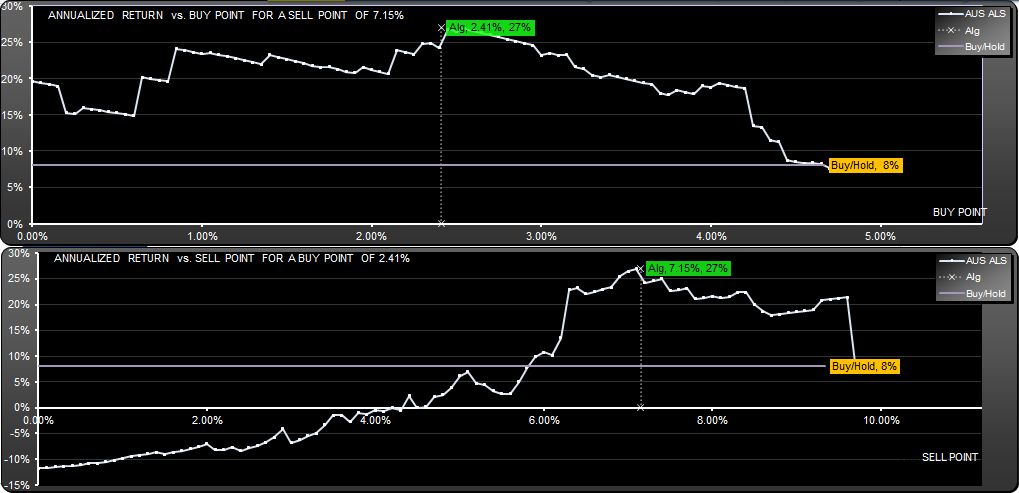
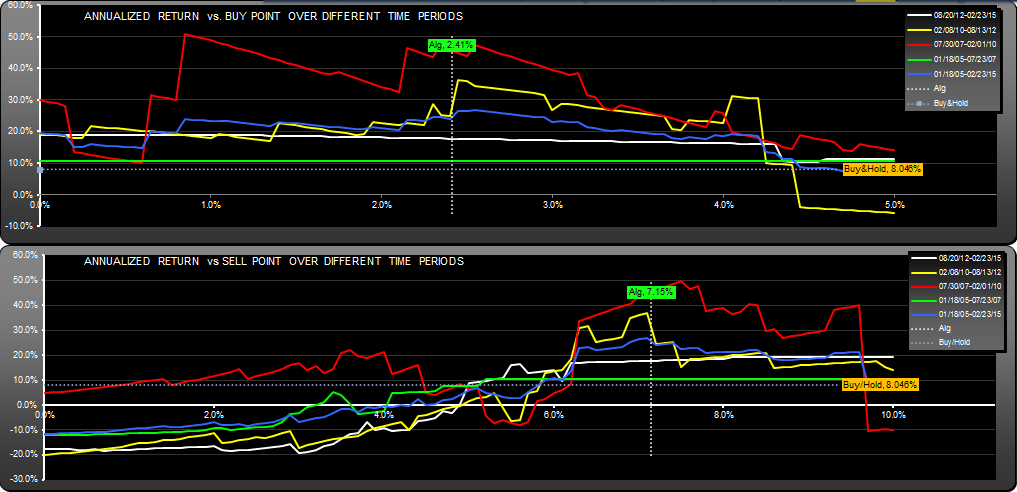
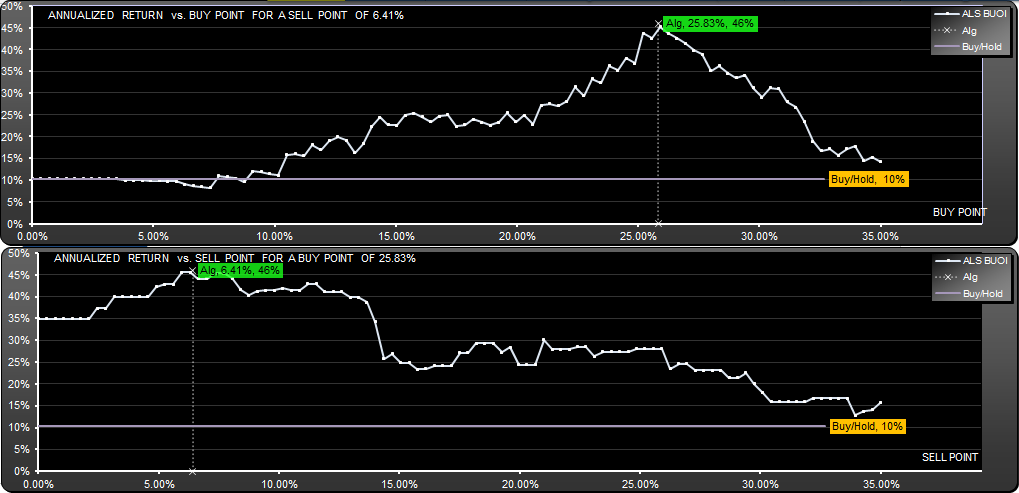
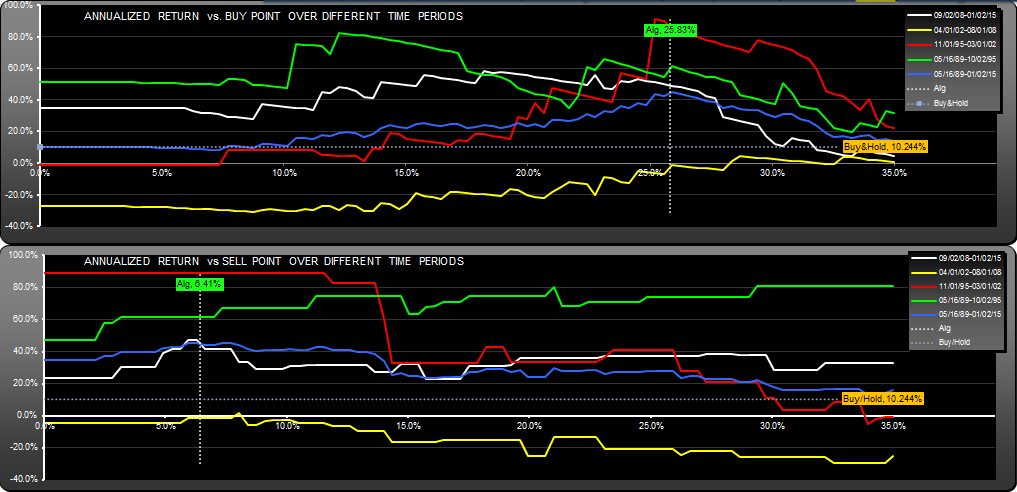
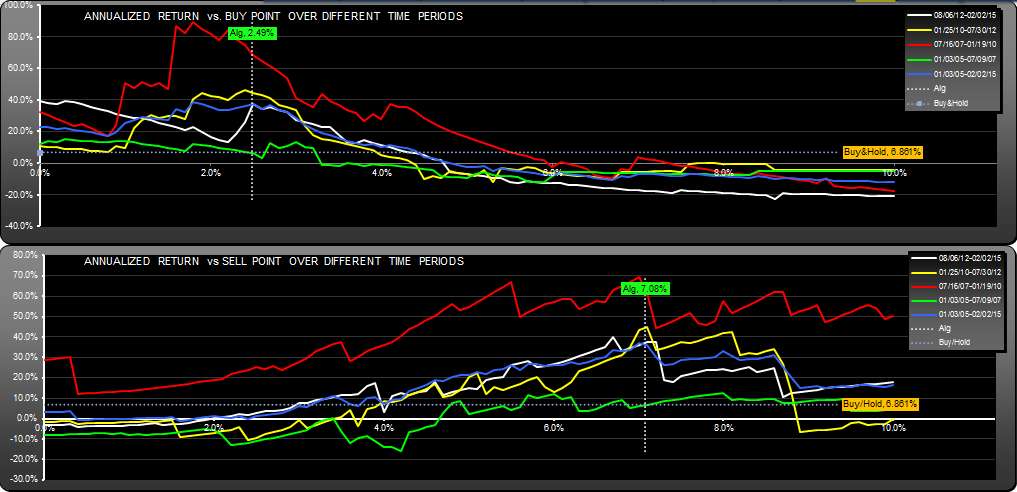
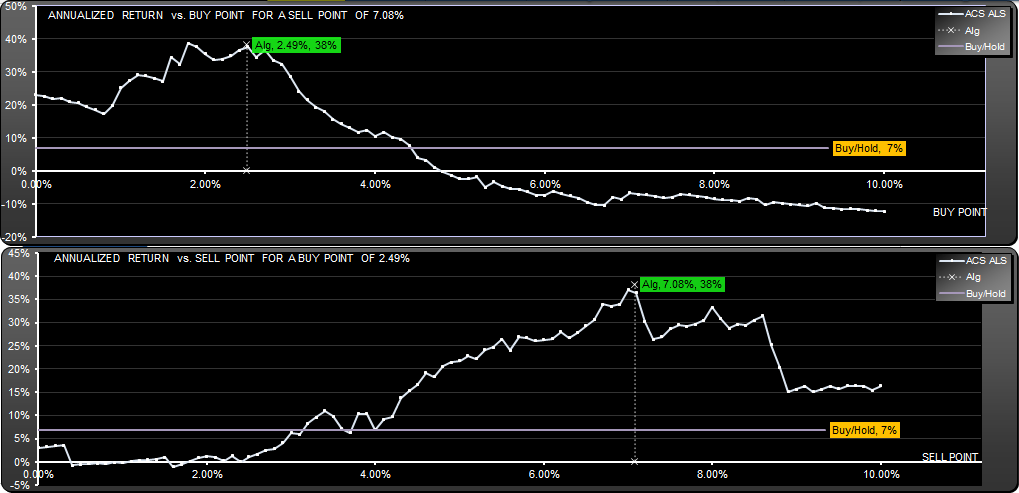
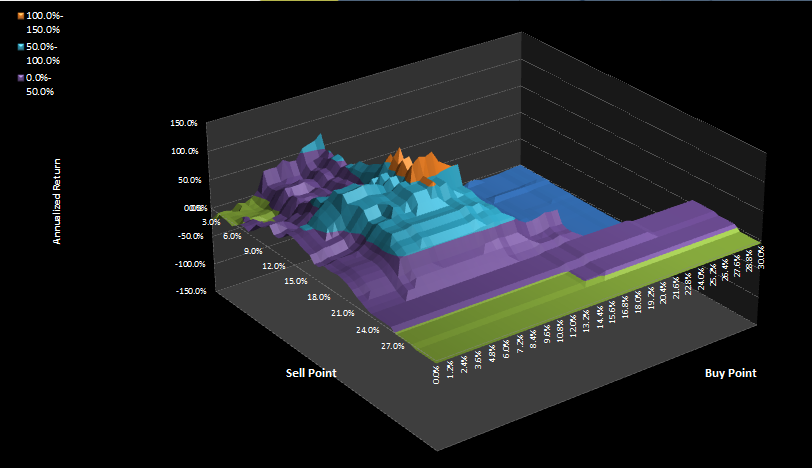
MSFT daily strategy, graph showing how return varied with buy and sell point parameters for different time periods. The blue line shows the overall 2 year graphs, the others are for 6 month periods. All periods gave better returns than buy-hold. Note that buy point range is fairly restricted.
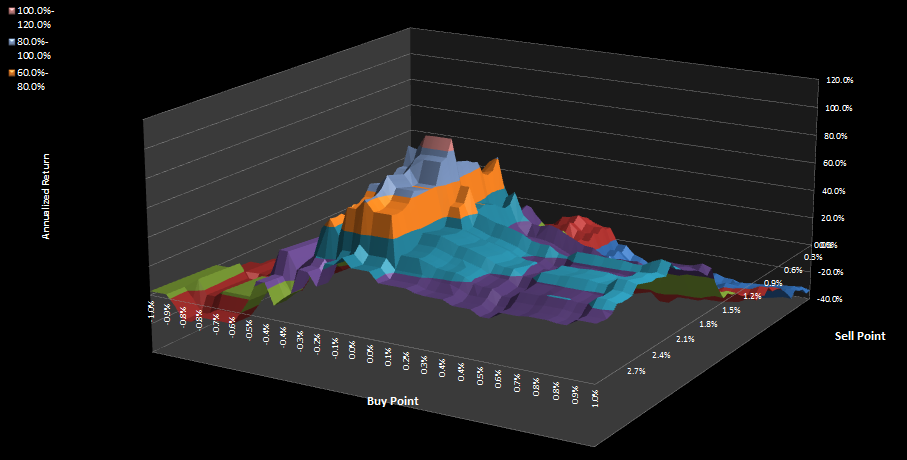
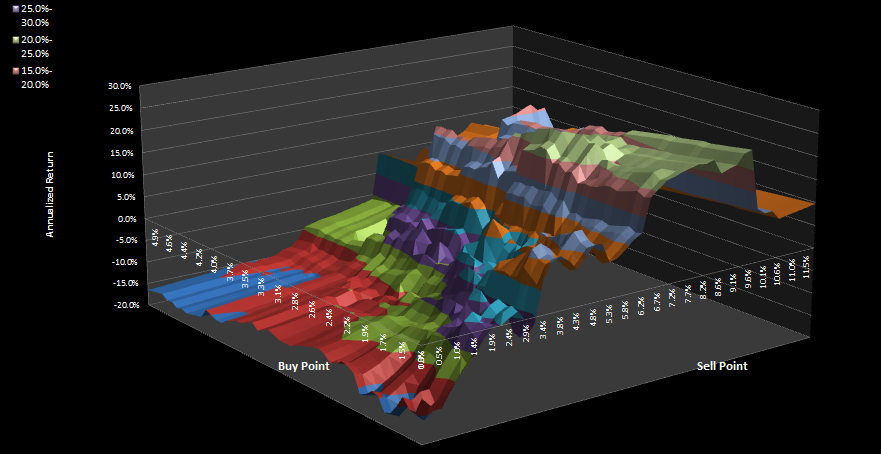
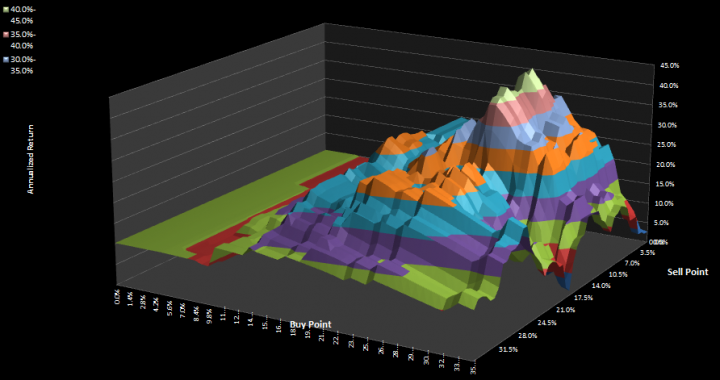
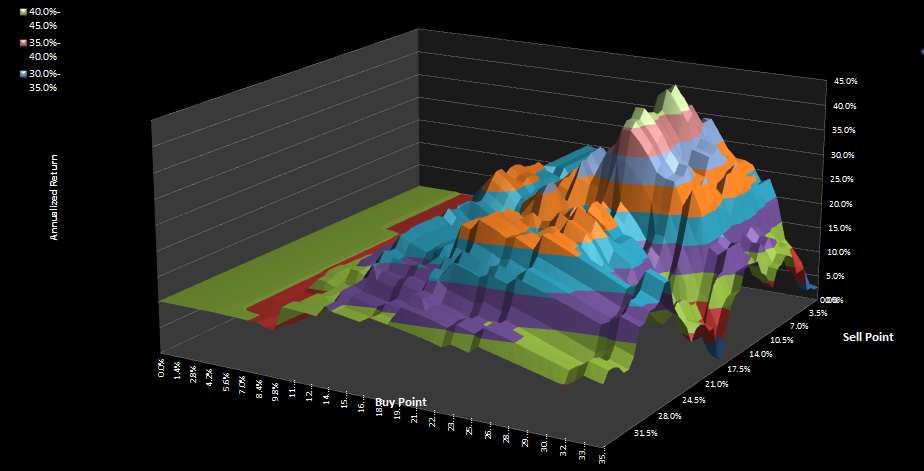
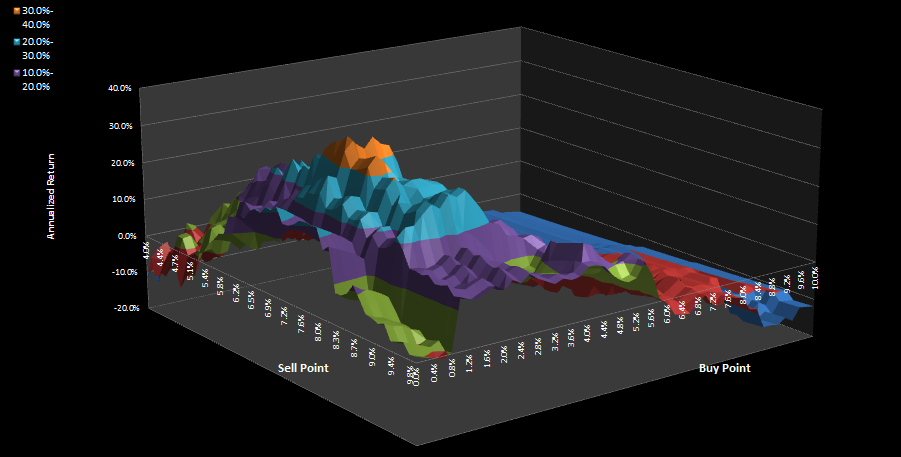
MSFT daily strategy, surface plot of return (z axis) as it changes with buy and sell point. The blue plateau is roughly the same return as buy-hold.
On Jan-5-2016 this post was corrected for a short-side return error, and a commission of $7 per trade was factored in.
Update Jan 5th 2016
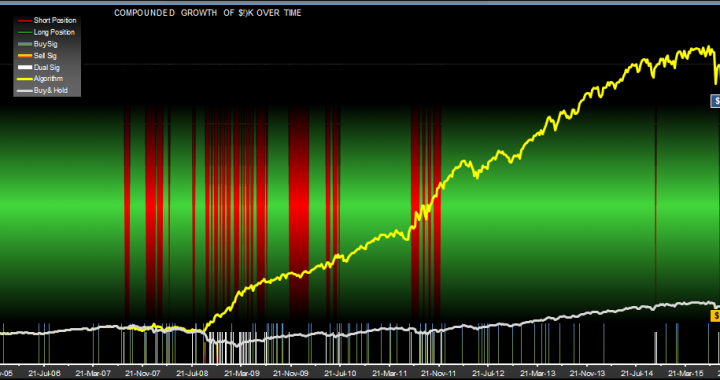
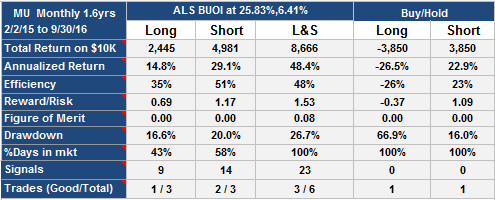
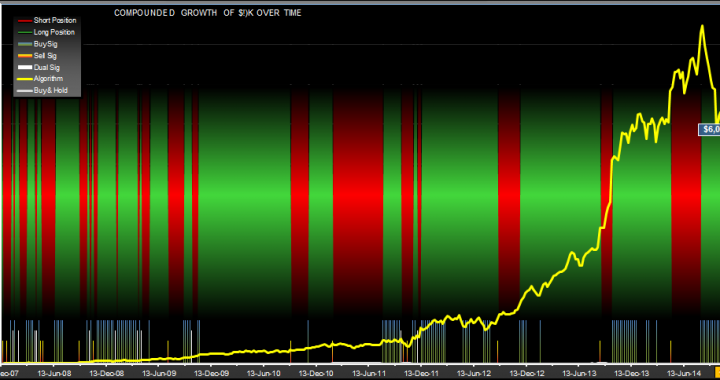
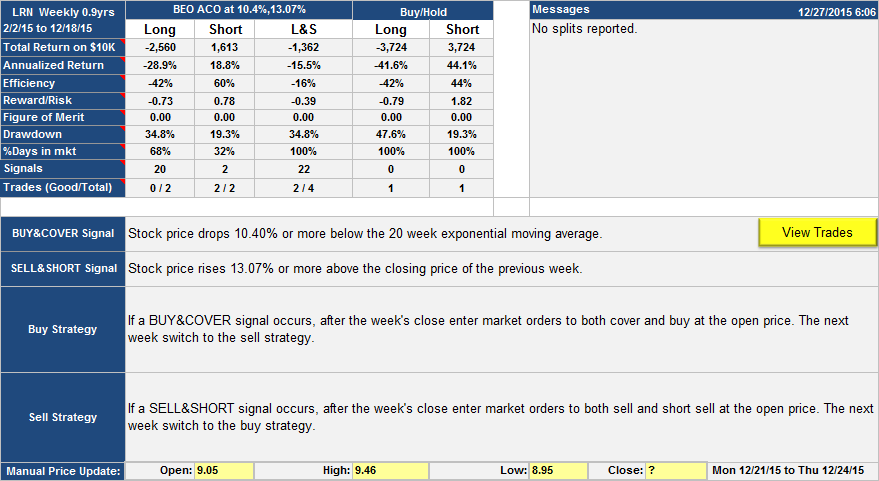
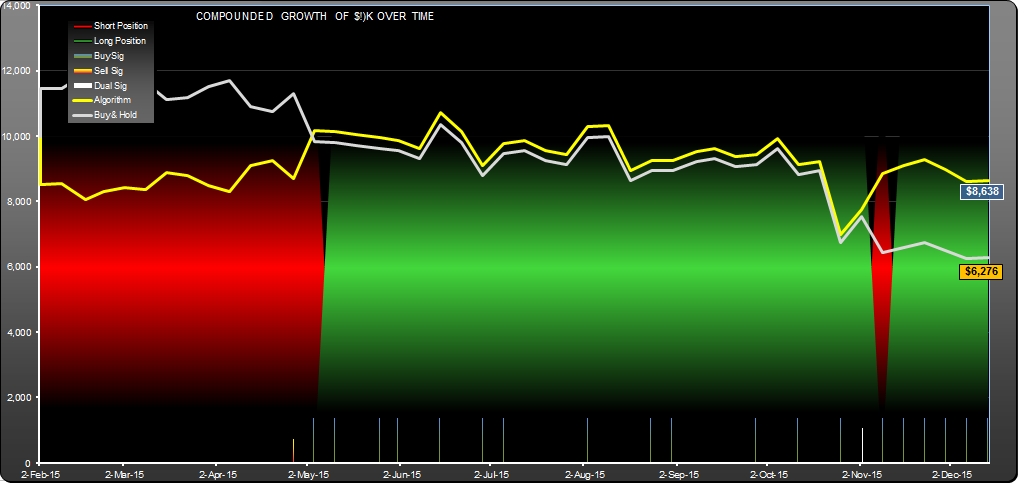
This algorithm was not a stellar performer. Since publication it has been essentially flat, let down badly by the short-side performance

To be fair, the long side performance was reasonable, but buy-hold was on a roll.
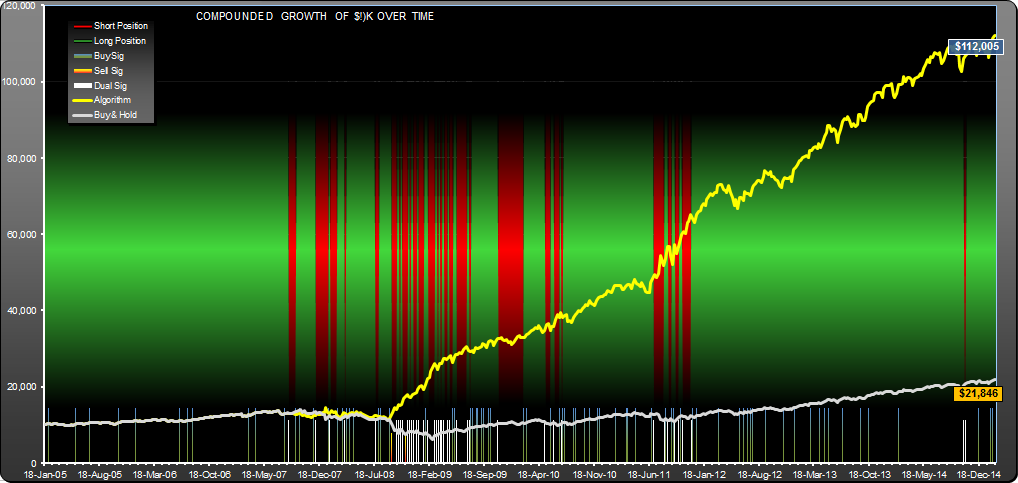
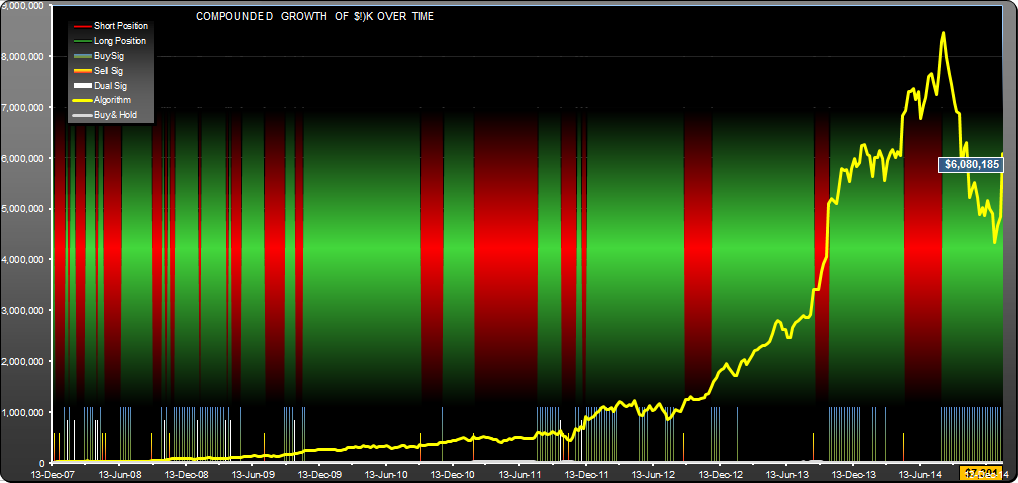
Optimum parameters for this period were different than the original posting, buy point -0.98%, sell point 10.33% for this result:

Again, long-side was much more interesting than short-side performance.
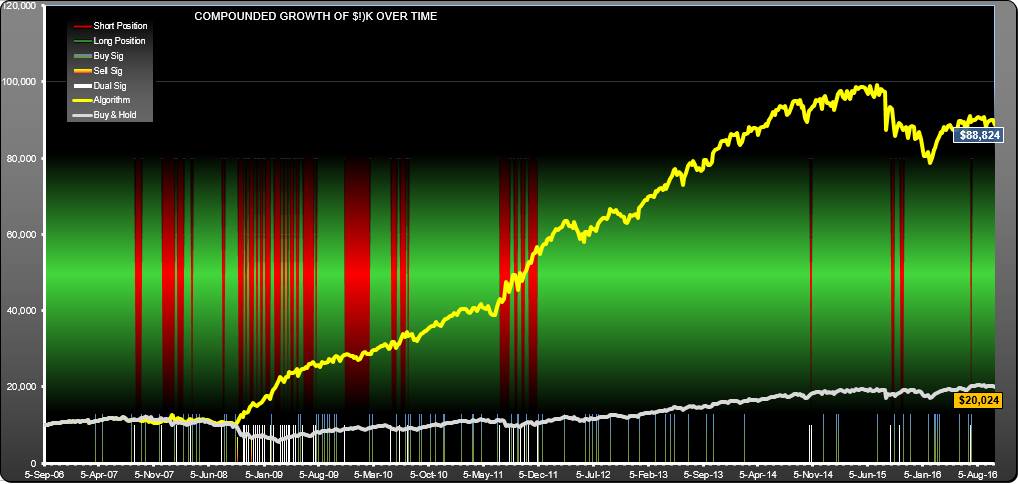
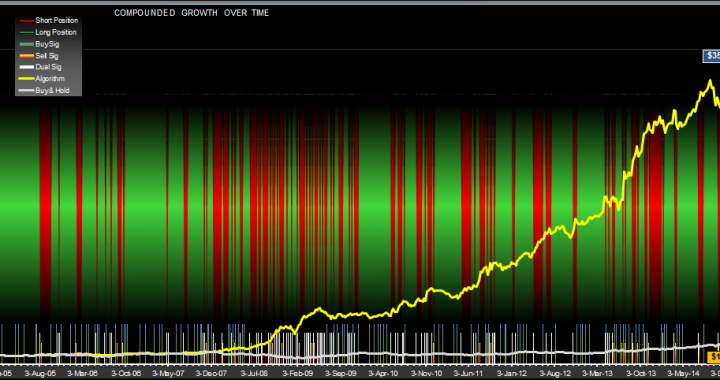
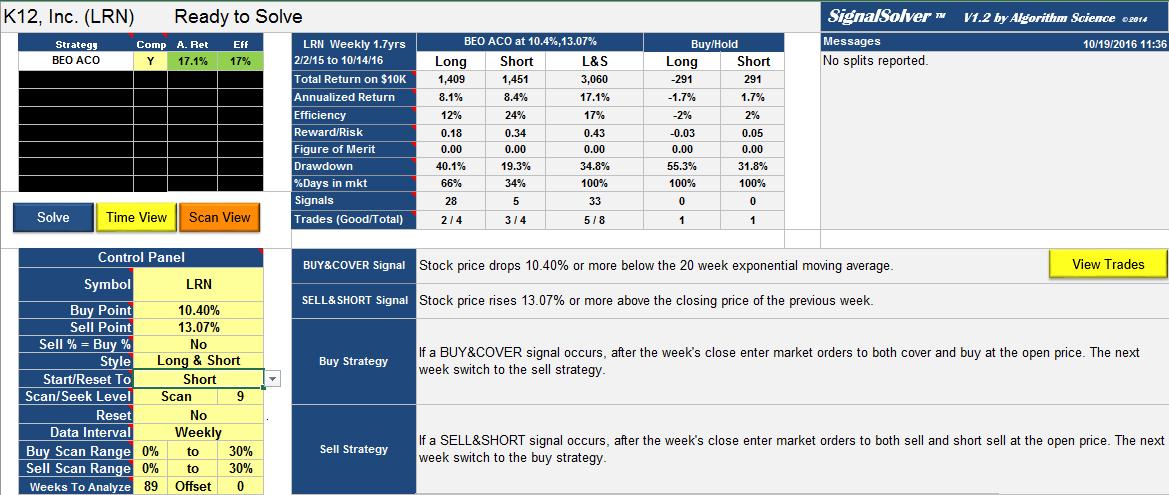
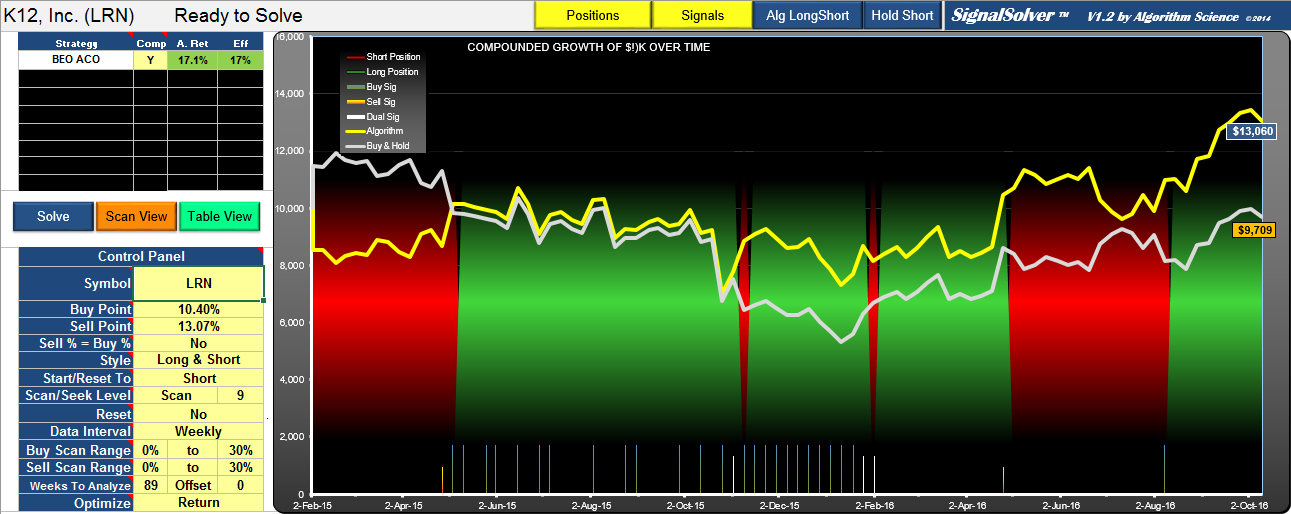
Update Oct 19th 2016
This algorithm continues to perform badly
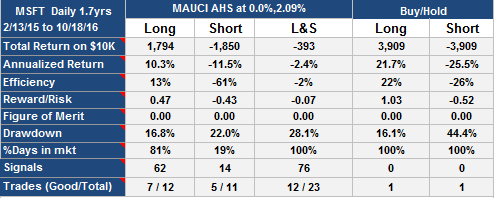
MSFT Trading Strategy (Daily) update Oct 19th 2016