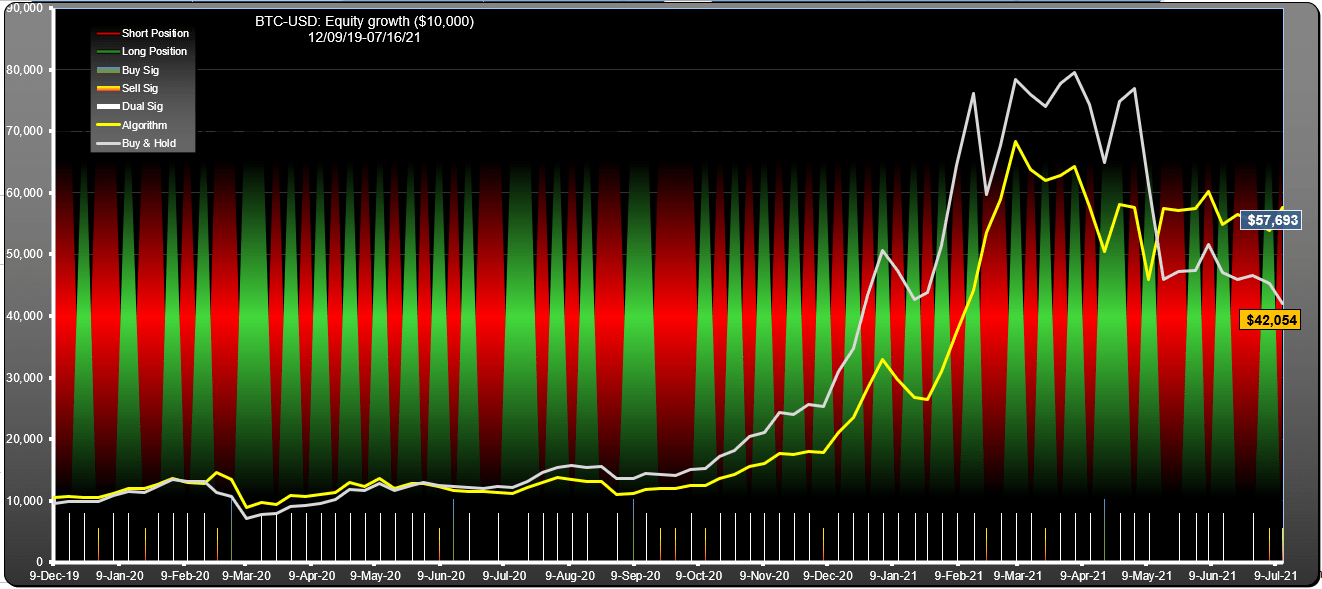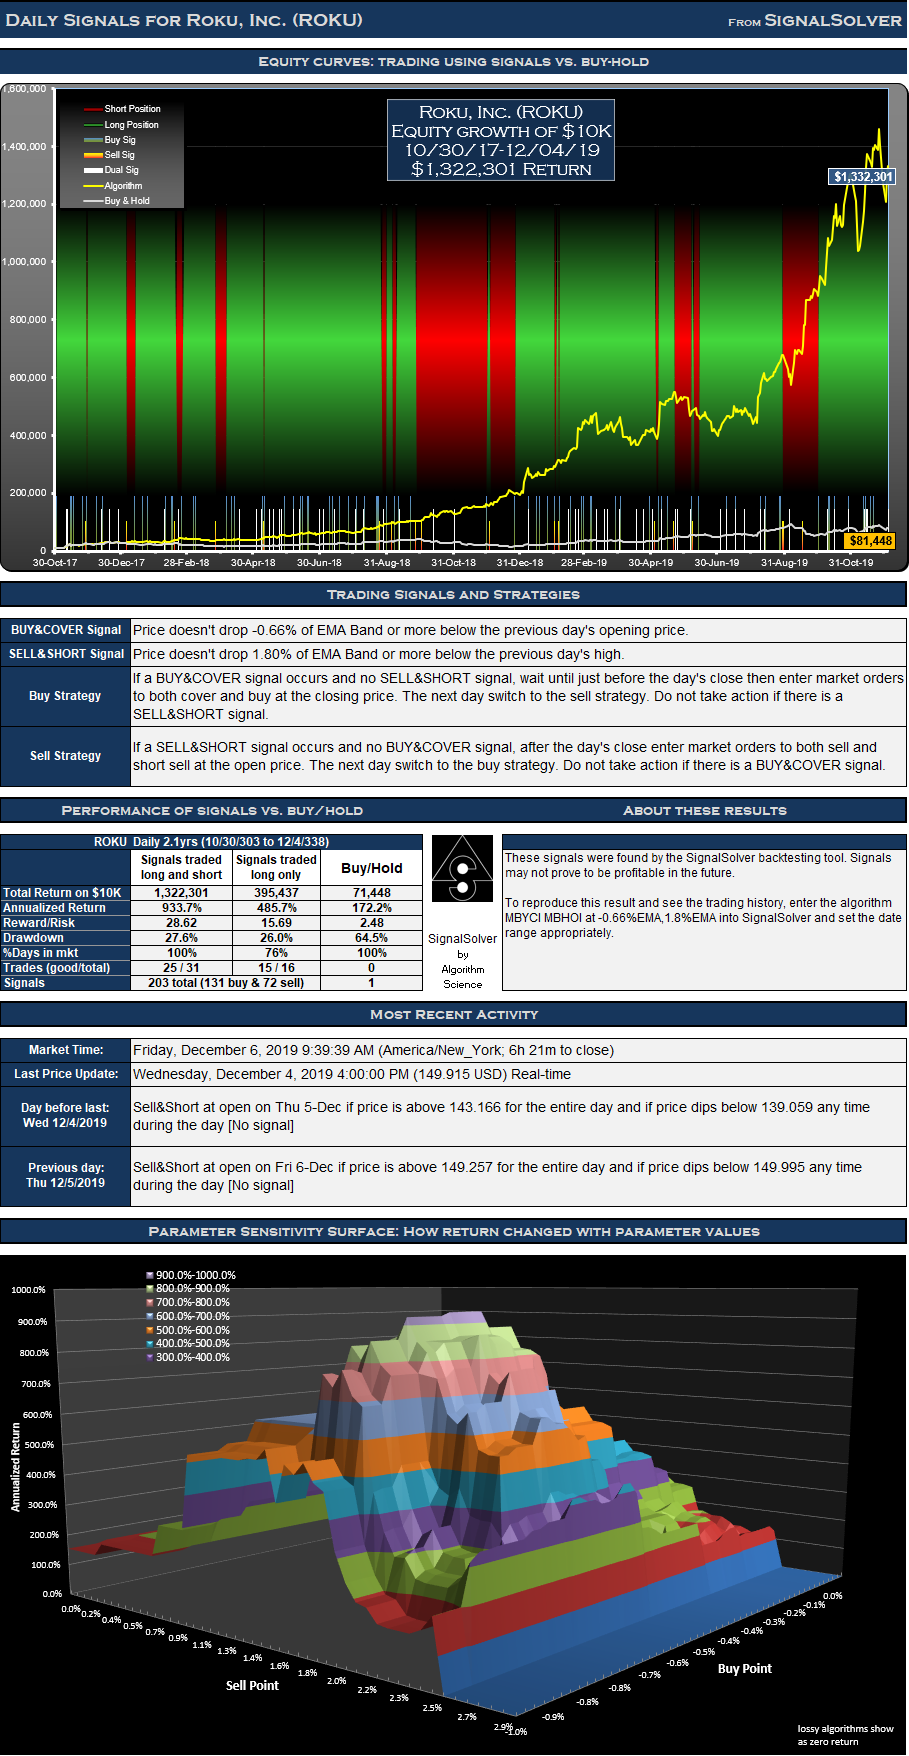
Bitcoin Trading Strategy using SignalSolver Sentiment
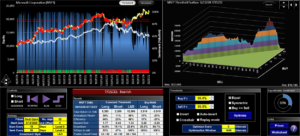
This trading strategy for Bitcoin uses SignalSolver Sentiment to generate trading signals. It is currently showing a 22% drawdown, but it has been a good performer overall. Sentiment on any given day is determined by backtesting up to that day, selecting the top algorithms and evaluating the ratio of long to short positions. Sentiment (percentage bullish) is shown as a blue bar-chart on the graph. Trading is performed subsequent to the Sentiment crossing a threshold value.
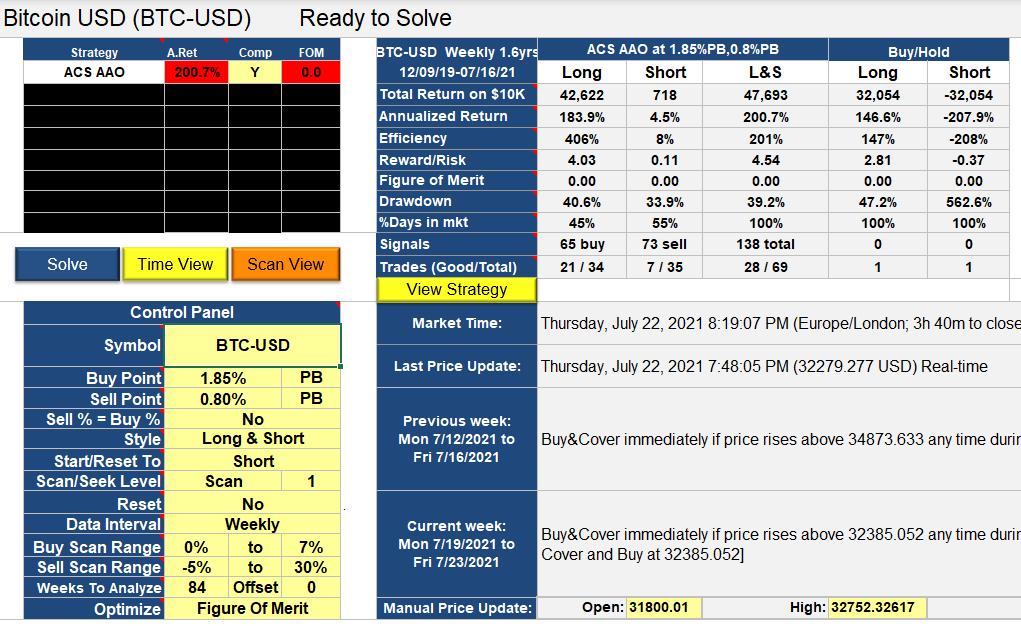
The Buy and Sell thresholds for this simulation (green and red lines on the time graph) used an adaptive technique every cycle to determine the optimum values, with the constraints Buy+Sell=100% and Buy>Sell. The optimum thresholds settled down pretty quickly to Buy=55% and Sell=45%. Return was $67,966 since 1/1/21 for a $10,000 outlay (CAGR 0f 273%), with Risk-Reward about 680 times that for Short-hold. The simulations assume the ability to both long and short the security, but the table includes both the Long and Short returns

Bitcoin trading using SignalSolver Sentiment with adaptive symmetric thresholds
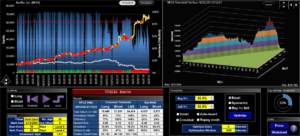
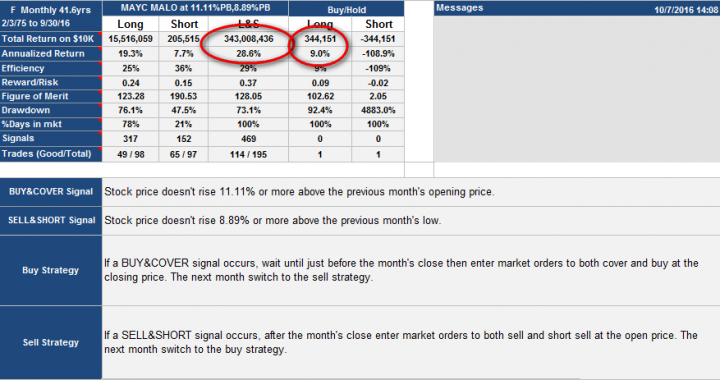
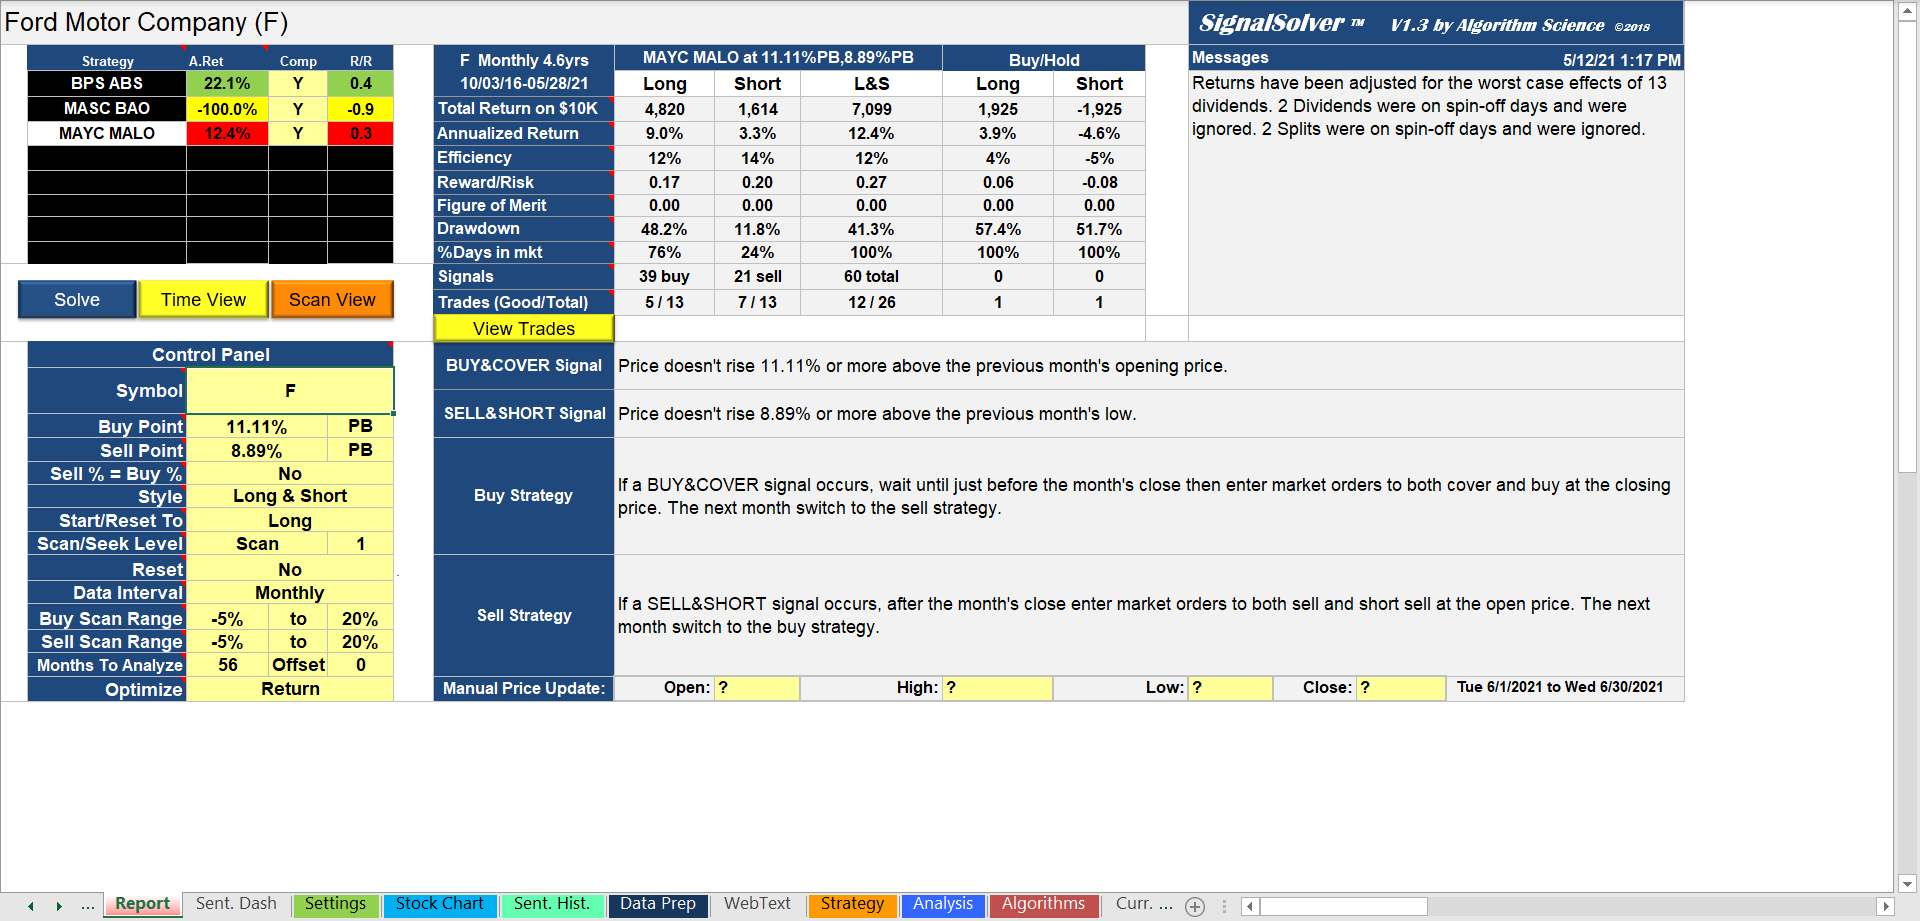
In selecting a threshold strategy, you couldn't get into too much trouble since the other two common threshold strategies also showed a profit. Using an adaptive threshold with the Buy=Sell constraint applied returned $25,206 (123% CAGR)--

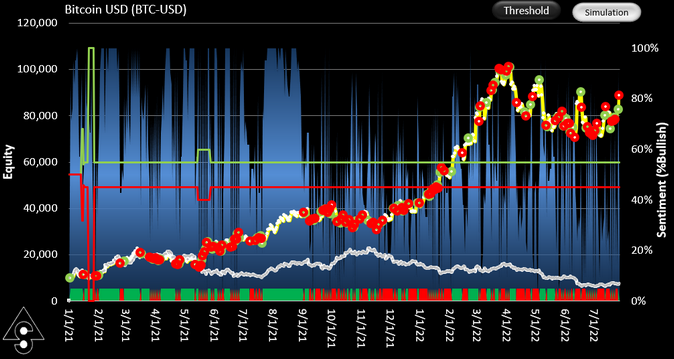
Bitcoin trading using SignalSolver Sentiment, adaptive equal thresholds
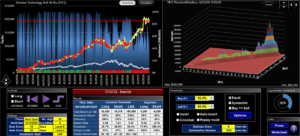
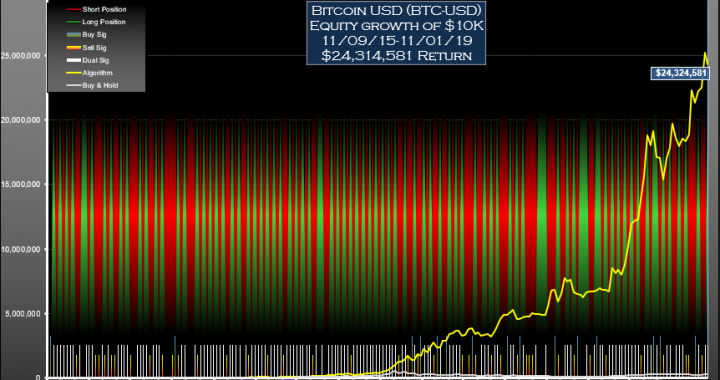
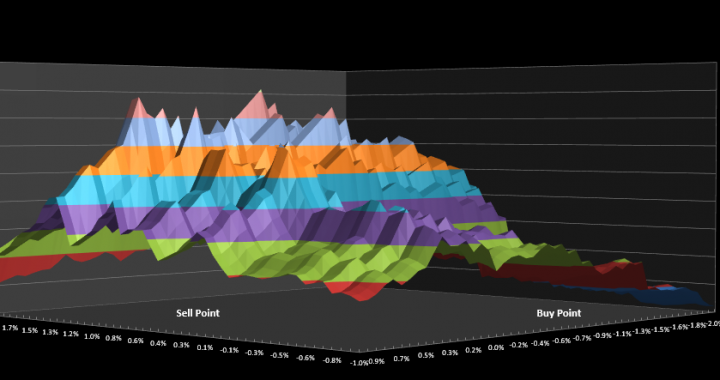
Finally applying a simple constant 50% threshold also worked well, returning $40,640 (183% CAGR). From this image you can view the entire threshold surface, which is what we like to see--a solid looking structure.
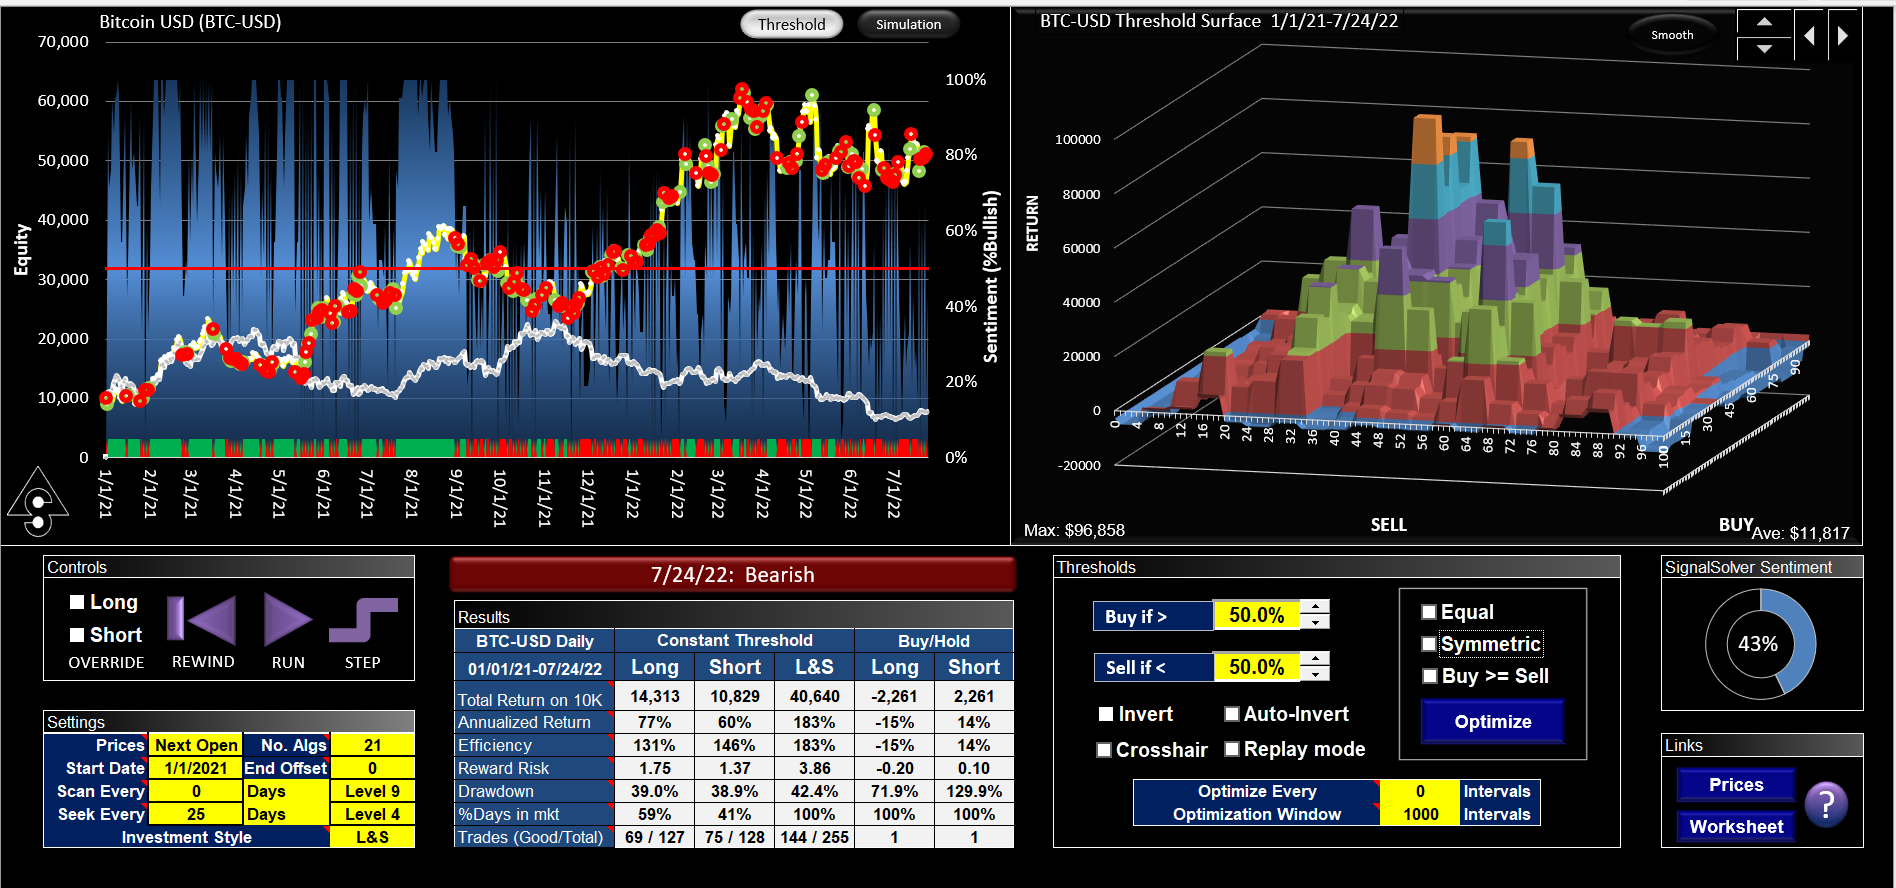
Bitcoin trading using SignalSolver Sentiment with a fixed 50% threshold
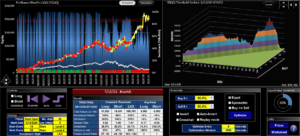
Settings are shown below:
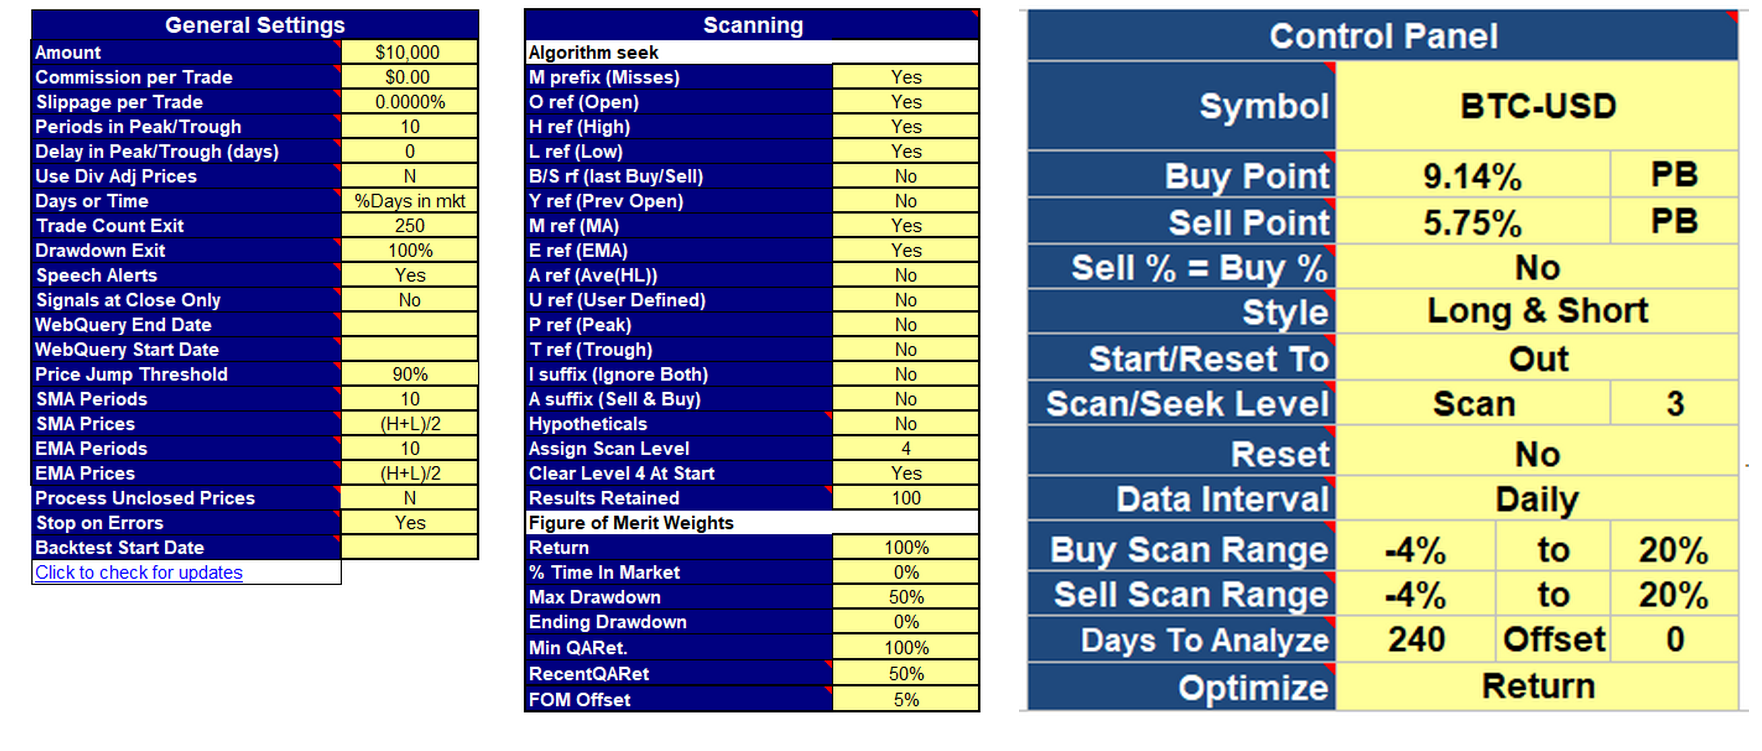
SignalSolver settings for the Bitcoin Sentiment runs
These are the same settings we used for TQQQ with the only change being that we (somewhat arbitrarily) increased the number of algorithms to 21 (from 5 for TQQQ). Only OHLC prices and short period (10 day) SMAs and EMAs are used in the backtests.
As with all Sentiment runs, out-of-sample walk-forward simulation is used. Sentiment is determined for a particular day by using the backtester on prior data, in this case using the ratio of the top 21 algorithms' long (bullish) to short (bearish) state. When the sentiment crosses the threshold in either direction, a trade is performed appropriately. In the case of Bitcoin, OHLC prices run from midnight to midnight.