SQ Signals Equity

Square (SQ) Signals-Daily

These Square (SQ) signals traded as directed would have performed around 2.9 times better than buy-hold with an ROI of 2039% for the period 22-Aug-16 to 25-Sep-18

SQ Signals

The trading signals for Square (SQ) were selected for their reward/risk and parameter sensitivity characteristics. Backtests don't always generate reliable signals which can be counted on moving forward but many traders find value in knowing what buy and sell signals would have worked well in the past.

Returns for the Square (SQ) signals

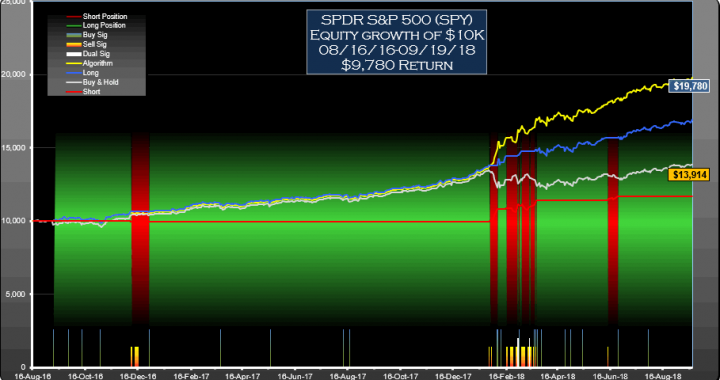
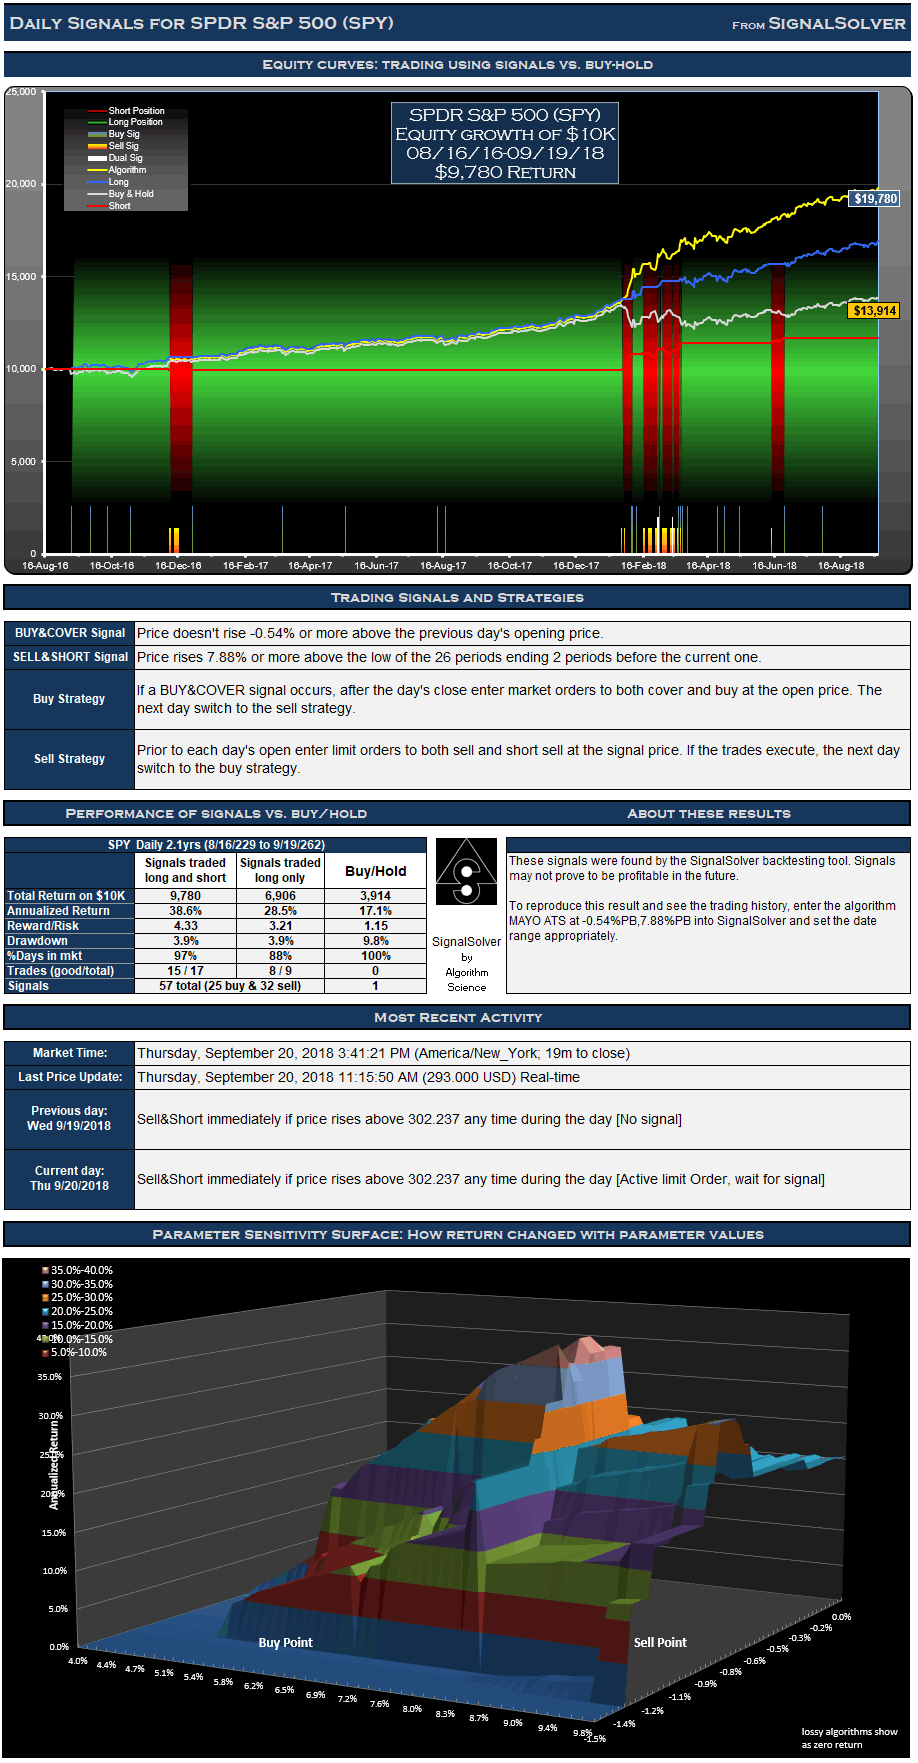
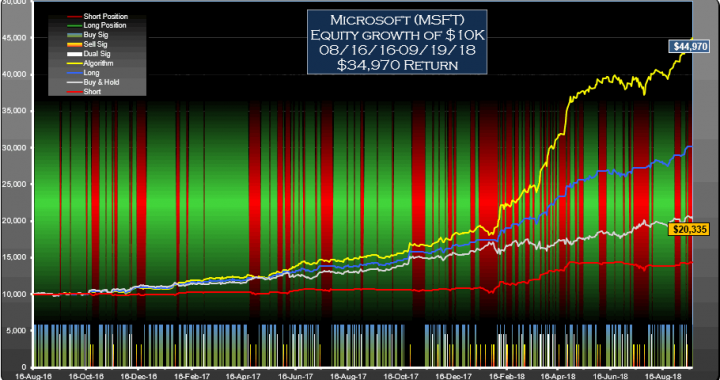
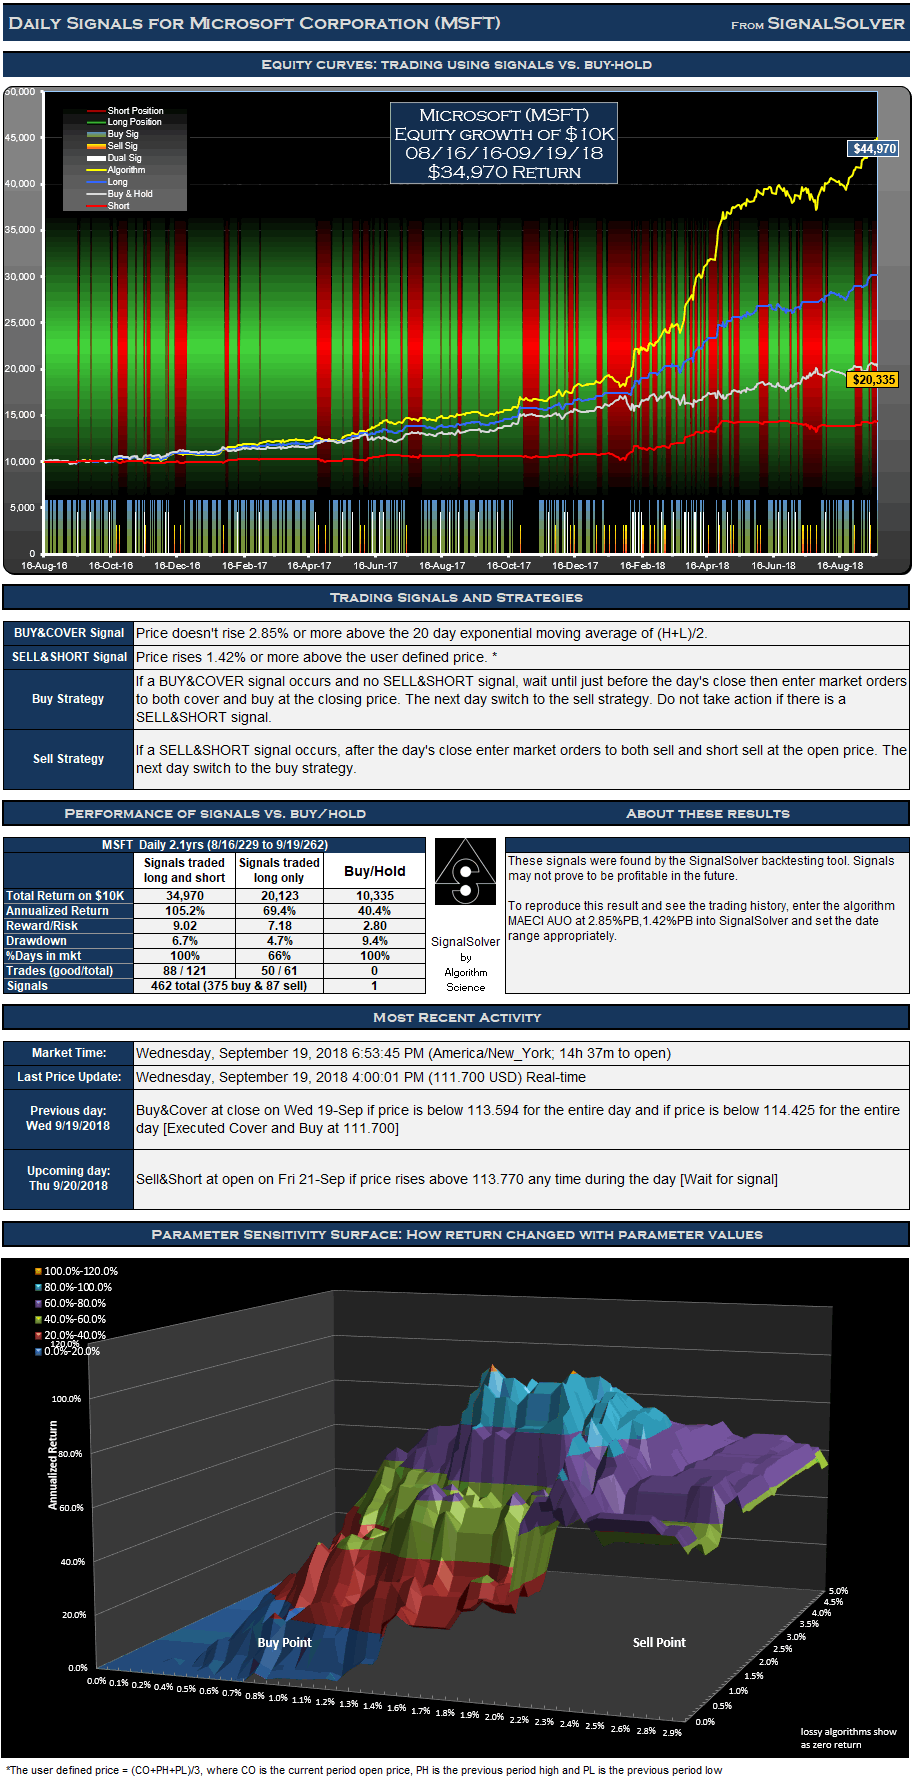
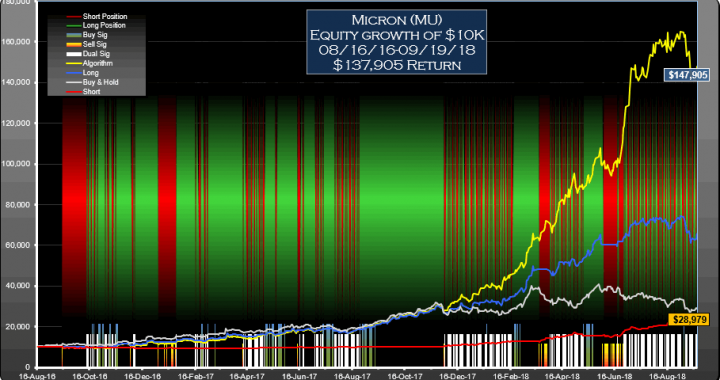
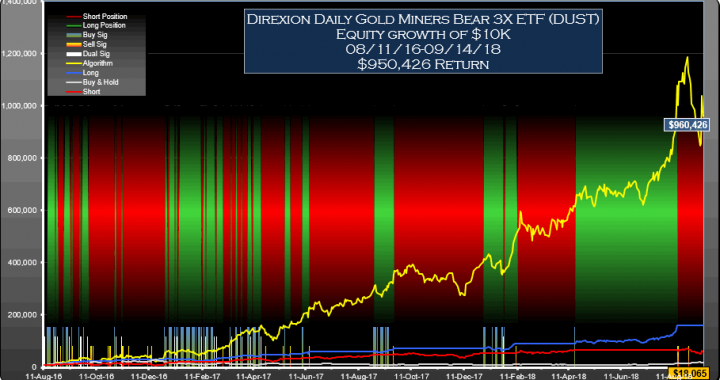
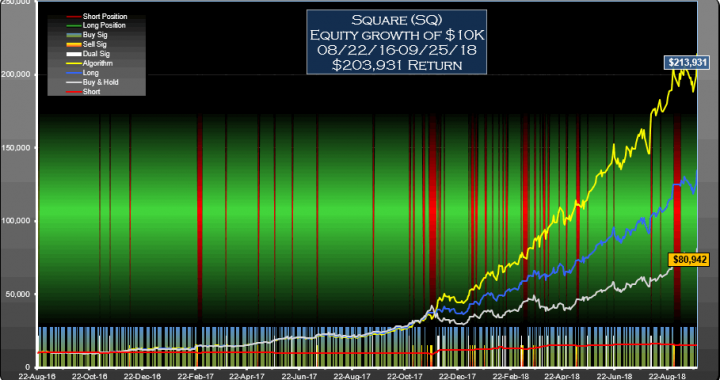
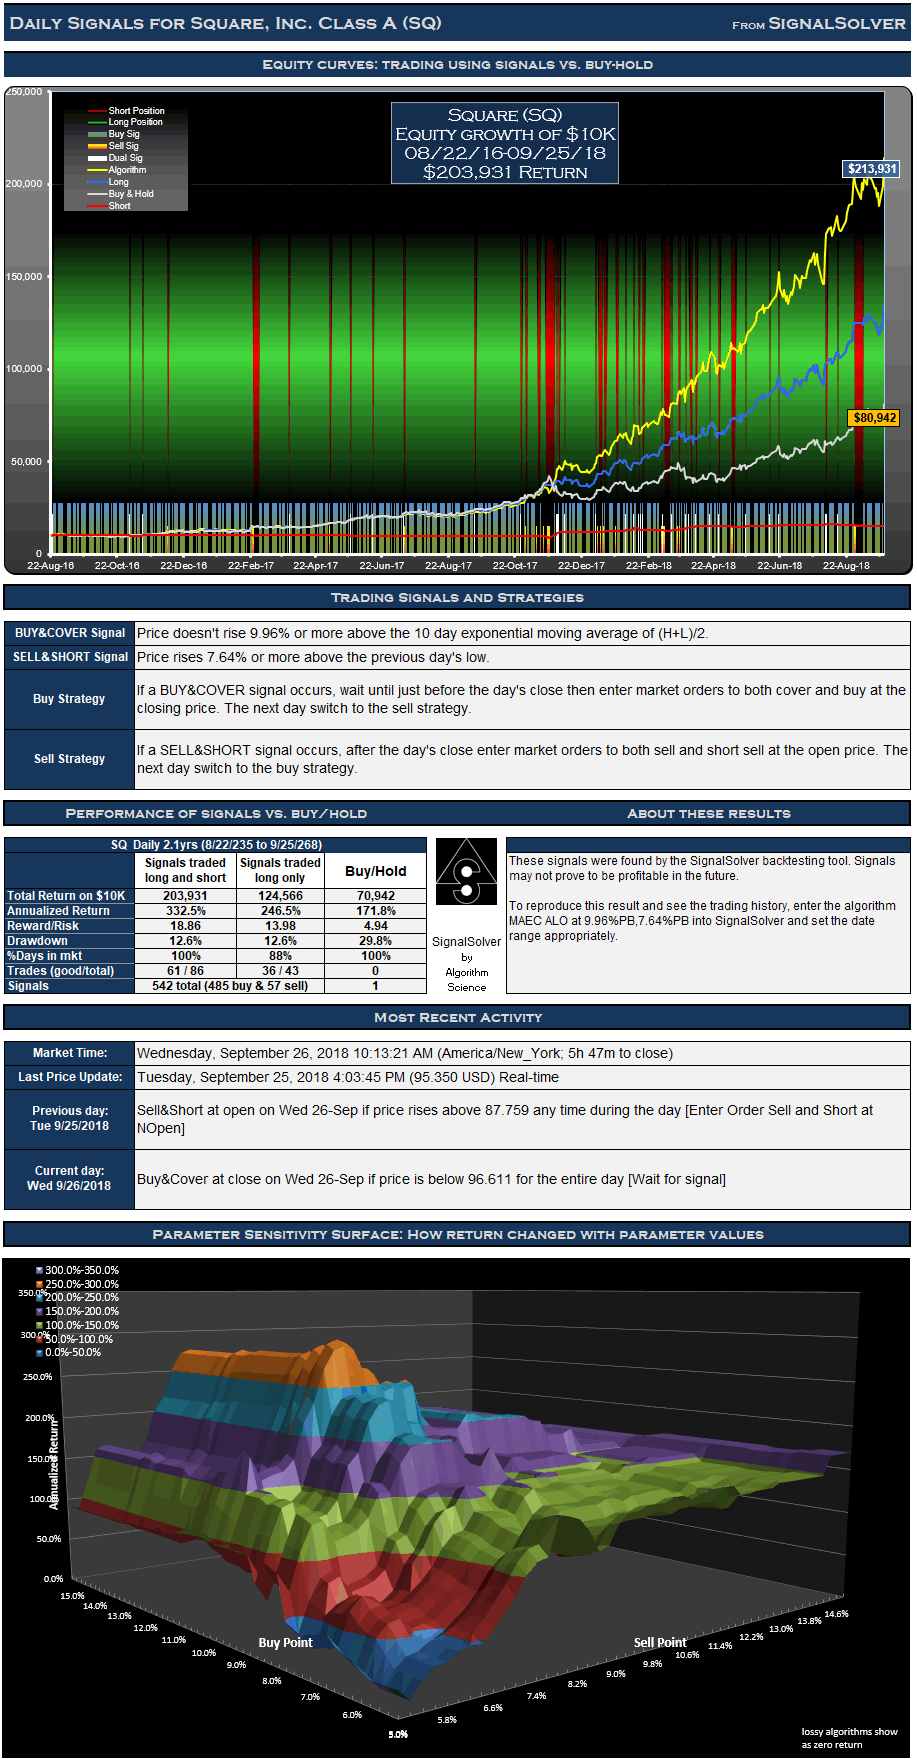
For the 528 day (2.1 year) period from Aug 22 2016 to Sep 25 2018, these signals for Square (SQ) traded both long and short would have yielded $203,931 in profits from a $10,000 initial investment, an annualized return of 332.5%. Traded long only (no short selling) the signals would have returned $124,566, an annualized return of 246.5%. 87.6% of time was spent holding stock long. The return would have been $70,942 (an annualized return of 171.8%) if you had bought and held the stock for the same period.

Signals and Trades

Not all signals are acted upon and signals are often reinforced in this type of strategy. If you are long in the security, buy signals are not acted on, for example. Similarly if you are short you must ignore sell signals. There were 485 buy signals and 57 sell signals for this particular SQ strategy .These led to 43 round trip long trades of which 36 were profitable, and 43 short trades of which 25 were profitable. This is a daily strategy; daily OHLC data is used to derive all signals and there is at most one buy and sell signal and one trade per day.

Drawdown and Reward/Risk

Drawdown (the worst case loss for an single entry and exit into the strategy) was 13% for long-short and 13% for long only. This compares to 30% for buy-hold. The reward/risk for the trading long and short was 18.86 compared to 4.94 for buy-hold, a factor of 3.8 improvement. If traded long only, the reward/risk was 13.98. We use drawdown plus 5% as our risk metric, and annualized return as the reward metric.

The backtests assume a commission per trade of $7.

Click here to see the list of Trades

Day of signal Buy or Sell Price L&S Value Next Open
8/22/2016 Buy 11.78 10,484
8/23/2016 Sell 12.40 10,512
8/24/2016 Buy 12.16 10,719
11/2/2016 Sell 11.69 10,274
11/3/2016 Buy 11.99 9,971
11/14/2016 Sell 12.32 10,258
11/15/2016 Buy 12.03 10,459
12/7/2016 Sell 14.12 12,293
12/8/2016 Buy 13.94 12,471
2/23/2017 Sell 16.95 15,106
3/1/2017 Buy 17.22 14,835
3/28/2017 Sell 17.22 14,838
3/29/2017 Buy 17.22 14,850
5/4/2017 Sell 19.75 16,988
5/5/2017 Buy 19.78 16,905
5/23/2017 Sell 21.64 18,528
5/24/2017 Buy 21.92 18,316
6/13/2017 Sell 23.59 19,652
6/14/2017 Buy 23.47 19,444
7/11/2017 Sell 25.61 21,524
7/13/2017 Buy 25.98 21,240
9/14/2017 Sell 28.23 23,021
9/15/2017 Buy 28.50 22,859
10/26/2017 Sell 34.69 27,722
10/27/2017 Buy 35.20 27,766
10/31/2017 Sell 37.48 29,055
11/2/2017 Buy 36.07 30,267
11/10/2017 Sell 39.13 32,676
11/14/2017 Buy 39.74 33,293
11/17/2017 Sell 44.99 36,386
11/27/2017 Buy 41.02 38,493
11/28/2017 Sell 43.20 41,673
11/29/2017 Buy 39.13 45,748
11/30/2017 Sell 39.34 45,815
12/1/2017 Buy 38.22 47,340
12/6/2017 Sell 39.33 48,454
12/7/2017 Buy 38.73 50,290
1/3/2018 Sell 38.30 48,613
1/4/2018 Buy 38.10 49,224
1/5/2018 Sell 41.00 52,557
1/10/2018 Buy 40.84 52,994
1/11/2018 Sell 42.37 54,710
1/12/2018 Buy 41.25 56,006
1/22/2018 Sell 45.06 61,314
1/24/2018 Buy 44.32 63,024
1/31/2018 Sell 45.75 64,303
2/1/2018 Buy 44.45 65,298
2/7/2018 Sell 42.85 63,723
2/8/2018 Buy 39.50 69,508
2/12/2018 Sell 39.85 69,285
2/13/2018 Buy 42.11 64,876
2/15/2018 Sell 44.03 68,307
2/16/2018 Buy 44.11 68,864
3/5/2018 Sell 49.55 76,562
3/6/2018 Buy 49.60 75,083
3/7/2018 Sell 50.72 78,183
3/13/2018 Buy 51.83 78,479
3/14/2018 Sell 55.10 81,268
3/15/2018 Buy 54.84 81,161
3/20/2018 Sell 57.81 86,045
3/22/2018 Buy 55.16 88,181
3/27/2018 Sell 50.40 82,197
3/28/2018 Buy 47.39 87,937
3/29/2018 Sell 48.88 89,816
4/2/2018 Buy 47.68 93,975
4/5/2018 Sell 47.50 91,646
4/6/2018 Buy 45.87 95,314
4/18/2018 Sell 51.13 105,631
4/19/2018 Buy 50.63 107,198
4/26/2018 Sell 48.00 101,096
4/27/2018 Buy 47.57 102,266
5/8/2018 Sell 53.15 113,937
5/11/2018 Buy 54.73 111,182
5/21/2018 Sell 56.40 113,895
5/22/2018 Buy 54.63 116,466
6/12/2018 Sell 62.25 133,824
6/13/2018 Buy 62.50 134,765
6/20/2018 Sell 68.78 146,650
6/21/2018 Buy 67.10 152,613
8/2/2018 Sell 72.10 161,397
8/3/2018 Buy 68.36 172,860
8/13/2018 Sell 73.67 182,928
8/14/2018 Buy 74.97 178,535
8/29/2018 Sell 85.72 205,437
9/6/2018 Buy 88.54 196,690
9/25/2018 Sell 95.35 213,931
9/26/2018 Last 95.35 213,931


TQQQ Signals Equity

TQQQ Signals-Daily

These TQQQ signals would have performed around 6.6 times better than buy-hold with an ROI of 1530% for the period 18-Aug-16 to 21-Sep-18

TQQQ Signals

The trading signals for TQQQ were selected for their reward/risk and parameter sensitivity characteristics. Backtests don't always generate reliable signals which can be counted on moving forward but many traders find value in knowing what buy and sell signals would have worked well in the past.

Returns for the TQQQ signals

For the 528 day (2.1 year) period from Aug 18 2016 to Sep 21 2018, these signals for TQQQ traded both long and short would have yielded $152,973 in profits from a $10,000 initial investment, an annualized return of 279.8%. Traded long only (no short selling) the signals would have returned $66,873, an annualized return of 165.1%. 82.8% of time was spent holding stock long. The return would have been $23,205 (an annualized return of 77.5%) if you had bought and held the stock for the same period.

Signals and Trades

Not all signals are acted upon and signals are often reinforced in this type of strategy. If you are long in the security, buy signals are not acted on, for example. Similarly if you are short you must ignore sell signals. There were 293 buy signals and 21 sell signals for this particular TQQQ strategy .These led to 21 round trip long trades of which 18 were profitable, and 20 short trades of which 17 were profitable. This is a daily strategy; daily OHLC data is used to derive all signals and there is at most one buy and sell signal and one trade per day.

Drawdown and Reward/Risk

Drawdown (the worst case loss for an single entry and exit into the strategy) was 20% for long-short and 20% for long only. This compares to 31% for buy-hold. The reward/risk for the trading long and short was 11.11 compared to 2.14 for buy-hold, a factor of 5.2 improvement. If traded long only, the reward/risk was 6.56. We use drawdown plus 5% as our risk metric, and annualized return as the reward metric.

The backtests assume a commission per trade of $7. Returns have been adjusted for the worst case effects of 8 dividends.

TQQQ Signals Daily-List of trades

Day Buy/Sell Price
9/17/2018 Buy $68.62
9/14/2018 Sell $69.79
9/7/2018 Buy $65.36
8/28/2018 Sell $70.32
6/26/2018 Buy $57.73
6/21/2018 Sell $63.78
5/2/2018 Buy $49.65
4/27/2018 Sell $50.83
4/25/2018 Buy $45.89
4/18/2018 Sell $52.80
3/26/2018 Buy $49.67
2/27/2018 Sell $58.75
2/7/2018 Buy $51.02
1/24/2018 Sell $59.67
12/20/2017 Buy $48.62
12/19/2017 Sell $48.69
11/20/2017 Buy $44.81
11/17/2017 Sell $45.30
11/13/2017 Buy $44.11
10/30/2017 Sell $42.45
8/18/2017 Buy $35.06
8/15/2017 Sell $37.25
8/11/2017 Buy $35.03
7/20/2017 Sell $37.54
7/14/2017 Buy $35.46
7/13/2017 Sell $34.95
6/21/2017 Buy $34.29
6/20/2017 Sell $34.79
4/26/2017 Buy $31.22
4/25/2017 Sell $30.82
2/1/2017 Buy $25.03
1/26/2017 Sell $25.15
11/9/2016 Buy $19.74
11/8/2016 Sell $20.00
10/26/2016 Buy $21.22
10/25/2016 Sell $21.87
10/20/2016 Buy $20.85
10/19/2016 Sell $20.90
9/26/2016 Buy $20.91
9/23/2016 Sell $21.60
8/22/2016 Buy $20.60

Update Oct 20th 2019


In the subsequent 57 weeks since this initial posting, this algorithm has increased by 79%, an annual percentage rate of 72% compared with a 6.6% loss for the underlying TQQQ.
Drawdown was 26% compared with 56% for TQQQ so the risk-reward was 15 times better than TQQQ short-hold. 31 signals, 9 trades, 5 of them good. Return on 10K was $7909.
Optimum parameters have moved slightly, now 4.11% and 10.55%, but the above metrics are for the original parameters.

YANG Signals Daily Equity

YANG Signals-Daily

These YANG signals traded as directed would have performed around 56.3 times better than short-hold with an ROI of 3,547% for the period 18-Aug-16 to 21-Sep-18

YANG Signals Daily

The trading signals for YANG were selected from over a million backtest results for their reward/risk and parameter sensitivity characteristics. Backtests don't always generate reliable signals which can be counted on moving forward but many traders find value in knowing what buy and sell signals would have worked well in the past.

Returns for the YANG signals

For the 528 day (2.1 year) period from Aug 18 2016 to Sep 21 2018, these signals for YANG traded both long and short would have yielded $354,655 in profits from a $10,000 initial investment, an annualized return of 458.1%. Traded long only (no short selling) the signals would have returned $34,367, an annualized return of 103.9%. 25.9% of time was spent holding stock long. The return would have been $6,305 (an annualized return of 26.3%) if you had short sold the stock for the same period.

Signals and Trades

Not all signals are acted upon and signals are often reinforced in this type of strategy. If you are long in the security, buy signals are not acted on, for example. Similarly if you are short you must ignore sell signals. There were 149 buy signals and 217 sell signals for this particular YANG strategy. In turn, these led to 20 round trip long trades of which 19 were profitable, and 21 short trades of which 20 were profitable. This is a daily strategy, meaning that daily OHLC data is used to derive all signals and there is at most one buy and sell signal and one trade per day.

Drawdown and Reward/Risk

Drawdown (the worst case loss for an single entry and exit into the strategy) was 22% for long-short and 13% for long only. This compares to 80% drawdown for buy-hold and 28% drawdown for short-hold. The reward/risk for the trading long and short was 17.14 compared to 0.80 for short and hold, a factor of 21.5 improvement. If traded long only, the reward/risk was 5.74. We use drawdown plus 5% as our risk metric, and annualized return as the reward metric.

The backtests assume a commission per trade of $7.

YINN Signals Daily Equity

Direxion Daily FTSE China Bull (YINN) Signals-Daily

The Direxion Daily FTSE China Bull (YINN) signals shown below and traded as directed would have performed around 88.5 times better than buy-hold with an ROI of 3,159% for the period 17-Aug-16 to 20-Sep-18

YINN Signals Daily

The trading signals for Direxion Daily FTSE China Bull (YINN) were selected for their reward/risk and parameter sensitivity characteristics. Backtests don't always generate reliable signals which can be counted on moving forward but many traders find value in knowing what buy and sell signals would have worked well in the past.

Returns for the Direxion Daily FTSE China Bull (YINN) signals

For the 528 day (2.1 year) period from Aug 17 2016 to Sep 20 2018, these signals for Direxion Daily FTSE China Bull (YINN) traded both long and short would have yielded $315,911 in profits from a $10,000 initial investment, an annualized return of 428.9%. Traded long only (no short selling) the signals would have returned $69,290, an annualized return of 169.1%. 59.6% of time was spent holding stock long. The return would have been $3,568 (an annualized return of 15.7%) if you had bought and held the stock for the same period.

Signals and Trades

Not all signals are acted upon and signals are often reinforced in this type of strategy. If you are long in the security, buy signals are not acted on, for example. Similarly if you are short you must ignore sell signals. There were 126 buy signals and 83 sell signals for this particular YINN strategy .These led to 43 round trip long trades of which 27 were profitable, and 43 short trades of which 30 were profitable. This is a daily strategy; daily OHLC data is used to derive all signals and there is at most one buy and sell signal and one trade per day.

Drawdown and Reward/Risk

Drawdown (the worst case loss for an single entry and exit into the strategy) was 19% for long-short and 21% for long only. This compares to 63% for buy-hold. The reward/risk for the trading long and short was 18.17 compared to 0.23 for buy-hold, a factor of 78.7 improvement. If traded long only, the reward/risk was 6.44. We use drawdown plus 5% as our risk metric, and annualized return as the reward metric.

The backtests assume a commission per trade of $7.

GLD Signals Equity

SPDR Gold Trust (GLD) Signals-Daily

These SPDR Gold Trust (GLD) signals traded as directed would have performed around 7.9 times better than short-hold with an ROI of 86% for the period 17-Aug-16 to 20-Sep-18

GLD Signals

The SPDR Gold Trust (GLD) signals shown above were selected for their reward/risk and parameter sensitivity characteristics. Backtests don't always generate reliable signals which can be counted on moving forward but many traders find value in knowing what buy and sell signals would have worked well in the past.

Returns for the SPDR Gold Trust (GLD) signals

For the 528 day (2.1 year) period from Aug 17 2016 to Sep 20 2018, these signals for SPDR Gold Trust (GLD) traded both long and short would have yielded $8,617 in profits from a $10,000 initial investment, an annualized return of 34.6%. Traded long only (no short selling) the signals would have returned $3,130, an annualized return of 13.9%. 41.5% of time was spent holding stock long. The return would have been $1,084 (an annualized return of 5.3%) if you had shorted the stock for the same period.

Signals and Trades

Not all signals are acted upon and signals are often reinforced in this type of strategy. If you are long in the security, buy signals are not acted on, for example. Similarly if you are short you must ignore sell signals. There were 35 buy signals and 47 sell signals for this particular GLD strategy. These led to 14 round trip long trades of which 8 were profitable, and 15 short trades of which 12 were profitable. Daily OHLC data is used to derive all signals and there is at most one buy and sell signal and one trade per day.

Drawdown and Reward/Risk

Drawdown (the worst case loss for an single entry and exit into the strategy) was 7% for long-short and 7% for long only. This compares to 17% for buy-hold. The reward/risk for the trading long and short was 3.01 compared to 0.25 for short-hold, a factor of 12.2 improvement. If traded long only, the reward/risk was 1.15. We use drawdown plus 5% as our risk metric, and annualized return as the reward metric.

The backtests assume a commission per trade of $7.

SPY Signals Equity

SPDR S&P 500 (SPY) Signals-Daily

These SPDR S&P 500 (SPY) signals traded as directed would have performed around 2.5 times better than buy-hold with an ROI of 98% for the period 16-Aug-16 to 19-Sep-18

SPDR S&P 500 (SPY) Signals

The SPDR S&P 500 (SPY) signals were selected from over a million backtest results for their reward/risk and parameter sensitivity characteristics. Backtests don't always generate reliable signals which can be counted on moving forward but many traders find value in knowing what buy and sell signals would have worked well in the past.

Returns for the SPDR S&P 500 (SPY) signals

For the 528 day (2.1 year) period from Aug 16 2016 to Sep 19 2018, these signals for SPDR S&P 500 (SPY) traded both long and short would have yielded $9,780 in profits from a $10,000 initial investment, an annualized return of 38.6%. Traded long only (no short selling) the signals would have returned $6,906, an annualized return of 28.5%. 87.7% of time was spent holding stock long. The return would have been $3,914 (an annualized return of 17.1%) if you had bought and held the stock for the same period.

Signals and Trades

Not all signals are acted upon and signals are often reinforced in this type of strategy. If you are long in the security, buy signals are not acted on, for example. Similarly if you are short you must ignore sell signals. There were 25 buy signals and 32 sell signals for this particular SPY strategy .These led to 9 round trip long trades of which 8 were profitable, and 8 short trades of which 7 were profitable. This is a daily strategy--daily OHLC data is used to derive all signals and there is at most one buy and sell signal and one trade per day.

Drawdown and Reward/Risk

Drawdown (the worst case loss for an single entry and exit into the strategy) was 4% for long-short and 4% for long only. This compares to 10% for buy-hold. The reward/risk for the trading long and short was 4.33 compared to 1.15 for buy-hold, a factor of 3.8 improvement. If traded long only, the reward/risk was 3.21. We use drawdown plus 5% as our risk metric, and annualized return as the reward metric.

The backtests assume a commission per trade of $7. Returns have been adjusted for the worst case effects of 8 dividends.

Microsoft (MSFT) Signals Equity

Microsoft (MSFT) Signals-Daily

These Microsoft (MSFT) signals traded as directed would have performed around 3.4 times better than buy-hold with an ROI of 350% for the period 16-Aug-16 to 19-Sep-18

Microsoft (MSFT) Signals

The above trading signals for Microsoft (MSFT) were selected from over a million backtest results for their reward/risk and parameter sensitivity characteristics. Backtests don't always generate reliable signals which can be counted on moving forward but many traders find value in knowing what buy and sell signals would have worked well in the past.

Returns for the Microsoft (MSFT) signals

For the 528 day (2.1 year) period from Aug 16 2016 to Sep 19 2018, these signals for Microsoft (MSFT) traded both long and short would have yielded $34,970 in profits from a $10,000 initial investment, an annualized return of 105.2%. Traded long only (no short selling) the signals would have returned $20,123, an annualized return of 69.4%. 66.3% of time was spent holding stock long. The return would have been $10,335 (an annualized return of 40.4%) if you had bought and held the stock for the same period.

Signals and Trades

Not all signals are acted upon and signals are often reinforced in this type of strategy. If you are long in the security, buy signals are not acted on, for example. Similarly if you are short you must ignore sell signals. There were 375 buy signals and 87 sell signals for this particular MSFT strategy .These led to 61 round trip long trades of which 50 were profitable, and 60 short trades of which 38 were profitable. This is a daily strategy; daily OHLC data is used to derive all signals and there is at most one buy and sell signal and one trade per day.

Drawdown and Reward/Risk

Drawdown (the worst case loss for an single entry and exit into the strategy) was 7% for long-short and 5% for long only. This compares to 9% for buy-hold. The reward/risk for the trading long and short was 9.02 compared to 2.80 for buy-hold, a factor of 3.2 improvement. If traded long only, the reward/risk was 7.18. We use drawdown plus 5% as our risk metric, and annualized return as the reward metric.

The backtests assume a commission per trade of $7.

Micron (MU) Signals Equity

Micron (MU) Signals-Daily

These Micron (MU) signals traded as directed would have performed around 7.3 times better than buy-hold with an ROI of 1379% for the period 16-Aug-16 to 19-Sep-18

MU Trading Signals Daily

The Micron (MU) signals were selected from over a million backtest results for their reward/risk and parameter sensitivity characteristics. Backtests don't always generate reliable signals which can be counted on moving forward but many traders find value in knowing what buy and sell signals would have worked well in the past.

Returns for the Micron (MU) Signals

For the 528 day (2.1 year) period from Aug 16 2016 to Sep 19 2018, these signals for Micron (MU) traded both long and short would have yielded $137,905 in profits from a $10,000 initial investment, an annualized return of 262.5%. Traded long only (no short selling) the signals would have returned $55,659, an annualized return of 145.9%. 63.6% of time was spent holding stock long. The return would have been $18,979 (an annualized return of 66.3%) if you had bought and held the stock for the same period.

Signals and Trades

Not all signals are acted upon and signals are often reinforced in this type of strategy. If you are long in the security, buy signals are not acted on, for example. Similarly if you are short you must ignore sell signals. There were 282 buy signals and 252 sell signals for this particular MU strategy .These led to 116 round trip long trades of which 70 were profitable, and 117 short trades of which 71 were profitable. This is a daily strategy; daily OHLC data is used to derive all signals and there is at most one buy and sell signal and one trade per day.

Drawdown and Reward/Risk

Drawdown (the worst case loss for an single entry and exit into the strategy) was 15% for long-short and 18% for long only. This compares to 35% for buy-hold. The reward/risk for the trading long and short was 13.29 vs. 1.65 for buy-hold, an improvement factor of around 8.1 If traded long only, the reward/risk was 6.34. We use drawdown plus 5% as our risk metric, and annualized return as the reward metric.

The backtests assume a commission per trade of $7.

NFLX Signals Daily Equity

Netflix (NFLX) Signals-Daily

These Netflix (NFLX) signals traded as directed would have performed around 4.6 times better than buy-hold with an ROI of 1291% for the period 15-Aug-16 to 18-Sep-18

NFLX Signals Daily

These trading signals for NFLX were selected from over a million backtest results for their reward/risk and parameter sensitivity characteristics. Backtests don't always generate reliable signals which can be counted on moving forward but many traders find value in knowing what buy and sell signals would have worked well in the past.

Returns

For the 528 day (2.1 year) period from Aug 15 2016 to Sep 18 2018, these signals for Netflix (NFLX) traded both long and short would have yielded $129,107 in profits from a $10,000 initial investment, an annualized return of 252.1%. Traded long only (no short selling) the signals would have returned $64,042, an annualized return of 160.4%. 79.4% of time was spent holding stock long. The return would have been $27,969 (an annualized return of 89.2%) if you had bought and held the stock for the same period.

Signals and Trades

Not all signals are acted upon and signals are often reinforced in this type of strategy. If you are long in the security, buy signals are not acted on, for example. Similarly if you are short you must ignore sell signals. There were 65 buy signals and 36 sell signals for this particular NFLX strategy .These led to 22 round trip long trades of which 15 were profitable, and 21 short trades of which 18 were profitable. This is a daily strategy; daily OHLC data is used to derive all signals and there is at most one buy and sell signal and one trade per day.

Drawdown and Reward/Risk

Drawdown (the worst case loss for an single entry and exit into the strategy) was 15% for long-short and 14% for long only. This compares to 25% for buy-hold. The reward/risk for the trading long and short was 12.36 vs. 2.94 for buy-hold, an improvement factor of around 4.2 If traded long only, the reward/risk was 8.44. We use drawdown plus 5% as our risk metric, and annualized return as the reward metric.

The backtests assume a commission per trade of $7.

DUST Signals Equity

Direxion Daily Gold Miners Bear 3X ETF (DUST) Signals-Daily

These Direxion Daily Gold Miners Bear 3X ETF (DUST) signals traded as directed would have performed around 117.8 times better than buy-hold with an ROI of 9504% for the period 11-Aug-16 to 14-Sep-18

DUST Signals Daily

These trading signals for DUST were selected from over a million backtest results for their reward/risk and parameter sensitivity characteristics. Backtests don't always generate reliable signals which can be counted on moving forward but many traders find value in knowing what buy and sell signals would have worked well in the past.

Returns

For the 528 day (2.1 year) period from Aug 11 2016 to Sep 14 2018, these signals for Direxion Daily Gold Miners Bear 3X ETF (DUST) traded both long and short would have yielded $950,426 in profits from a $10,000 initial investment, an annualized return of 786.7%. Traded long only (no short selling) the signals would have returned $151,215, an annualized return of 277.8%. 39.4% of time was spent holding stock long. The return would have been $8,065 (an annualized return of 32.7%) if you had bought and held the stock for the same period.

Signals and Trades

Not all signals are acted upon and signals are often reinforced in this type of strategy. If you are long in the security, buy signals are not acted on, for example. Similarly if you are short you must ignore sell signals. There were 111 buy signals and 46 sell signals for this particular DUST strategy .These led to 26 round trip long trades of which 22 were profitable, and 26 short trades of which 19 were profitable. This is a daily strategy; daily OHLC data is used to derive all signals and there is at most one buy and sell signal and one trade per day.

Drawdown and Reward/Risk

Drawdown (the worst case loss for an single entry and exit into the strategy) was 55% for long-short and 34% for long only. This compares to 73% for buy-hold. The reward/risk for the trading long and short was 13.03 vs. 0.42 for buy-hold, an improvement factor of around 31.0 If traded long only, the reward/risk was 7.21. We use drawdown plus 5% as our risk metric, and annualized return as the reward metric.

The backtests assume a commission per trade of $7.