TNA Trading Strategy

Another low drawdown trading strategy-TNA Direxion Daily Small Cap Bull 3X

In the same vein as yesterday's FAS analysis, here is a low drawdown trading strategy for TNA, with daily intervention. Prasad had asked me to search for low drawdown strategies for a few of the triple leveraged ETFs, this being one of them. As with FAS, the algorithm was found by optimizing the SignalSolver backtest engine for drawdown (100% weighting), with a min QA return weight of 50% thrown in to get rid of all the zero trades-zero return hits. Period of the analysis was 1.9 years.

Again, the result had a low time in the market (18%), low drawdown (4.9%) and an annualized return which, while modest (38%), was better than the underlying ETF.

Andrew

TNA.D


Update 8-26-15

As per the table below, you can see the drawdown has jumped up to 16.8%. On the positive side, the differential in performance of the algorithm vs. the underlying TNA stock has grown. 

TNA.D Update 8-26-15


Update 12-30-2015

This algorithm peaked close to the day of publication, and has not done well since then:

TNA-D Low Drawdown Update 12-30-15 Equity

TNA-D Low Drawdown Update 12-30-15

Update 10-20-2016

Slight improvement over last update:

TNA Trading System Update 10-20-2016

TNA Trading System Update 10-20-2016

FAS (daily)

FAS (Direxion Daily Financial Bull 3X ETF) trading strategy with low drawdown

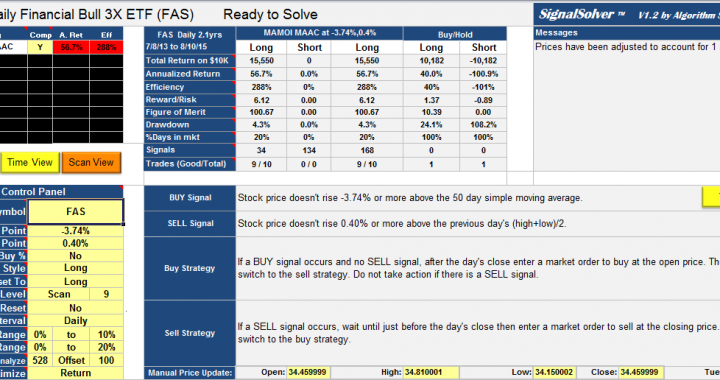
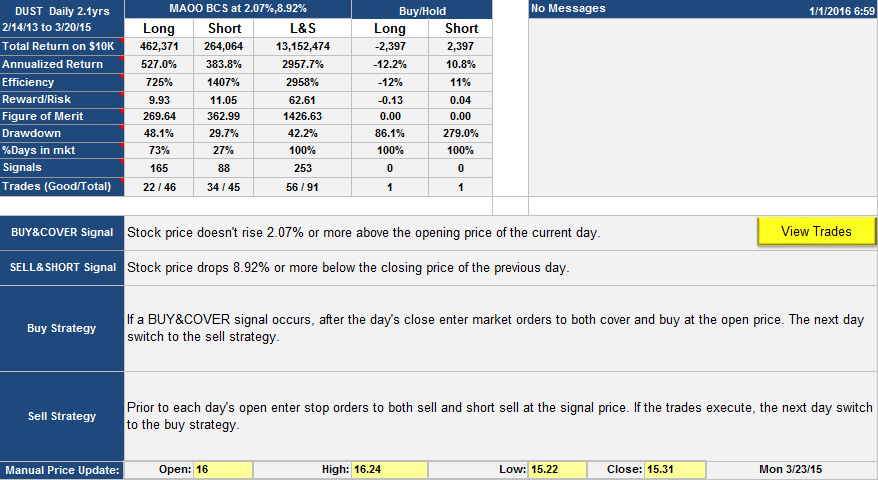
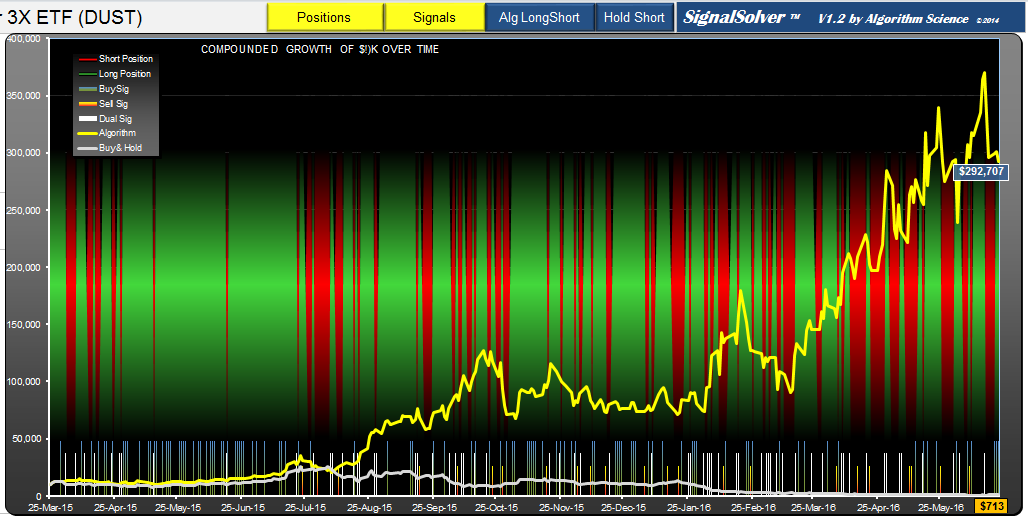
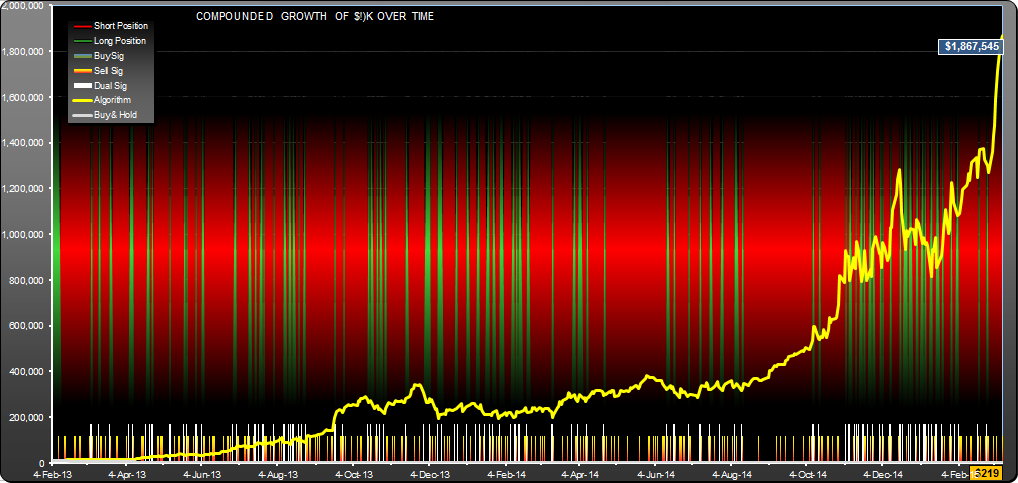
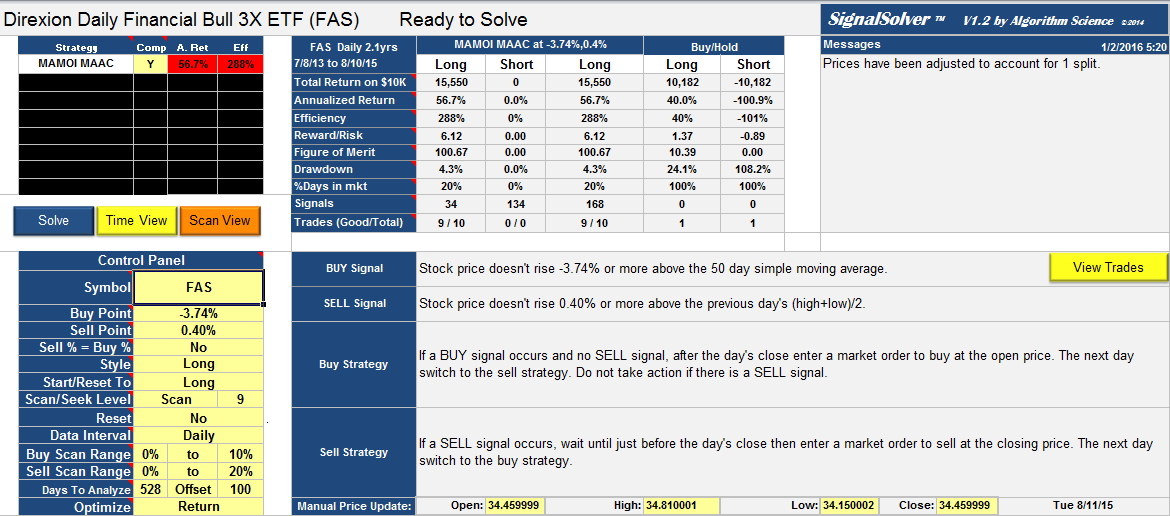
This is one of the triple leveraged funds which Prasad had asked me to come up with a low drawdown trading strategy for,  I'll be looking at the others soon. You can set up SignalSolver to optimize for low drawdown. The way you do that is by setting up the Figure of Merit parameters to look for low drawdown, however you need to fold return into the picture, otherwise it simply comes up with algorithms that don't trade and have zero drawdown. In this instance I set the FOM parameters to be Total Return (25%), drawdown (100%) and Min Quartus Return of (25%). The data is divided into four quartus's, so including Min Quartus Return gives more consistent returns than just including Total Return. 

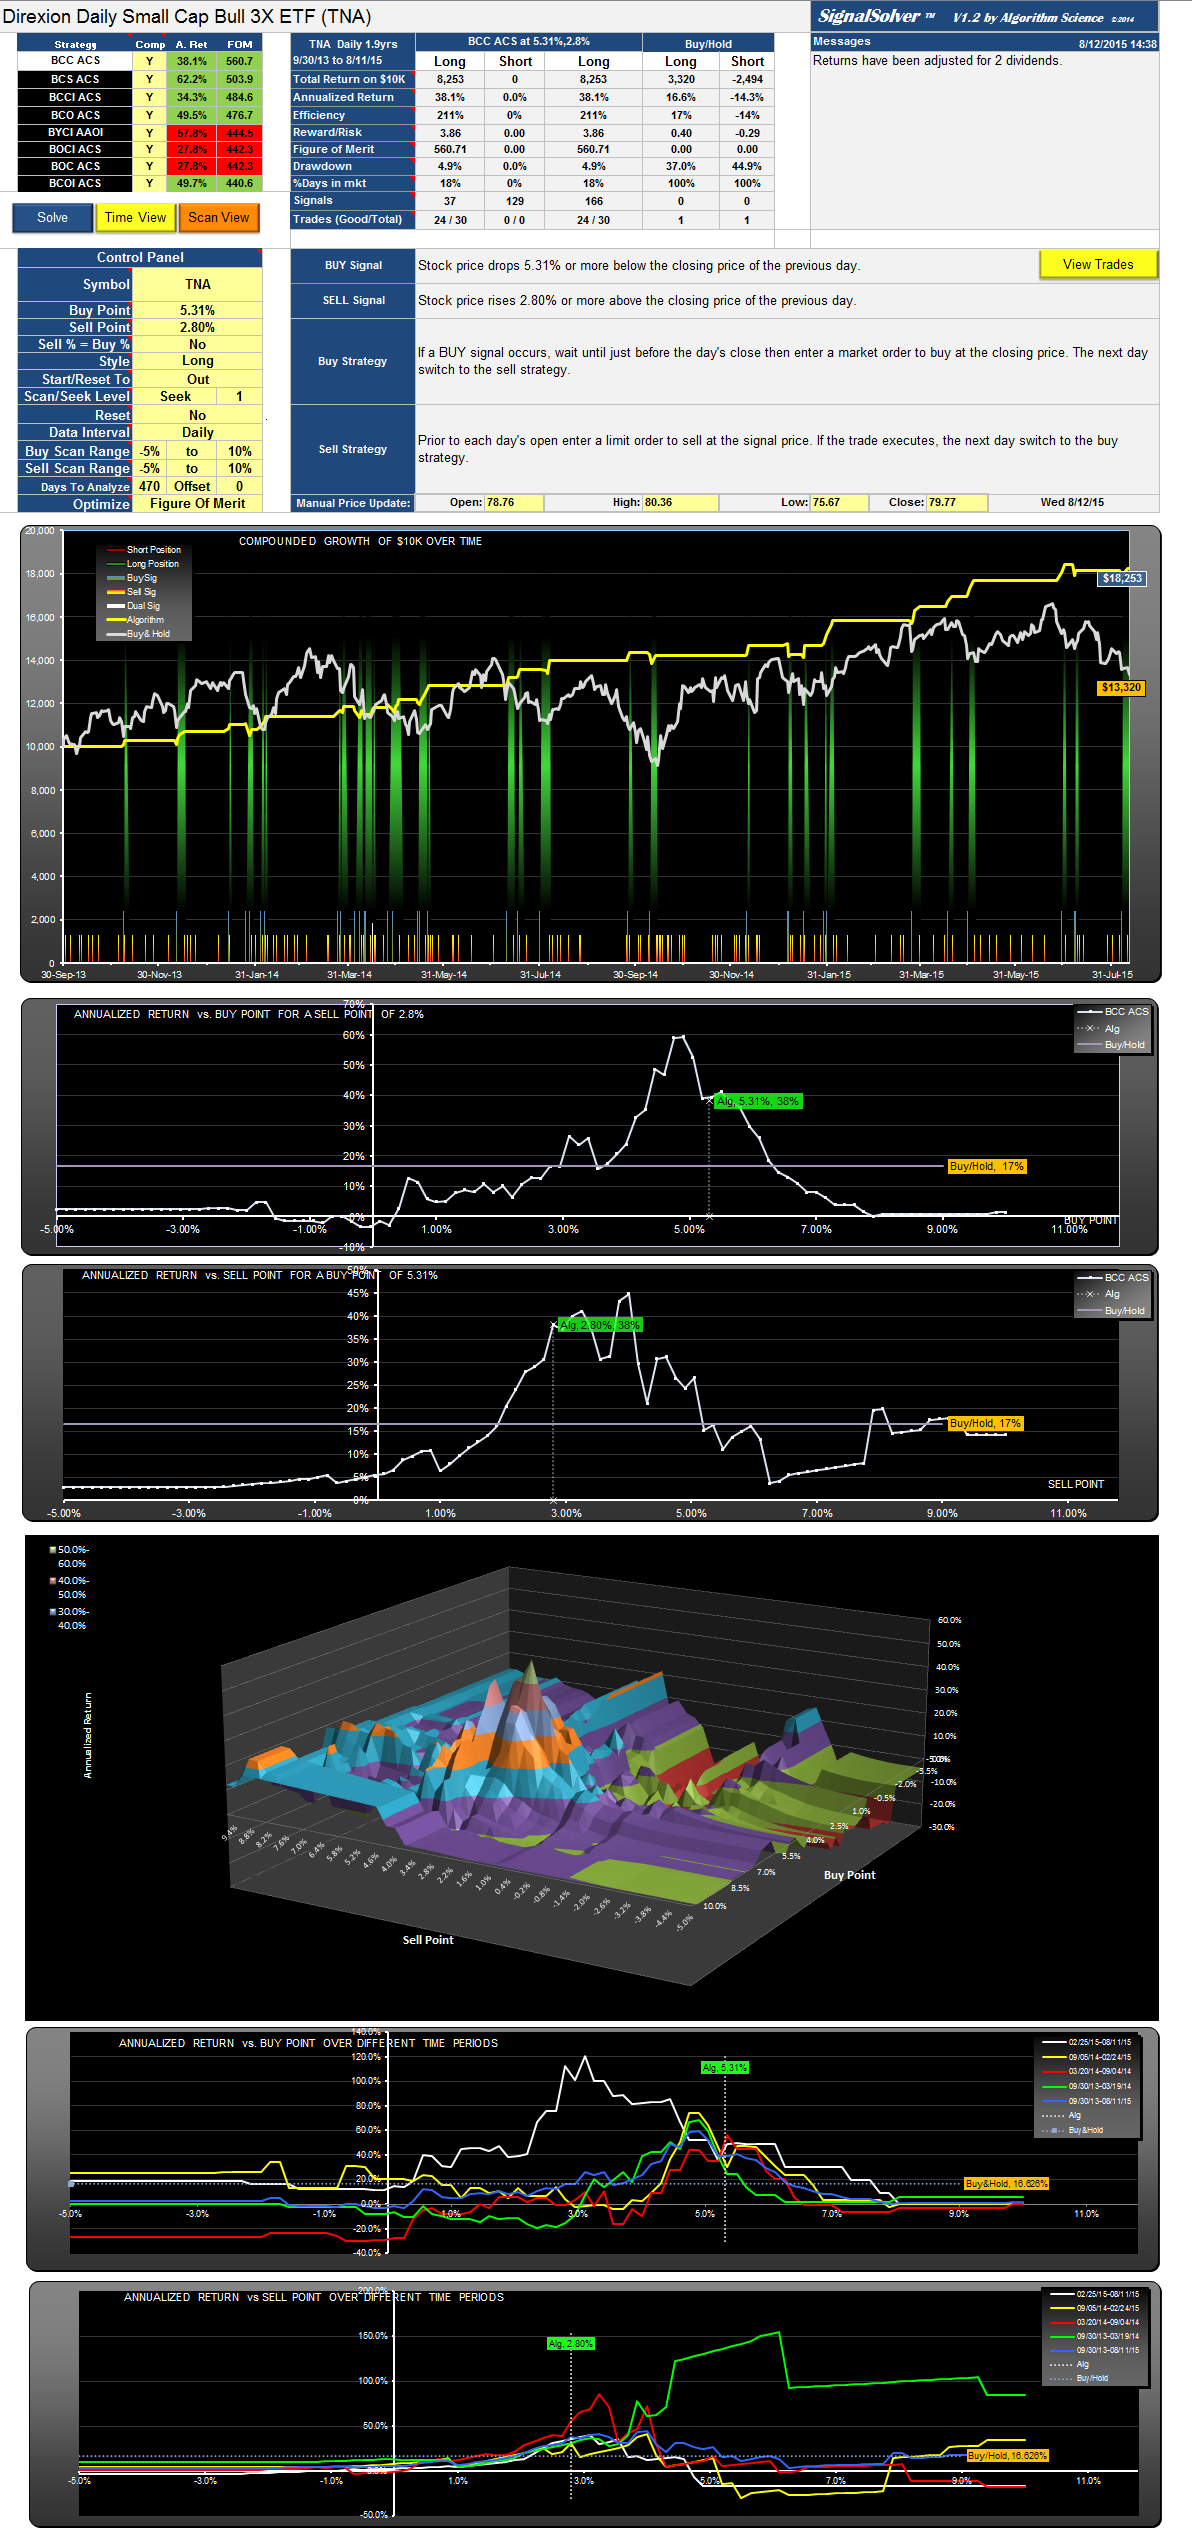
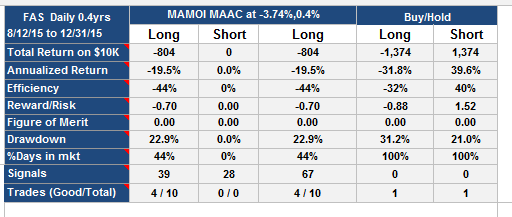
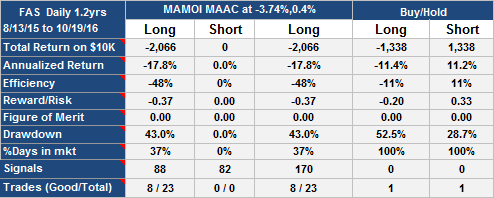
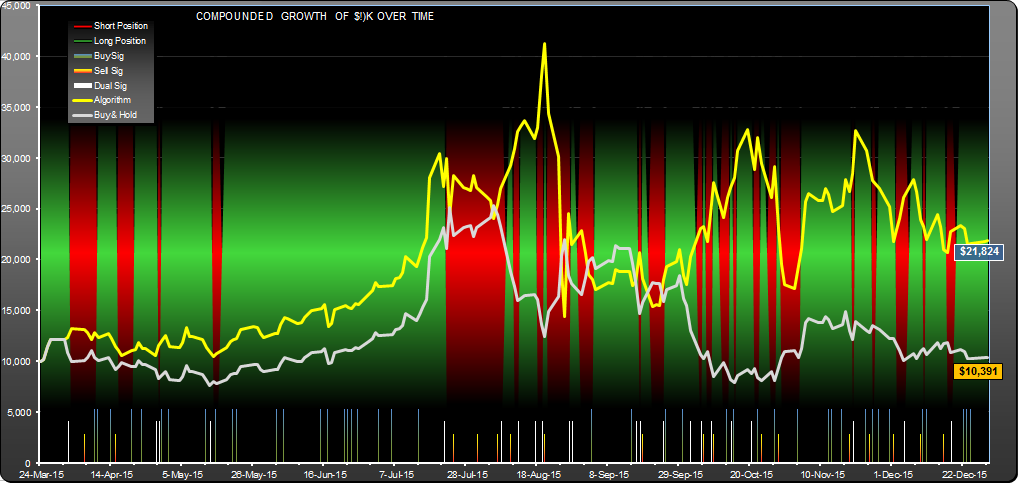
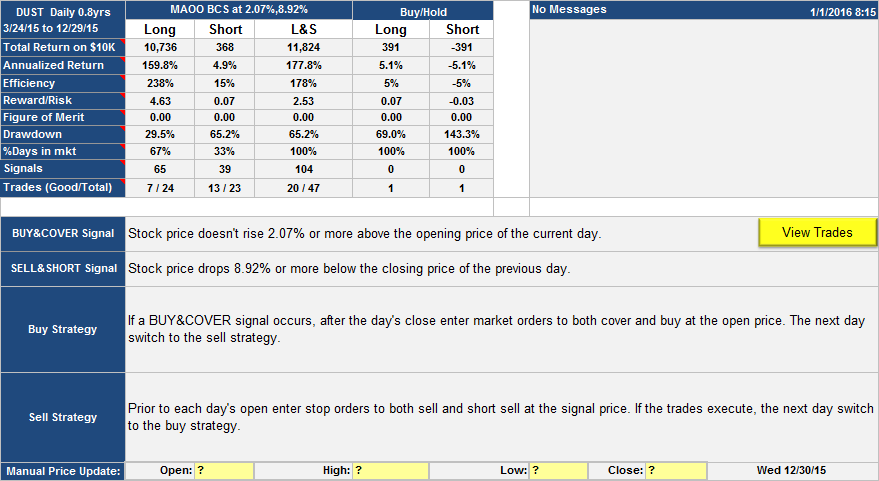
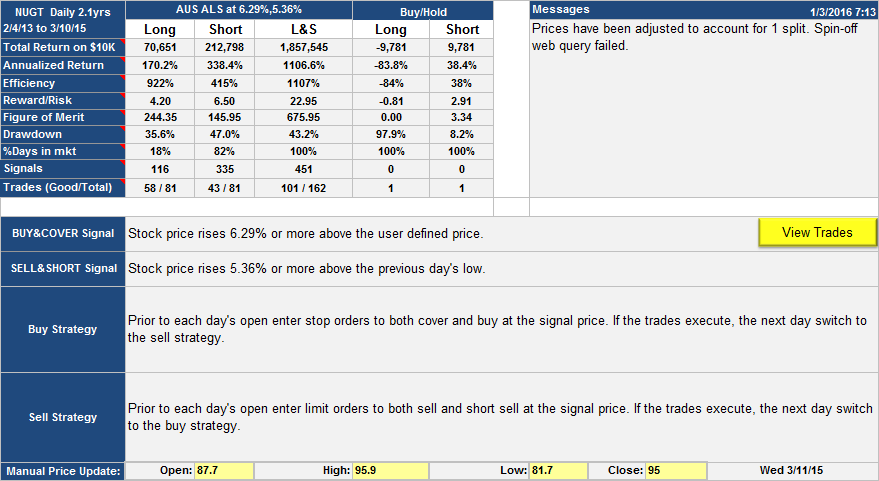
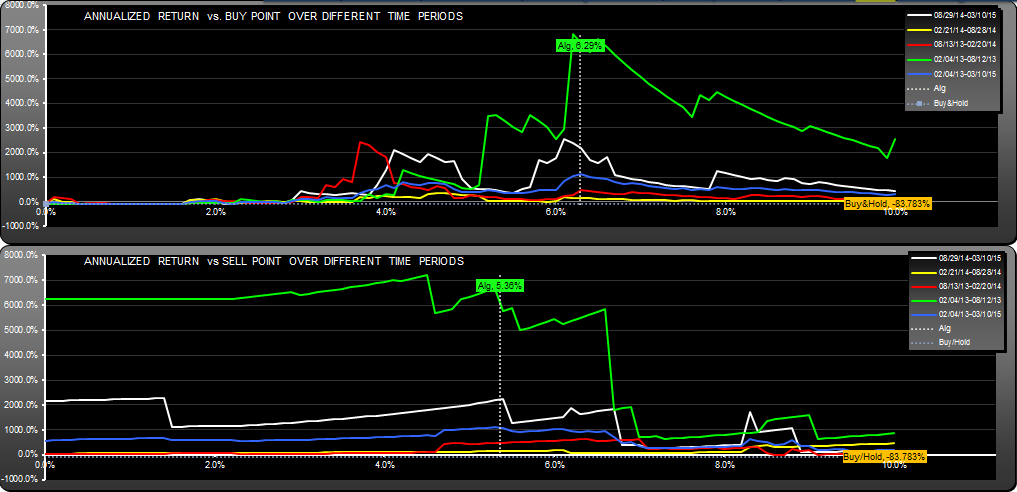
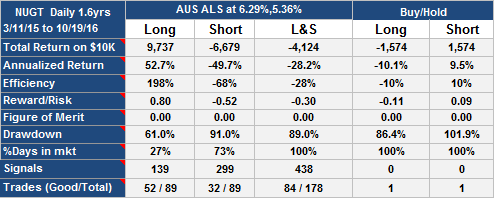
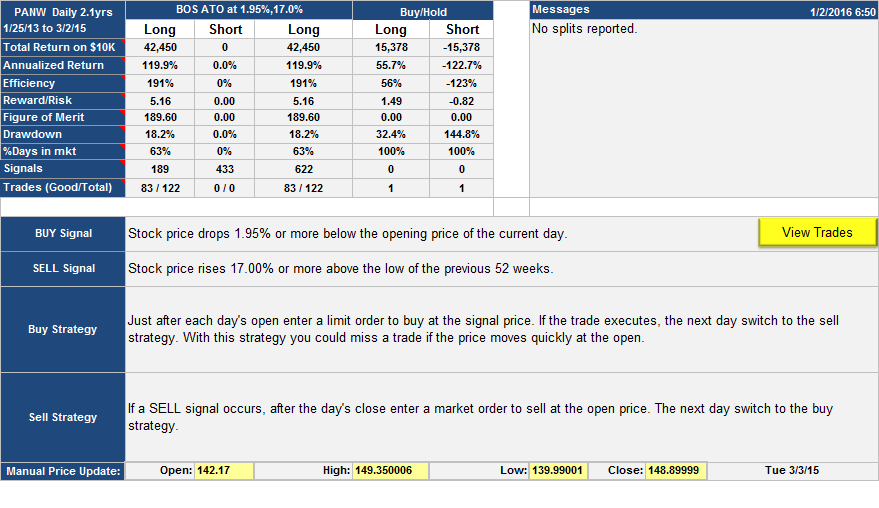
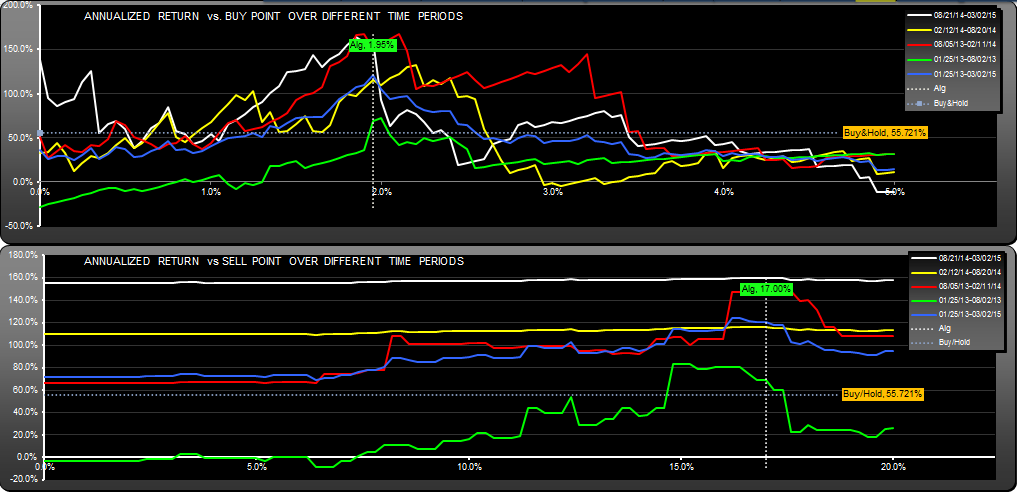
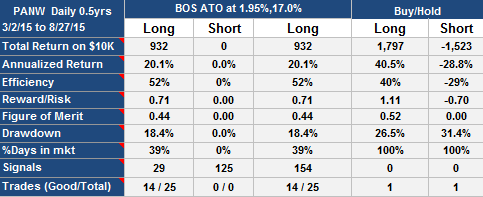
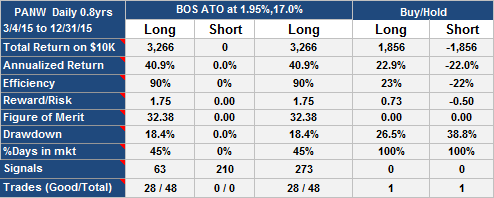
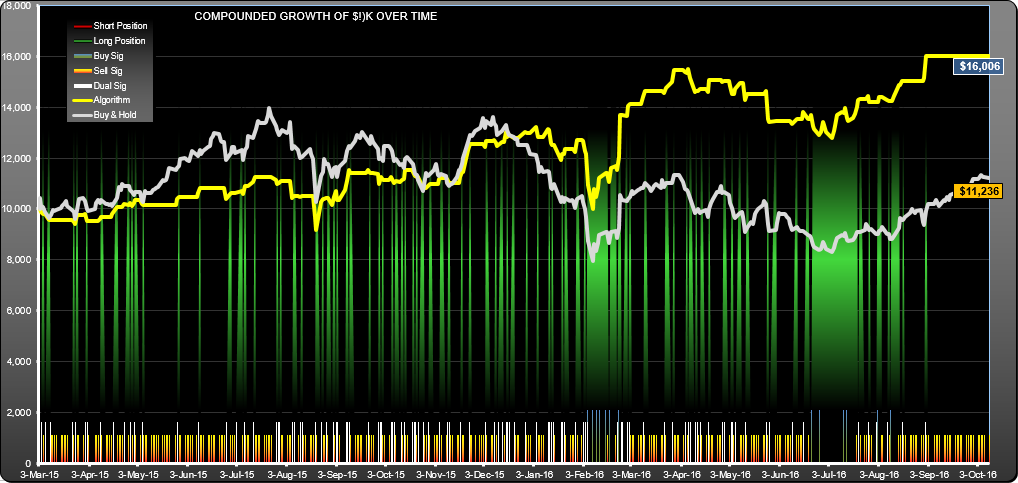
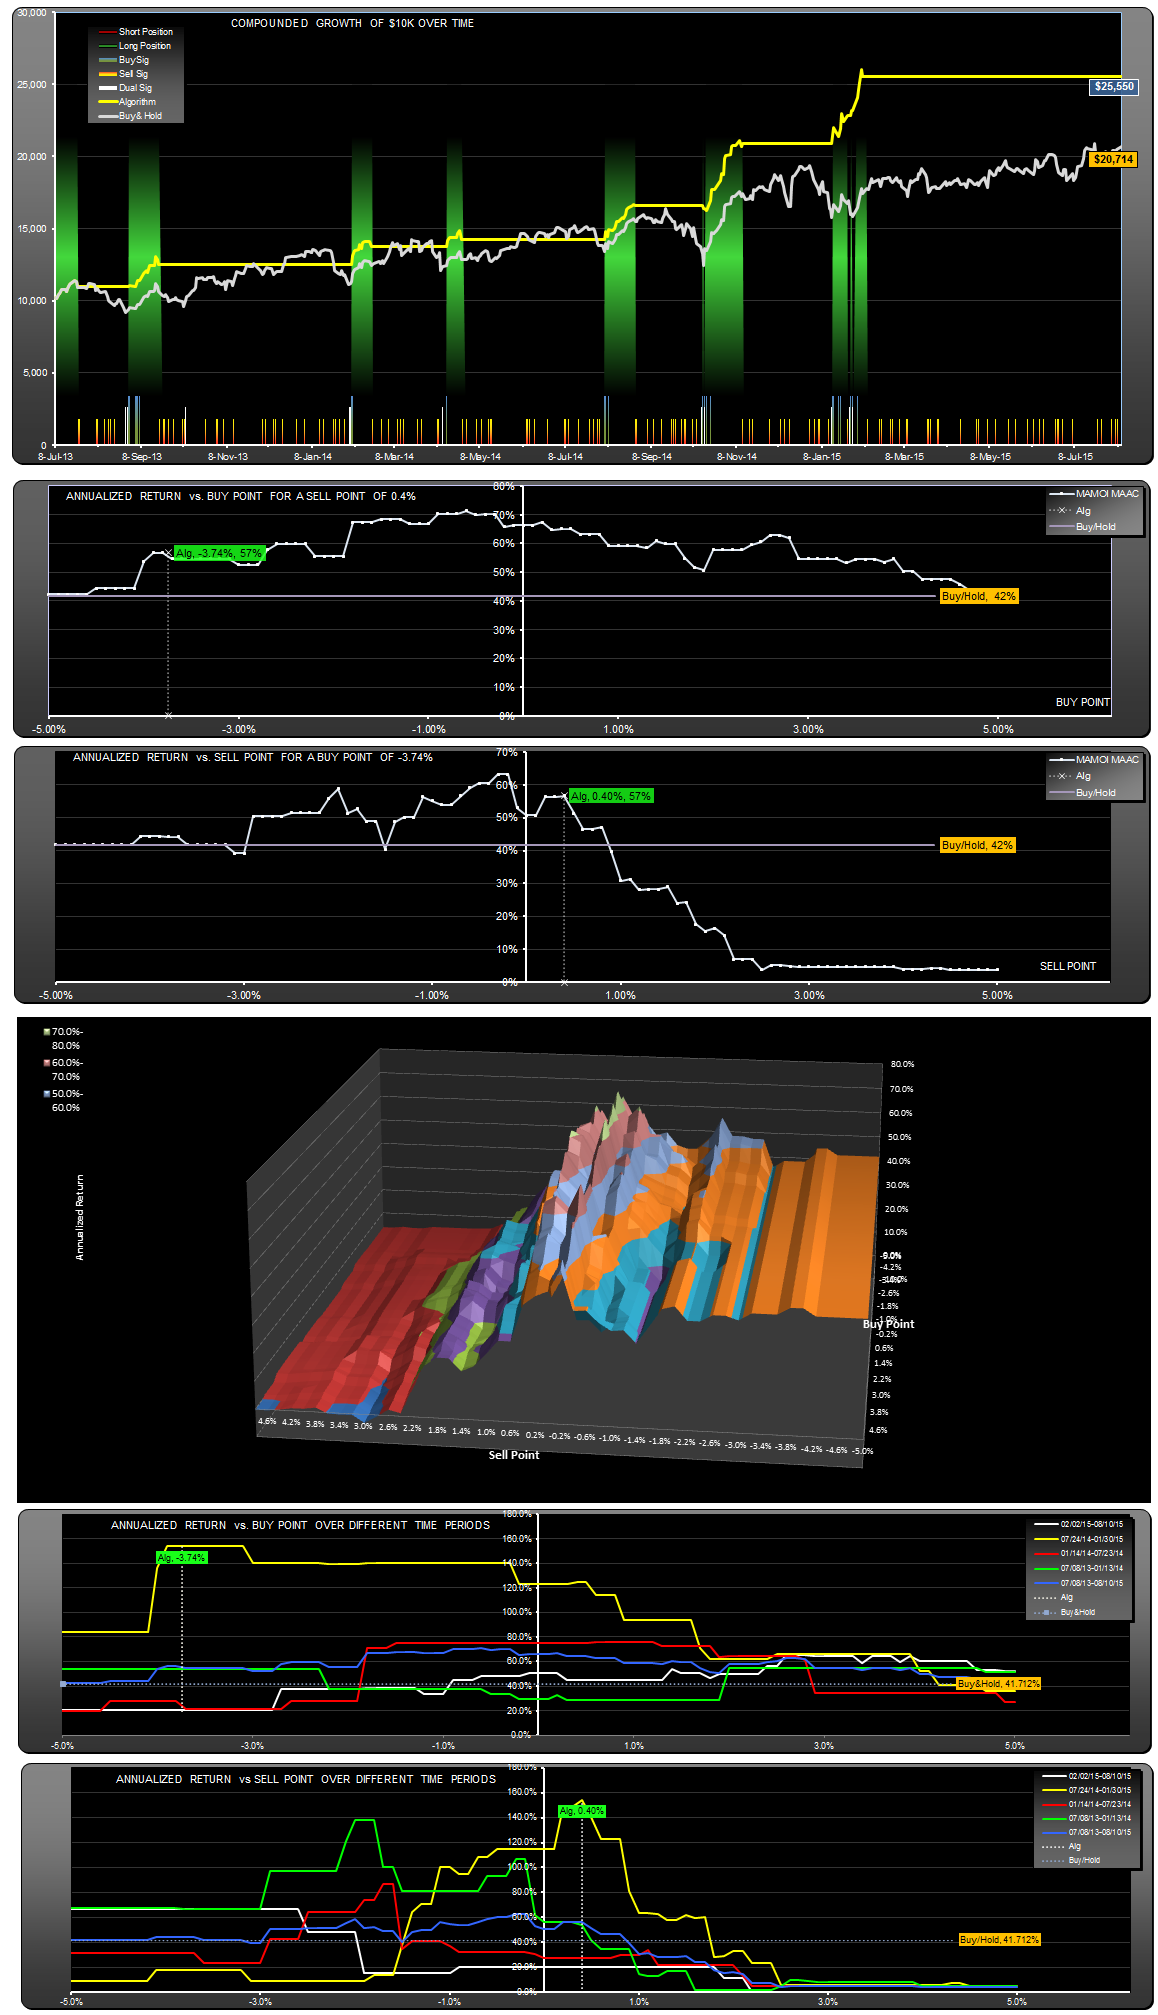
A few things to note about this result. The drawdown (the worst case loss you would have suffered if you had entered and exited the strategy once) was 4.5% compared with the underlying stock's drawdown of 24%, and the total return beat the return of the underlying stock (56.7% annualized vs. 41.7%).  Its a long-only strategy. If you had shorted instead of exiting, the drawdown was close to 30%. The trading strategy was also very efficient, that is, the returns were good given the small amount of time (20%) you were in the market. If you could have invested at the same rate of return during the 'out' periods, you would be talking about a 288% annualized return (a figure I call Efficiency).

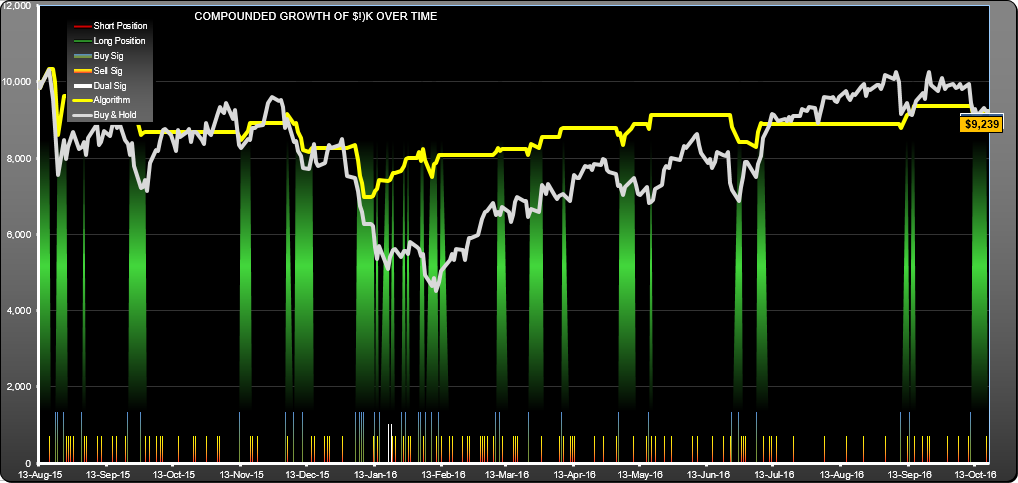
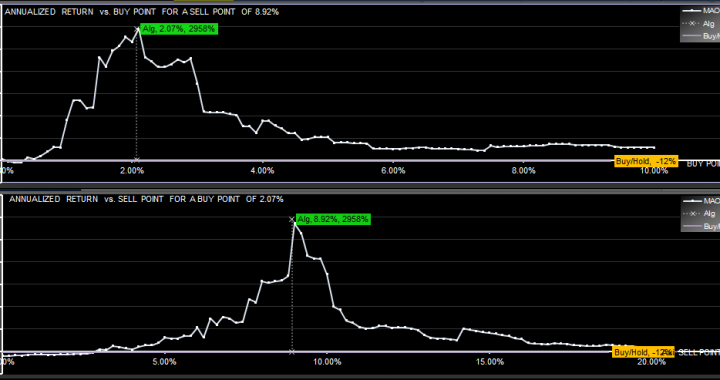
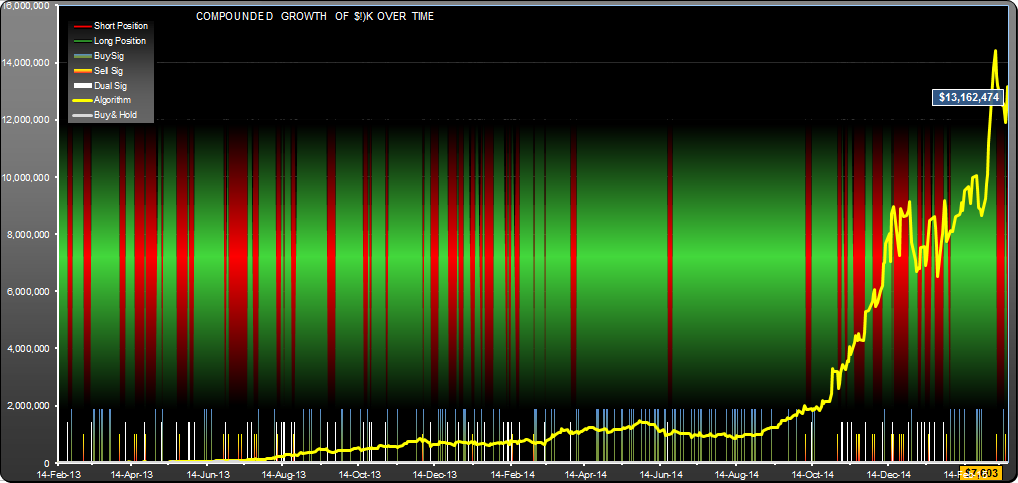
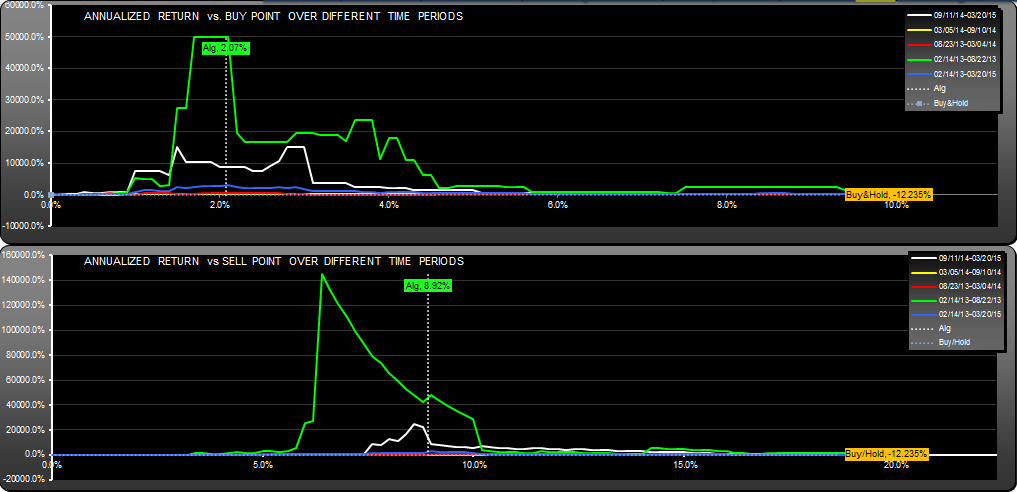
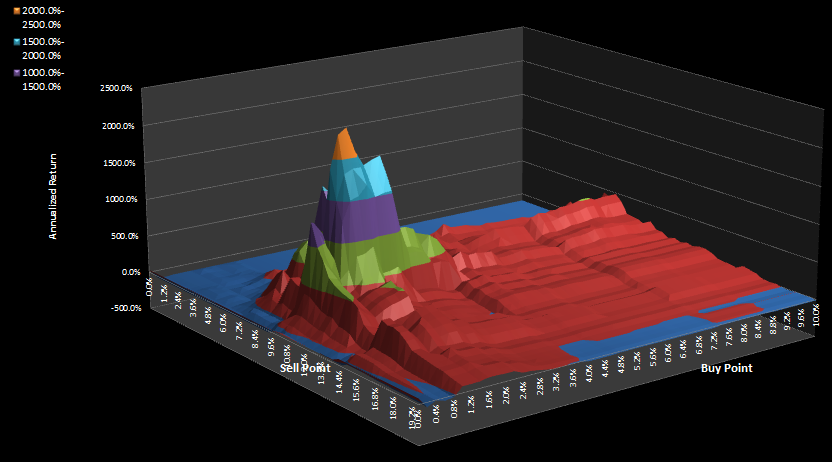
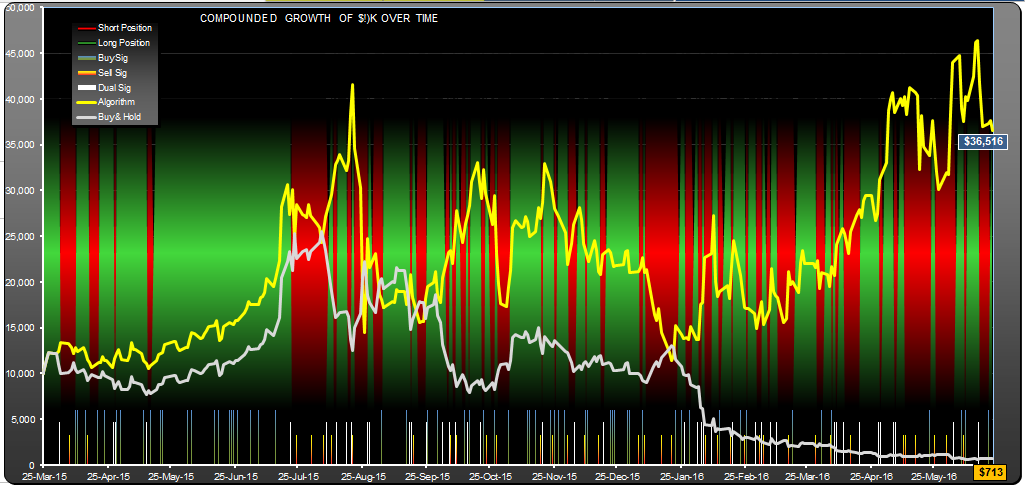
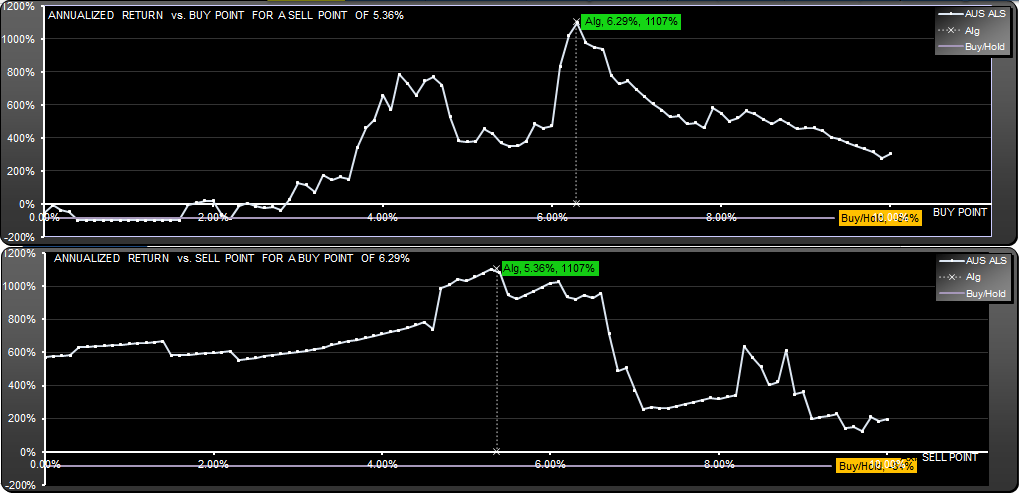
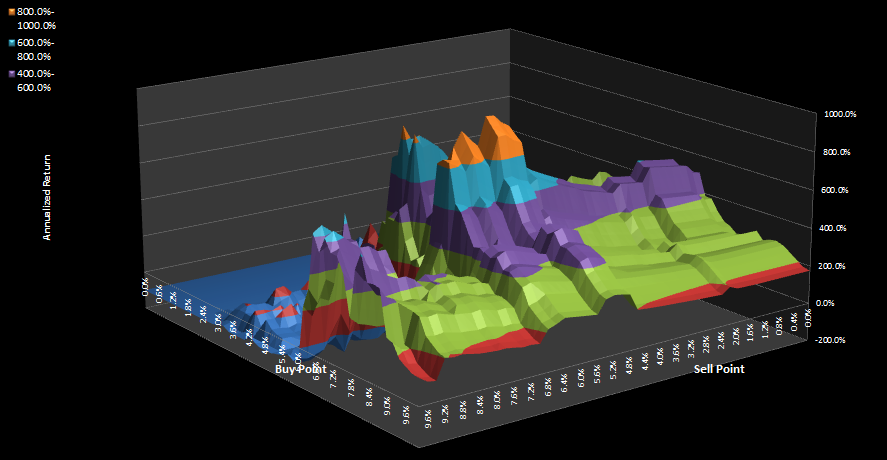
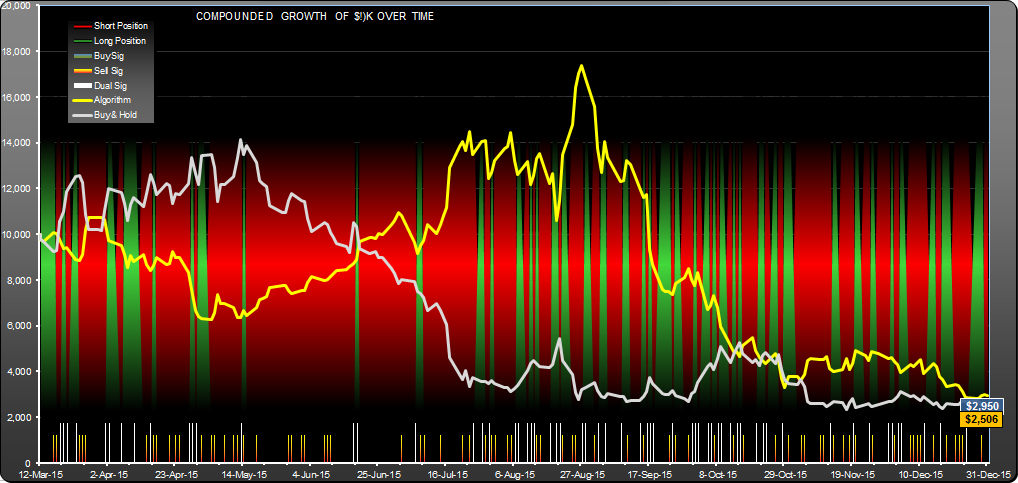
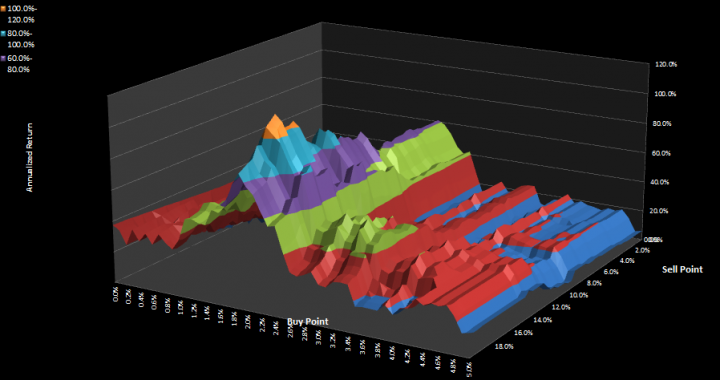
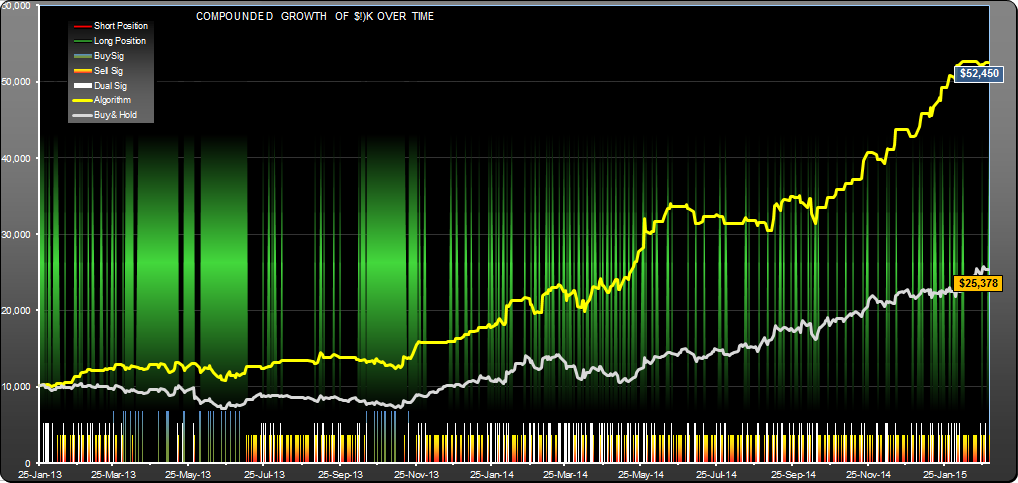
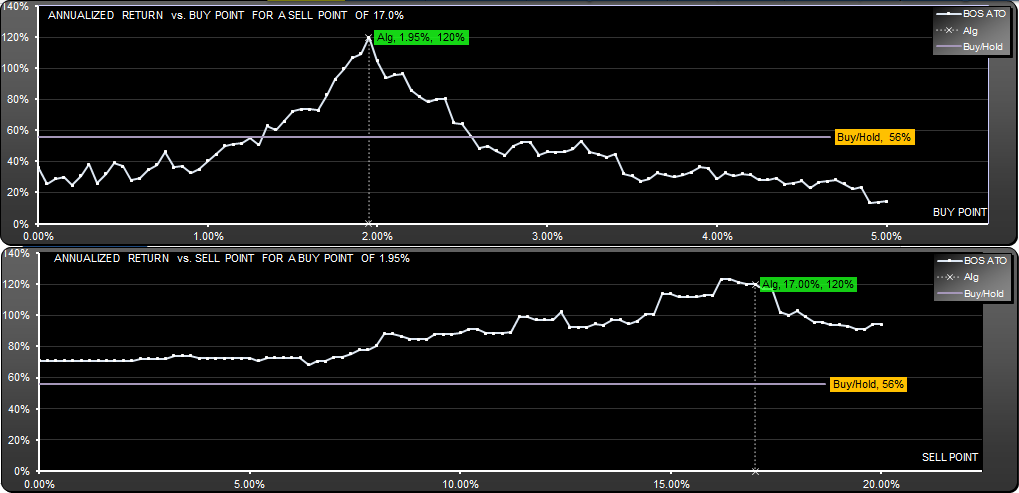
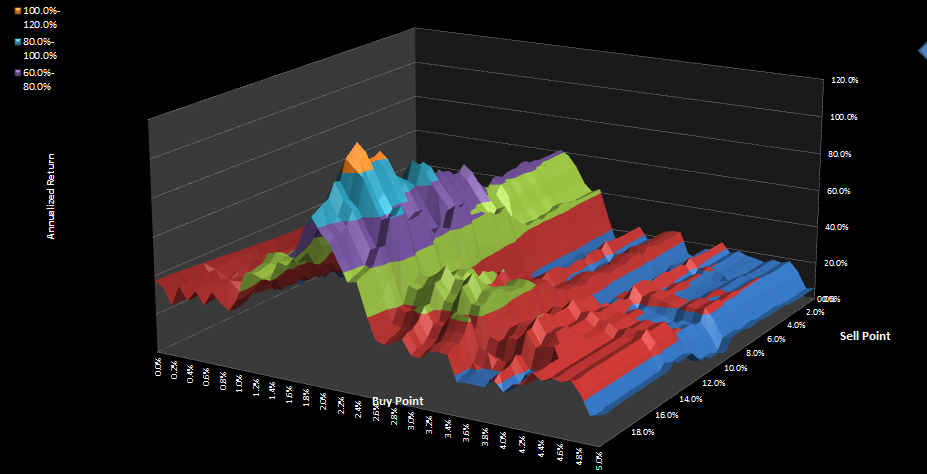
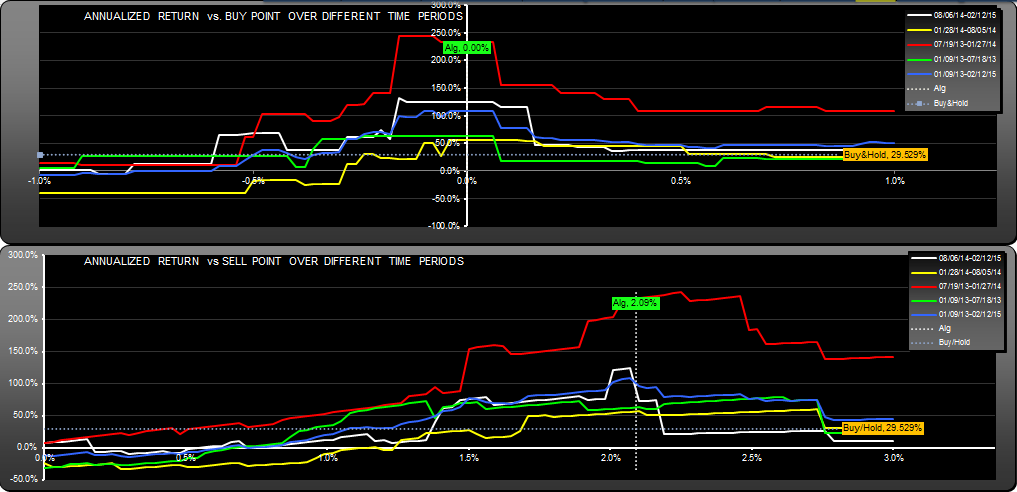
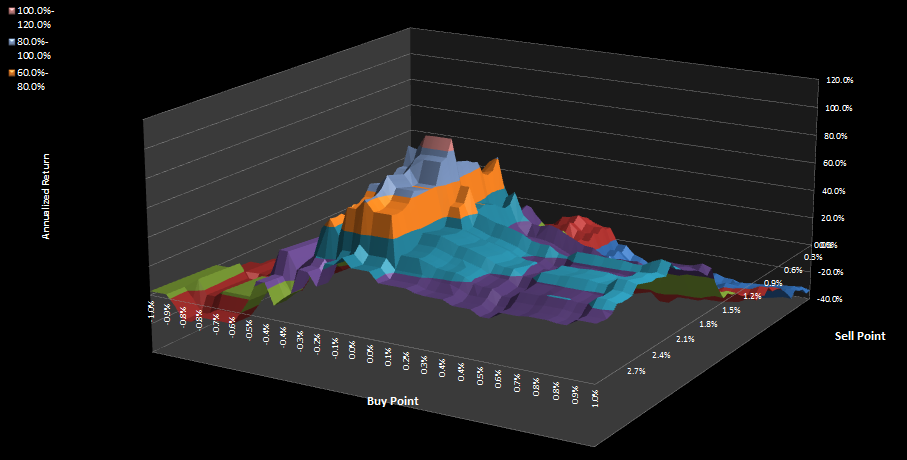
The trading strategy didn't trade frequently, nor was it particularly consistent in its results, as you can see from the last two graphs below. Also, its not particularly stable with respect to the buy and sell point percentages as you can see from the surface plot. None of these factors suggest a strategy worth pursuing--its really just a curiosity, a demonstration that you can find low drawdown strategies that worked if you look for them.  

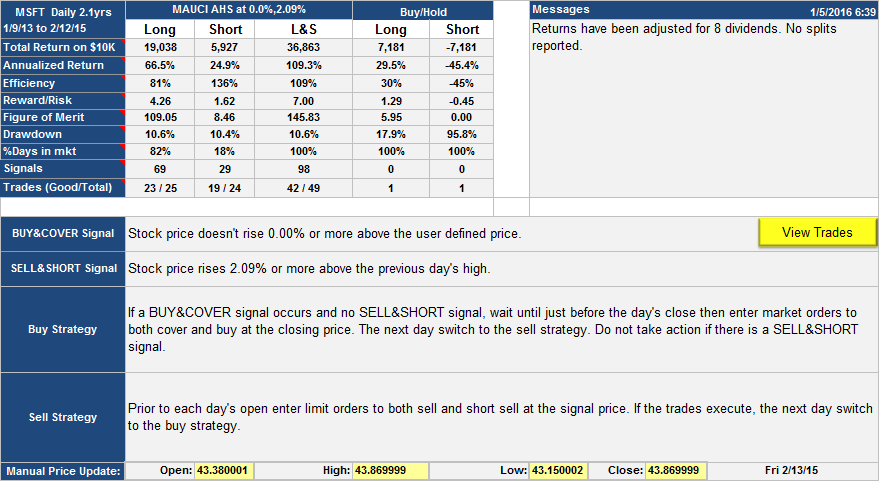
One last point of clarification, the buy signal is a negative percentage (-3.74%) with respect to the reference (the 50 day simple MA). If you were waiting for a buy signal and the 50 day SMA at the previous daily close was at $100, then the buy signal would occur if the stock price failed to rise above $96.26, assuming no sell signal. Buying was done at the subsequent open, selling at the close on the day of the sell signal.

Andrew

FAS-D 4.5 Corrected Table

FAS.D 4.5 DD Correction

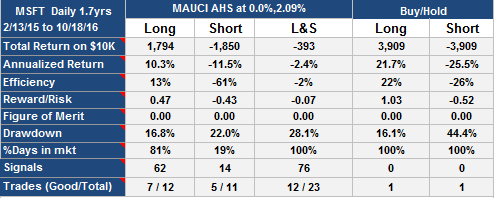
Post has been corrected 1-2-15 for an error in short-hold calculation.

Update 1-2-16

Low drawdown did not last, but did better than buy-hold:

FAS-D1-1-16 Update Table

Update 10-20-2016

FAS Trading Strategy (Daily) Update 10-20-2016

FAS Trading Strategy (Daily) Update 10-20-2016

DUST Daily Trading Strategy

This trading strategy is for stock symbol DUST the Direxion Daily Gold Miners Bear 3X ETF. It is the complementary stock to NUGT which I analyzed last week. Its not hard to find strategies which would have exploited the intense volatility of this kind of security, if you have access to an optimizing backtester. The strategy presented here gave good returns and reward-risk. Most of the returns were in the period Feb 2013 to Nov 2013, in which period $10K would have turned into $750,000. By Nov 2014, the investment compounded would have been worth $5m and since then until now (Mar 2015) it would have turned into $13m (list of trades). It will be interesting to see if the growth continues. I wouldn't expect it to, given the inconsistent performance, but you never know. In contrast, buy and hold lost 20% over the same period.

The strategy itself can be read off from the table below, its a daily trading strategy which means that you would have had to attend to it on a daily basis. It would have taken a few minutes a day to work out the signals and enter the orders. Note that you would have to short the stock if you were long and a sell signal showed up. Using NUGT as the shorting vehicle would have given different results.

Just a reminder; don't expect to implement this kind of algorithm and get similar results. I'll be tracking it on paper and give updates, so watch this space.

This strategy was corrected 1/1/16 to account for an error in the short-side returns.


Update 1/1/16

This strategy did OK after publication. For the period 3/24/15 to 12/29/15 the equity and stats are shown below:


DUST-D Equity 1-1-16

DUST-D Table 1-1-16

The optimum buy and sell points for this period would have been 4.13% and 8.45% (returning $66,246).

Update 6/23/2016


Since the original posting in March 2016, this strategy has returned 183% annual return, but in an extremely choppy fashion:

DUST-D Update 6-23-16 TimeDUST-D Update 6-23-16 Table

The optimum buy point over this period was 4.12%, with a sell point of 8.32%. The results for this optimization are shown in the table below. Its odd how the optimum buy point was almost exactly twice that of the original optimization, not the first time I have seen this happen.

DUST-D Update 6-23-16 Table Opt

DUST-D Update 6-23-16 Time Opt

Update 10/20/2016


Performance has deteriorated somewhat:

DUST Trading Strategy (Daily) Update 10-20-2016

DUST Trading Strategy (Daily) Update 10-20-2016


NUGT Trading Strategy (Daily)

Original Post March 12th 2015

Please note, this post was corrected 1-3-16 to account for a short-side error in the original calculations. Apologies for this.

This NUGT trading strategy (Direxion Daily Gold Miners Bull 3X ETF) gave a theoretical $1.8 million profit for a $10K initial investment over 2.1 years. The trading strategy required once a day attention. Signals were triggered by rising prices on both the buy and sell side. The buy side reference was 1.0629 times the average of the previous day high, the previous day low and the current day open. You would need to calculate it every day after the open and then put in the buy and cover orders, if you were short. On a few occasions this meant buying at the open price, but usually there was time to get the stop orders in.

The sell side target was a bit simpler, 1.0536 times the previous days low. You could enter the sell and short limit orders after each close, if you were long.

There is a Bear version of this fund, the Direxion Daily Gold Miners Bear 3X ETF (DUST), however the results would have been different if you had used it for the short side.

Here is the list of trades.


Update 1-3-16

The algorithm peaked at the end of Aug 2015:

NUGT.D Equity 1-3-16

Update 10-20-2016

Since it peaked at the end of Aug 2015 the algorithm has not recovered:

NUGT Trading Strategy (Daily) Update 10-20-2016

NUGT Trading Strategy (Daily) Update 10-20-2016

PANW Trading Strategy (Daily Intervention)

This Palo Alto Networks PANW trading strategy would have given a 119% annualized return. Here, I chose to show only the long side of the algorithm because its more impressive than the short side (which only gave 27% annualized return). To appreciate the algorithm more, notice that the efficiency of the algorithm was close to 200%. Efficiency (as we define it) is the annualized return divided by the percentage of time you were in the market. Its the return you would have received if you had realized the same return all the time as you had got while you were in the market. The theory is that since you are not in the market all the time, you could have invested the money elsewhere.

Efficiency only applies to long or short style algorithms, since if you were running both long and short (L&S) you are in the market 100% and efficiency equals annualized return.

Updated 1-2-2016 to correct an error in the short-hold returns.

Update Aug 28th 2015:

PANW.D Update 8-28-15

Update 2-1-2016

Algorithm has had better return, efficiency and drawdown than Buy/Hold, but not consistently. Optimum buy point dropped to 1.25% (which would have given a return of $4,316)

PANW-D Update 1-2-16


Update 10-10-2016

Algorithm continues to have better return, efficiency and drawdown than Buy/Hold. Buy-hold lost 12% annualized, this strategy made 28.7% annualized. Efficiency (55%) is what the strategy would have made annualized, had the money been invested at the same rate while the strategy was out of the market.

PANW Trading Strategy Performance since publication as of Oct 10th 2016

PANW Trading Strategy Performance since publication as of Oct 10th 2016

Here is a view of the performance since original publication in March 2015:

PANW Trading Strategy, performance since initial publication, 60% gain vs 12.3% for buy-hold

PANW Trading Strategy, performance since initial publication, 60% gain vs 12.3% for buy-hold.

MSFT Trading Strategy (Daily)

Here is a strategy that worked on MSFT for the last 2 years. It gave returns around five times better than buy-hold, a total return of 360% vs. 70% for buy-hold. Drawdown was 10.6% vs. 17.9% for buy-hold. Backtest results are shown in the graphs below.

MSFT daily trading strategy

MSFT daily trading strategy, performance table and strategy details. Note that "user defined price" is the average of the high and low of previous day and the open of current day [ (h+l+o)/3 ]. A few observations; return and reward/risk was 5x better than buy-hold. Drawdown of 10.6% vs. 17.9% for buy-hold. Long side worked much better than short side.

MSFT daily strategy, graph showing how return varied with buy and sell point parameters for different time periods. The blue line shows the overall 2 year graphs, the others are for 6 month periods. All periods gave better returns than buy-hold. Note that buy point range is fairly restricted.

MSFT daily strategy, surface plot of return (z axis) as it changes with buy and sell point. The blue plateau is roughly the same return as buy-hold.

On Jan-5-2016 this post was corrected for a short-side return error, and a commission of $7 per trade was factored in.

Update Jan 5th 2016

This algorithm was not a stellar performer. Since publication it has been essentially flat, let down badly by the short-side performance

MSFD-D Table Update Jan-5-2016

To be fair, the long side performance was reasonable, but buy-hold was on a roll.

Optimum parameters for this period were different than the original posting, buy point -0.98%, sell point 10.33% for this result:

MSFD-D Table Update Jan-5-2016 Optima

Again, long-side was much more interesting than short-side performance.

Update Oct 19th 2016

This algorithm continues to perform badly

MSFT Trading Strategy (Daily) update Oct 19th 2016

MSFT Trading Strategy (Daily) update Oct 19th 2016