Finding MASC BAO strategies on randomly selected stocks
The MASC BAO trading strategy frequently shows up in the top ten backtests. It has the distinction of being the strategy used in the most profitable backtest SignalSolver has ever found--AAPL Monthly MASC BAO which would have generated over $400 Billion from $10,000 invested.
Here we look for MASC BAO strategies which beat Buy/Hold for stock symbols A through F (i.e. an arbitrary selection) using backtests run against daily, weekly and monthly data for each stock. The point of the exercise is simply to show that you can usually find a MASC BAO algorithm that beats buy or short-hold. Here are the results:
MASC BAO backtest results
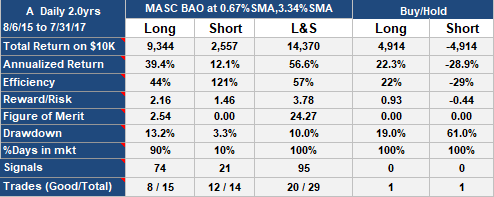 MASC BAO Trading Strategy on A (Agilent Technologies), daily data
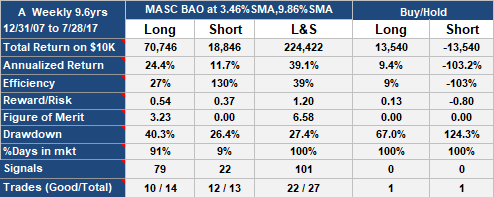 MASC BAO Trading Strategy on A (Agilent Technologies), weekly data
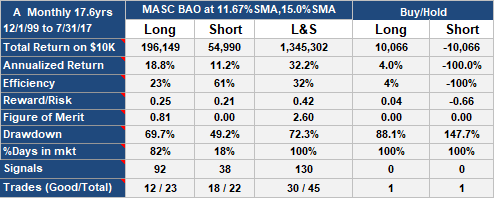 MASC BAO Trading Strategy on A (Agilent Technologies), monthly data
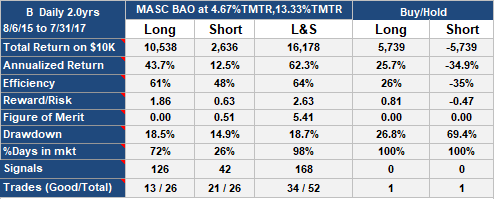
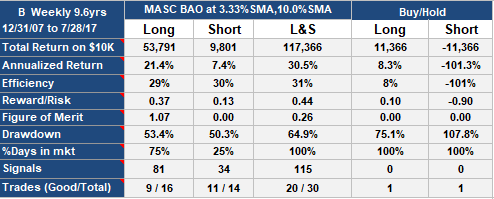
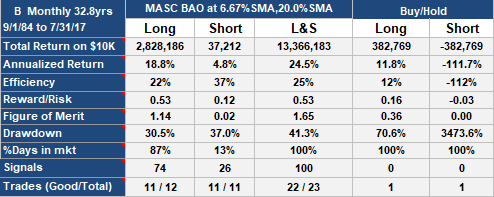
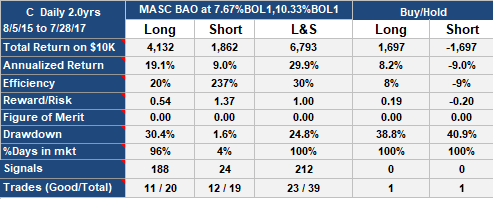
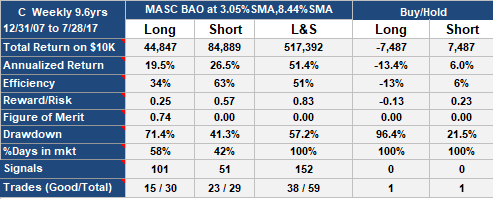
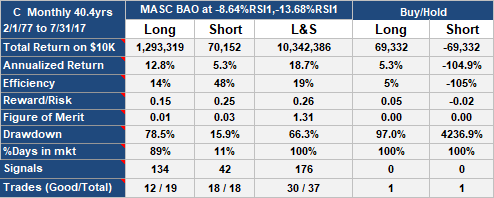
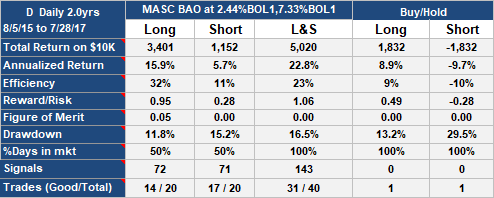
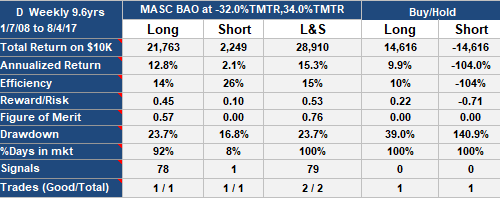
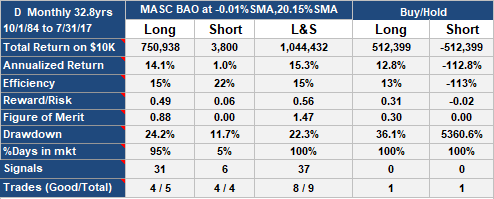
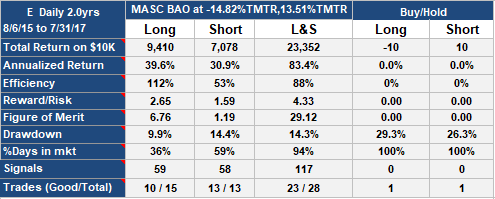
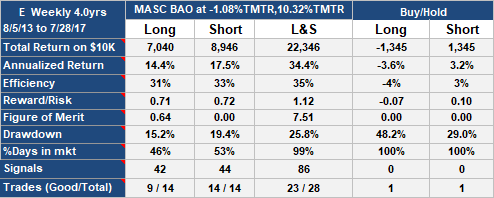
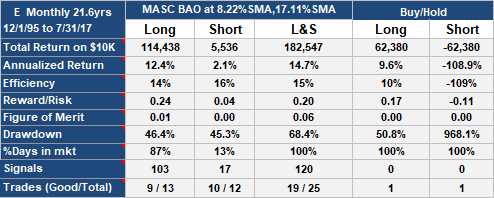
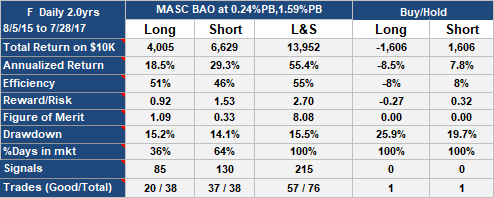
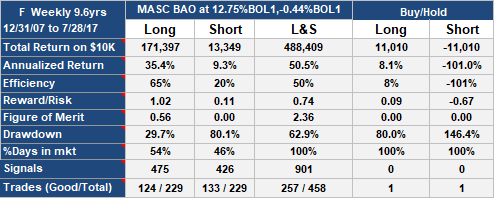
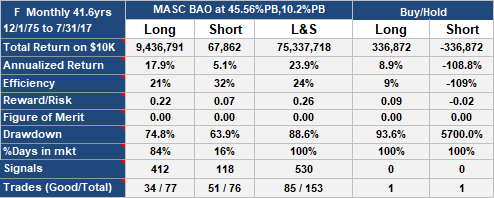
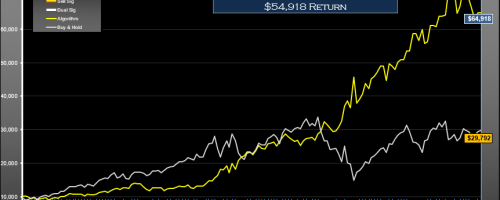
You can see that for all 18 data sets, SignalSolver was able to find MASC BAO trading algorithms which beat buy-hold or short-hold. Many were significantly better, such as the 83% annualized return for E daily (vs 0% for buy-hold), however a few were only marginally better such as the 15.3% for D weekly (vs. 12.8% for buy-hold).
More about the MASC BAO strategy
MASC BAO roughly follows a "buy the dips but sell at the first sign of trouble" methodology. The MASC BAO strategy for the Percentage Band is this:
- A BUY signal occurs if, in a given period, the price fails to rise a fixed percentage above the last sale price.
- A SELL signal occurs if the price goes below a fixed percentage below the median price (i.e. half H+L) of the previous period.
- A sell signal turns a bullish position to bearish at the open of the subsequent period.
- A buy signal switches a bearish position bullish at the close of the period.
- You only respond to one signal per time period.
For example, if the last sale price was 100, a buy signal for [MASC 10% PB] would occur if the price in a given day, week or month failed to go above 110. This could be dangerous if you were trading short or long and short. If you were short and the price broke out to new highs, there would be no buy (cover) signals and you would lose all if the price went to double your short sale price. If you were just trading long, you would be simply be locked out of a bull run.
For other bands, the percentage value is calculated on the band in use and added into the reference (in this case last sale price on buys, median price on sells), as described here. Interestingly, only 4 bands emerged from this study: SMA (Simple moving average), TMTR (Trimmed mean of the true range), Bol1 (Bollinger band 1) and the PB (percentage band). Other bands often gave good results, but these four bands gave the best results.
As always, good backtest results don't necessarily translate into future profits for any trading strategy.
Signal Solver was working great when I first downloaded it. Today there is a popup that says: “I’m, sorry. There was an error in the back test”. Is this a known recent issue?
Tried to download again but same issue.
Hi Joseph,
Yes, sorry about that. One of the Yahoo queries (the one which fetches the latest prices) just stopped working. If the condition persists, I hope to have a workaround in the next few days.
Andrew
Thank you for the quick response. The Solver is pretty awesome.
Joseph,
I have fixed SignalSolver, it should work fine again now.
Andrew Nov 7th 2017