Methodology
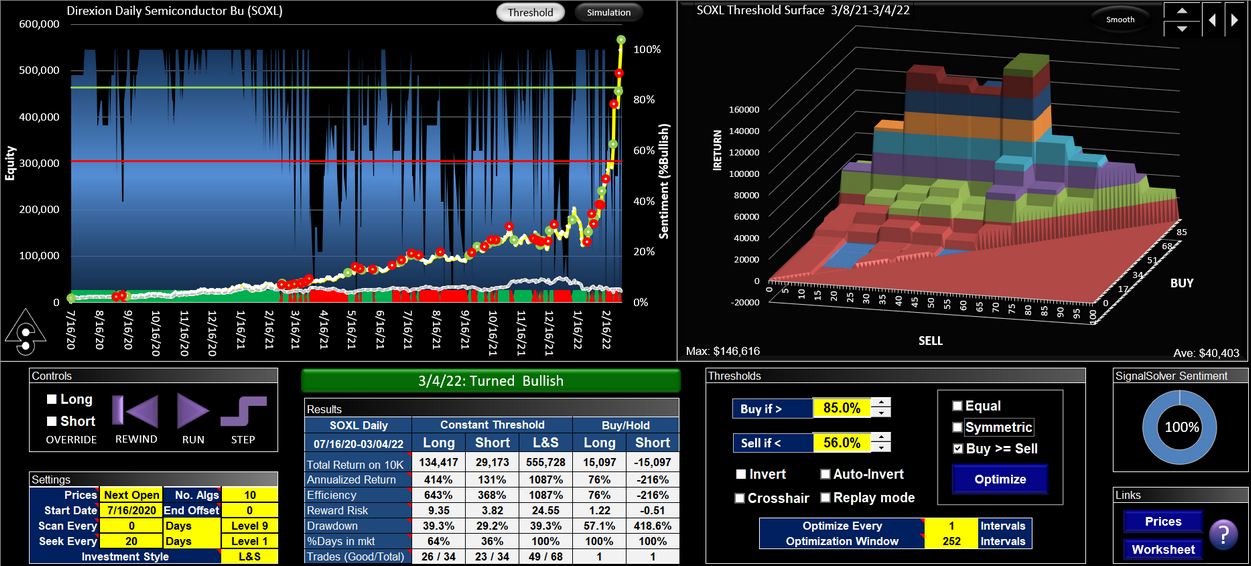
Sentiment is usually based on a consensus of opinions of expert humans. In contrast, SignalSolver sentiment is the consensus opinion of multiple backtest algorithms. This is a trading strategy for the FAS financials triple leveraged ETF using SignalSolver sentiment as the driving technical indicator. For a full explanation of the SignalSolver sentiment methodology and how to interpret the simulation results, please click here.

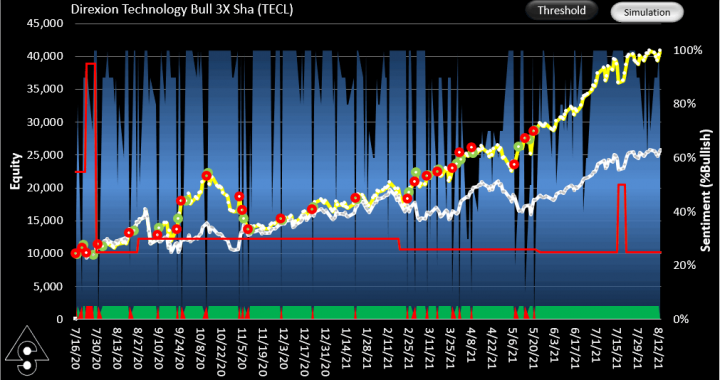
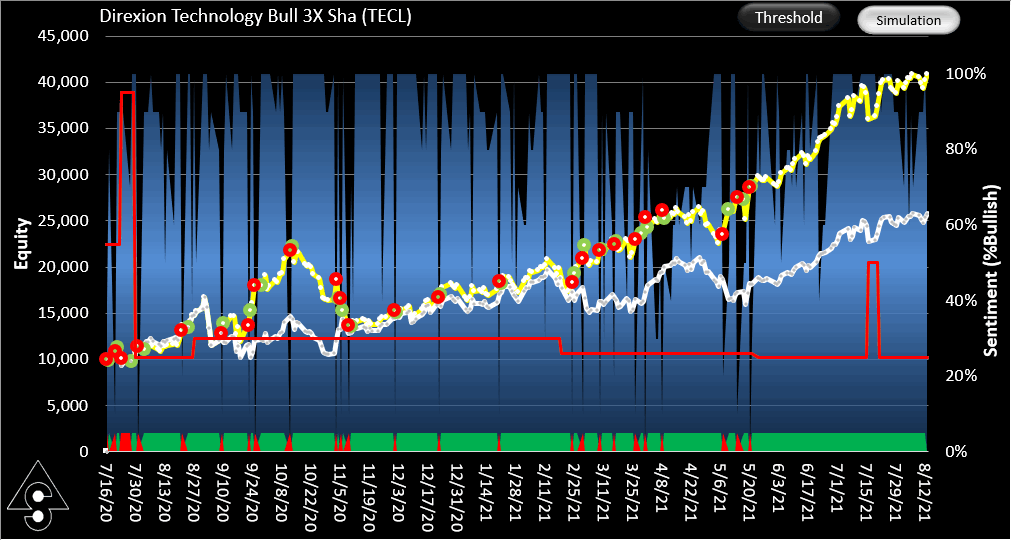
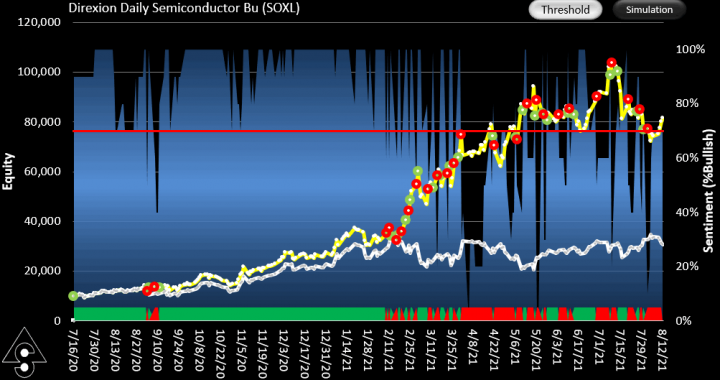
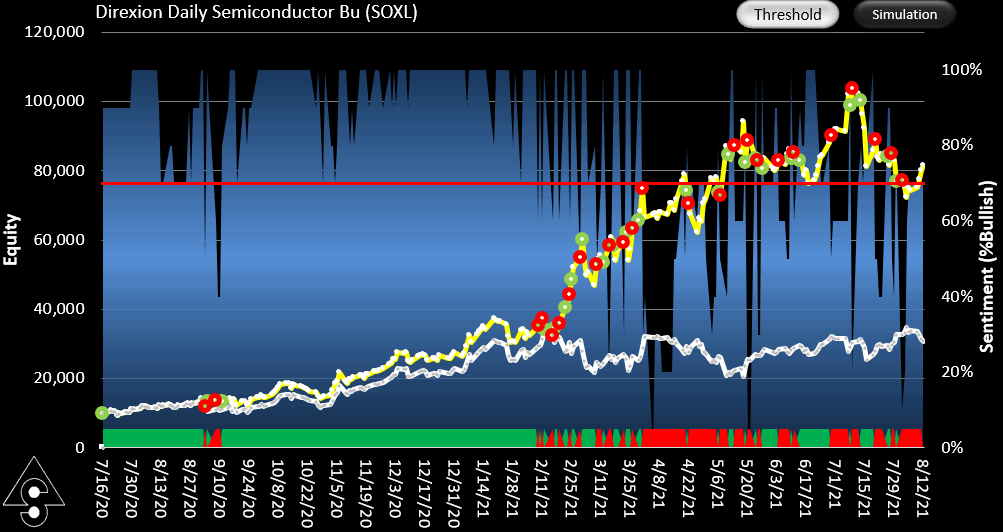
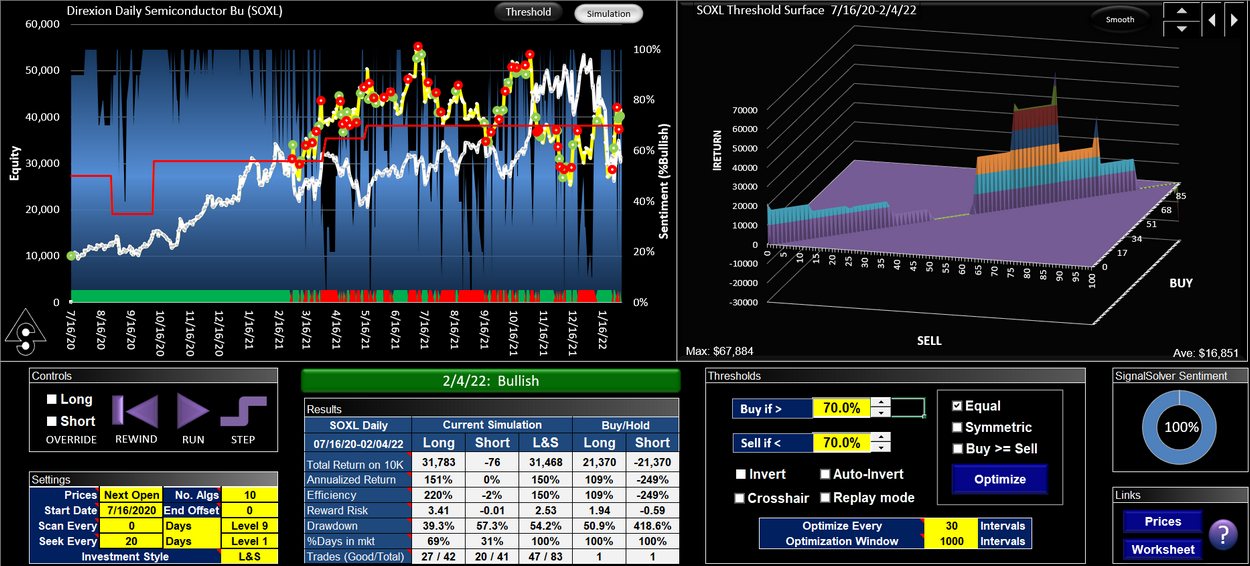
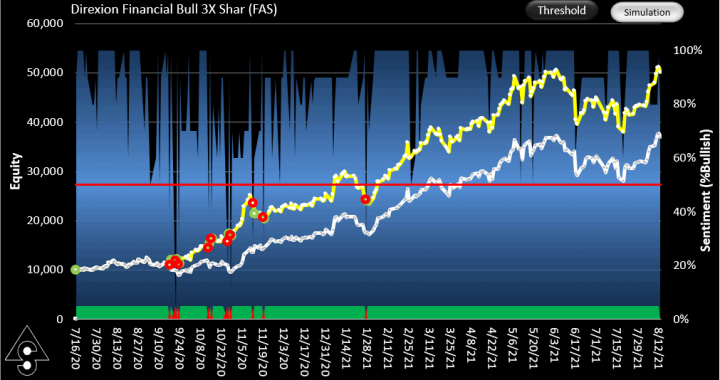
Equity curves for the FAS trading strategy
The sentiment for this simulation is calculated from the top 10 backtest algorithms. We use a fixed 50% threshold, however this could change as we move forward should the threshold surface change significantly. So far it has been working quite well, as we can see from the performance table below and the strategy would have kept us safely long for nearly the entire uptrend. All trading for this simulation is done at the open of business the trading day after the sentiment reading was taken.
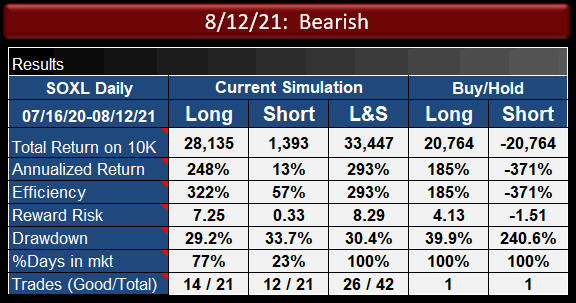
Performance
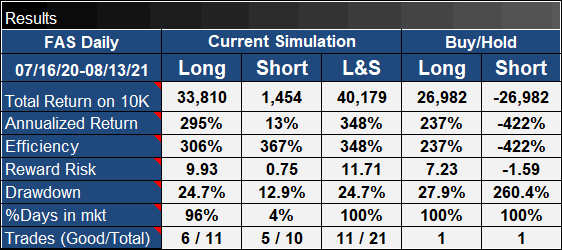
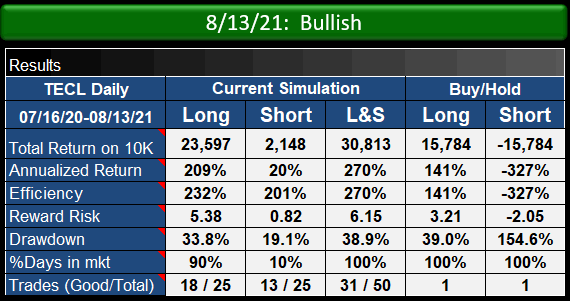
Performance of the FAS trading stragegy vs. buy/hold
The FAS trading strategy (L&S column above) has performed 60% better in this simulation than buy-hold in terms of reward/risk, and about 50% better in terms of total return. Notice that 237% CAGR and 7.23 reward-risk are very high metrics for buy-hold, so improving on them is not trivial. Drawdown has been a little lower than that of buy-hold, 24.7% being a very good value for a leveraged fund such as this. As with all these simulations, this is not a backtest result rather it is a walk-forward simulation using out-of-sample trading prices.
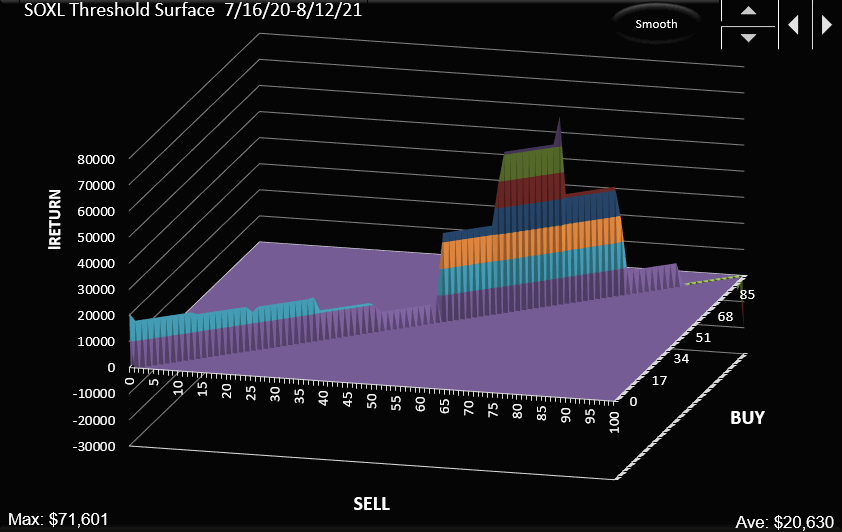
Threshold management
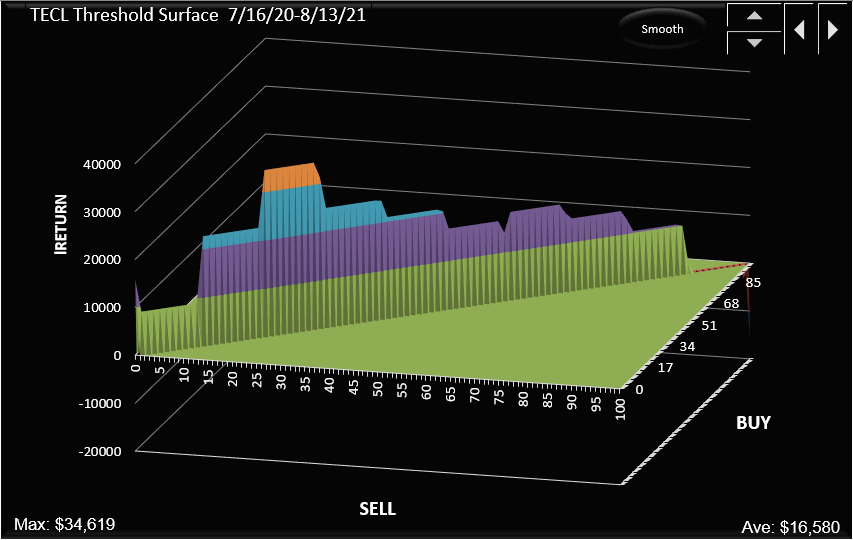
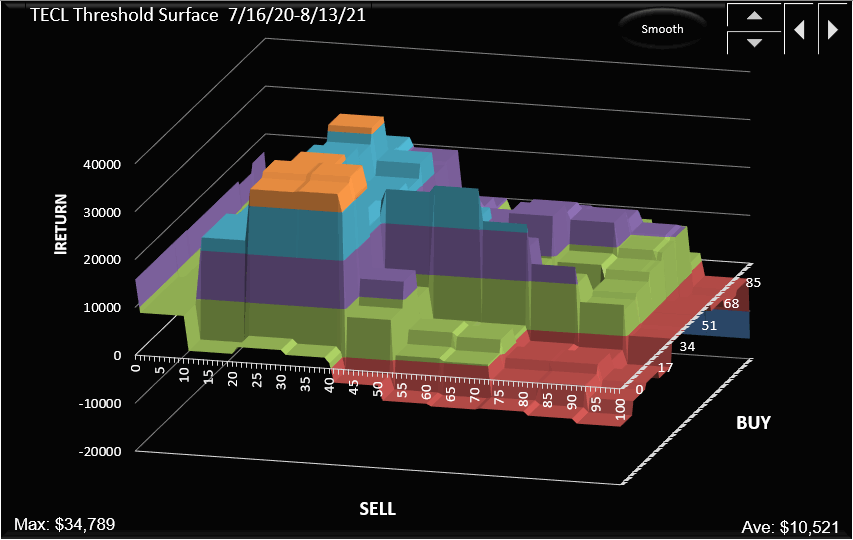
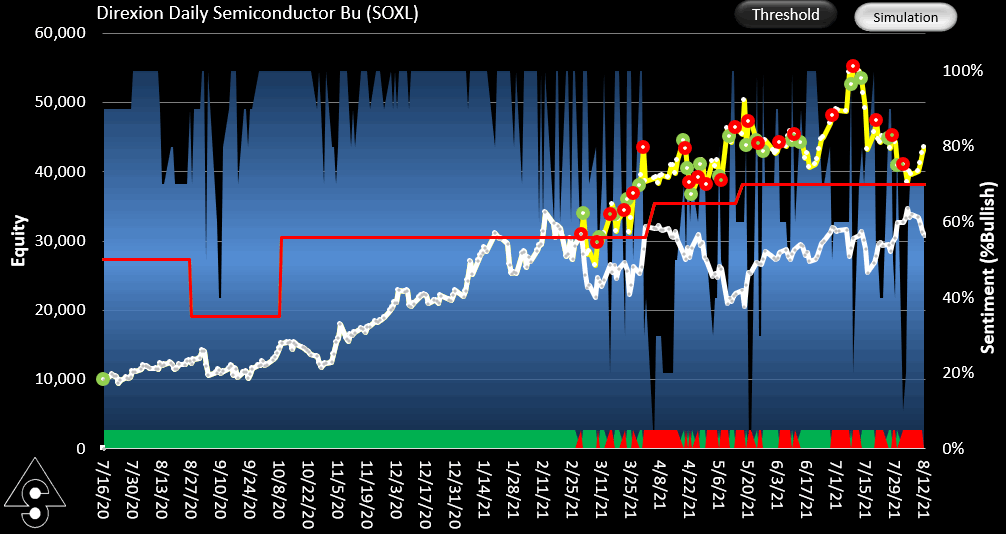
Below is the threshold surface for the entire window of 7/16/20 through 8/13/21, showing good structure for the buy=sell constrained surface. The peak is currently at a threshold of 60%, which would have given a $45,115 return had you been able to predict it in advance. However we will stick with the 50% threshold for the time being.
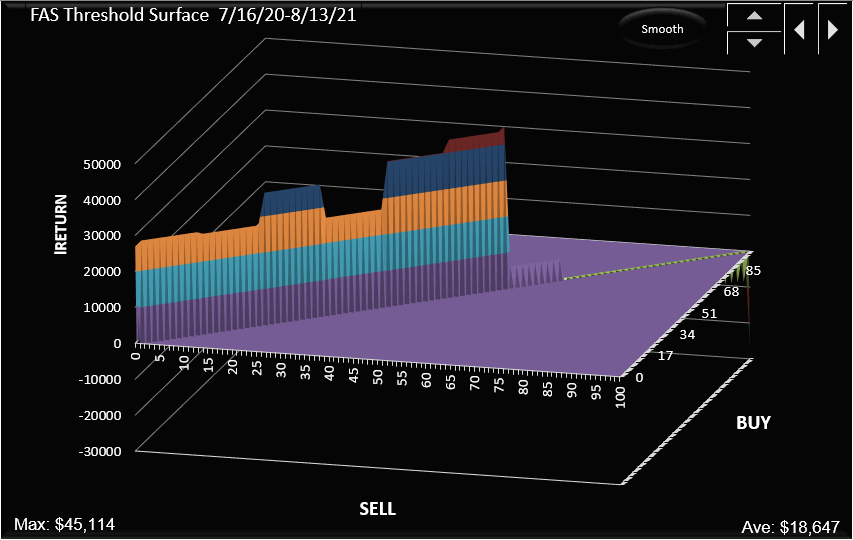
Threshold surface (buy=sell)
Click here to see the SignalSolver settings for this strategy: FAS Sentiment Settings
We now move into the paper-trading phase for this project. We will alert readers to changes in sentiment prior to the trading point.