From time to time we will post results based on SignalSolver sentiment and in some cases paper trade them moving forward. The purpose of this article is to explain how the results are arrived at. Postings will typically include the elements described here and a link to a pdf file describing the Settings within SignalSolver so you can set up the system for yourself and play around with them.
How SignalSolver Sentiment is Calculated
Typically, on day one of a sentiment run we first select a set of between 100 and 200 of the top performing algorithms from the millions in the SignalSolver universe by using the SignalSolver backtesting engine. We refer to this process as seeking. There are between 100 and 500 days of price data ending on the day in question in each backtest. Next, we sort those algorithms based on performance and examine the top few (5 to 50). All SignalSolver backtests end up in either a buy (bullish) or a sell (bearish) state. Now we calculate sentiment by simply reading what percentage are bullish. You may expect a sentiment above 50% to indicate buy and below 50% to indicate sell, and sometimes this works fine. Other times its a little more complicated, as we shall see.
We select the top algorithms to determine SignalSolver sentiment
The sentiment for any given date will vary somewhat, depending on the backtester settings and other factors.
Walking forward
The simulator calculates the sentiment for a single day at a time and then walks forward to the next trading day. On each cycle we sort the backtest results as described above. The included algorithms will change from day to day due to the sorting process as algorithm performance waxes and wanes over time. There can also be periodic seeks and/or re-optimization of the algorithms (a process we call scanning) to maintain a high quality of backtests. As the simulation advances, the price data window of the backtests also advances by one day at a time.
While we describe using daily data here, data can also be weekly or monthly, which leads to less frequent trading.
Signalling thresholds
We derive the buy and sell signals from threshold crossings of the sentiment indicator. The thresholds can be unequal but for most of the simulations we will set them to be equal and often at 50%. Crossing above a threshold is a buy signal, crossing below is a sell signal, however we can invert this behavior.
Occasionally we will show examples of simulations with a biased (non 50%) threshold. We can also allow the program to optimize the thresholds periodically. When trading using SignalSolver Sentiment, a large part is about understanding and manipulating these thresholds.
How we Simulate trading using sentiment signals
Now we have signals, we can simulate two types of trading using them--
- Take a sentiment reading after the close and trade at the next open
- Evaluate sentiment just before the close and trade at the close
The first type of simulation will be slightly more accurate (and relaxed) than the second. Trade-at-open simulations, use "out-of-sample" trading prices, that is, the trading prices are outside the backtest data. Using trade-at-close simulations, sentiment is read just before the trade so there is a slight risk that the sentiment reading is wrong. Additionally, in both cases, actual trading prices could be slightly different than the price we use for a variety of reasons. We assume all these errors are small and tend to cancel each other out.
Trading at the close often gives better results, but we shall restrict our "paper trading" posts to trade at the open. This way readers can be made aware of an upcoming trade before it occurs.
Equity Curves
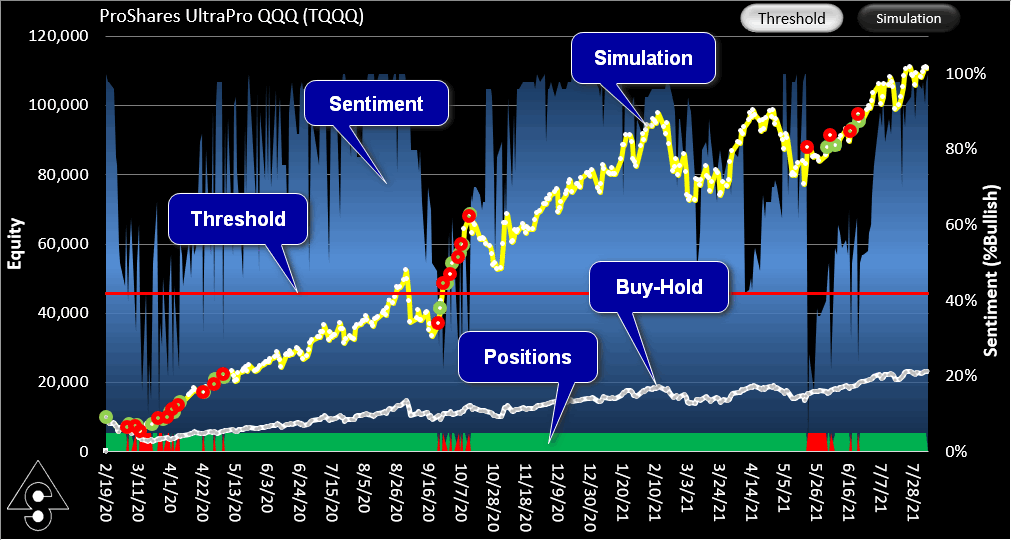
Our Equity curves show the theoretical growth of $10,000 using both the sentiment trading system and, for comparison, buy-hold. We show two types of Equity Curves; Threshold view and Simulation view.
Simulation View Equity Curve
Simulation view shows the result of simulated trading, that is, what actually would have happened had you adjusted the thresholds as you went along or had the program adjust them for you periodically. These views are not backtests as there is no look-ahead into the price data. They use walk forward out-of-sample methodology.

Example of an equity curve derived from SignalSolver sentiment
In the example below, the program automatically optimized the thresholds every 5 days, with equal buy and sell thresholds. You can see that the thresholds converged on a value of 43%, culminating in a value of 42% and resulting in quite a nice equity curve. It represents exactly what would have happened if you had started trading on 2/19/20 with the given settings and no prior knowledge of thresholds.
Naturally, you may be curious to know what would have happened if you had started out with a 42% threshold. That's when you use the Threshold view.
Threshold View Equity Curve
Threshold view is a backtest showing the equity curve for constant thresholds. Below is the same TQQQ sentiment profile with a constant 42% buy-sell threshold. It gives better results in this case, but you would need a time machine to realize these returns because you couldn't have guessed the number 42 in advance*. Contrast this with Simulation view which shows what could readily have been realized if you had started cold on day one with no knowledge of threshold behavior. It's important to understand this distinction. That said, when you are making decisions about threshold values as time progresses, Threshold view turns out to be quite valuable.
Example of an equity curve in threshold view
Performance tables
Performance tables can be either for Threshold or Simulation view, the one below is for Constant Threshold. The message area informs the user what the sentiment is for the current date and if a change in sentiment has occurred. Messages will be the same in both Simulation and Threshold view.
- Annualized Return is also known as the Compounded Annual Growth Rate (CAGR). It is the rate of return required to realize the same profit.
- Efficiency is relevant if you are out-of-the-market for some of the period. It is the Annualized Return ÷ (percentage of time spent in the market)
- Reward-Risk is the Annualized Return ÷ (Drawdown + 5%).
- Drawdown is the worst case loss if you had entered the strategy on a high and exited at a subsequent low for any period within the simulation.
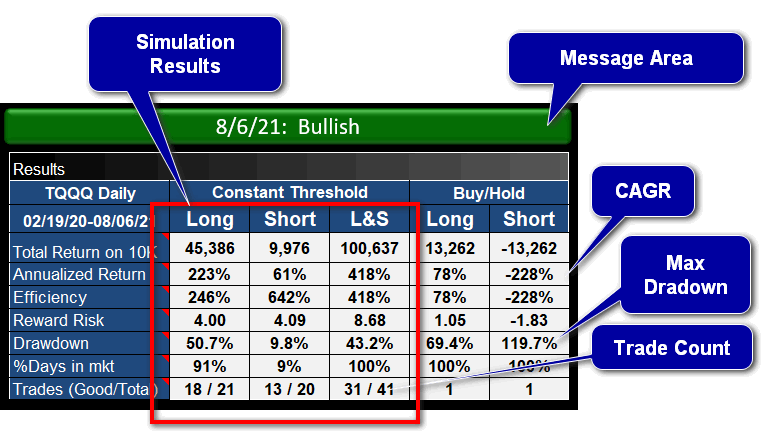
An example performance result using constant threshold
Threshold Surface
The Threshold Surface is a 3D chart showing the return for values of buy and sell threshold. Sometimes we show a partial surface, for example below we are showing only the surface for when the buy and sell thresholds are equal. You can see the peak at 42%. The chart aids in the choice of thresholds.
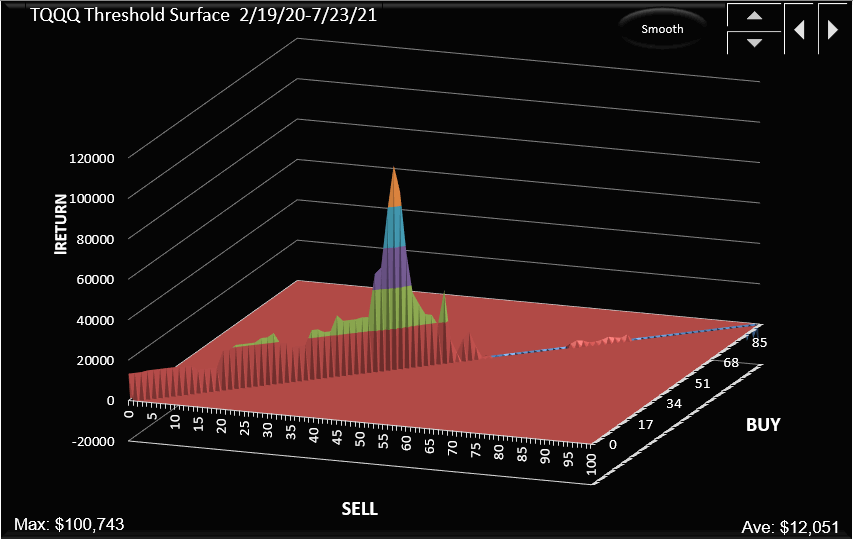
Example of a threshold surface for equal thresholds
We hope this explains how sentiment works and what the charts and tables in the postings represent.
You can read more about sentiment here
*Unless you have read "Hitchhiker's Guide to the Galaxy"