Original Post July 25 2021
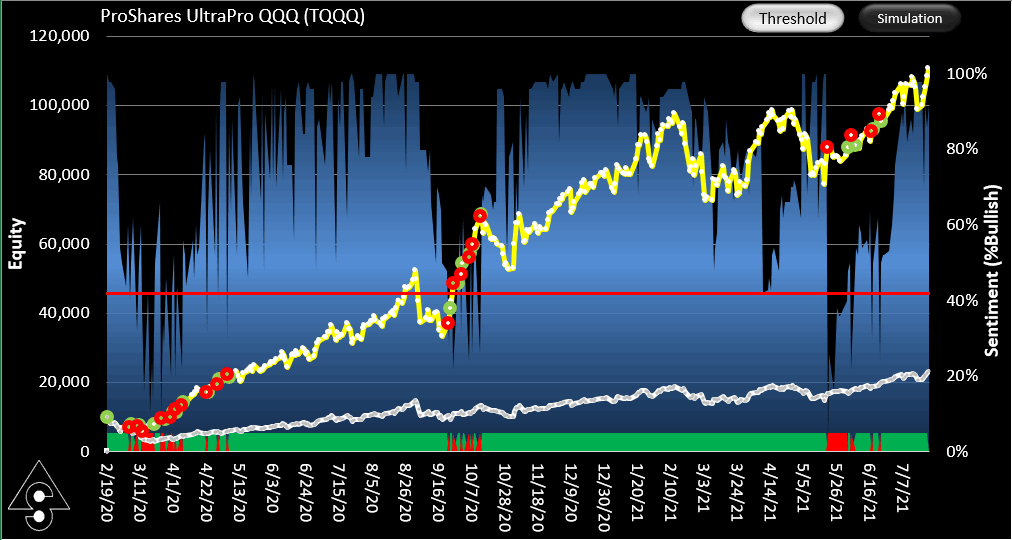
Equity curve for the TQQQ SignalSolver Sentiment trading simulation
Sentiment
Sentiment usually refers to an analyst opinion on whether a financial instrument will increase in value (bullish sentiment), or decrease (bearish sentiment). However, in this TQQQ trading strategy using SignalSolver sentiment we are combining the opinion of multiple backtest algorithms to derive sentiment.
Methodology
Shown above is the simulated result of trading TQQQ using SignalSolver Sentiment. The sentiment is shown as a blue area chart in the background. The equity curve for the strategy is shown in yellow, buy-hold equity in white. Sentiment is calculated each day after the close of business by assessing what percentage of the top 50 SignalSolver backtest algorithms are bullish. The buy and sell thresholds are fixed at 42% (red line) with bullish being above the threshold. A trade is executed at the next open whenever a change in sentiment is indicated, so the trade price is always out-of-sample from the backtest period which is fixed at 200 trading days. The simulation then walks forward to the next day, repetitively. Algorithms are re-parametrized every 4 calendar weeks and flushed and refreshed every 30 calendar weeks.
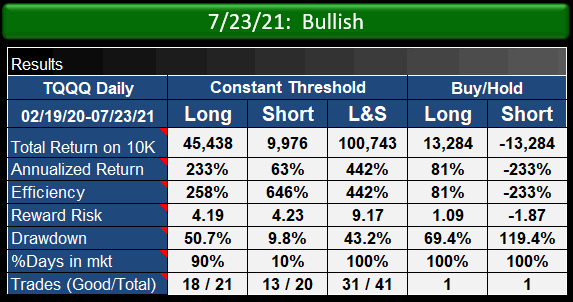
Performance of the TQQQ strategy compared to buy-hold
Performance
Trading on sentiment (L&S column above) performed around eight times better in this simulation than buy-hold in terms of reward/risk, with final equity being around seven times better for Long/Short trading of the signals and trading long only being about three times as good. In all cases, drawdown was lower for the sentiment trading than for buy-hold.
Below is shown the threshold surface for the equal buy/sell thresholds showing that annualized return (CAGR) is sensitive to threshold changes. A 43% optimum threshold was established in April 2020, switching to 42% in April 2021. Optimizing the threshold every 5 trading days would have yielded a return of $65,651 (See Settings .pdf). A 50% threshold would have yielded $35,747. All thresholds between 15% and 50% would have beaten buy-hold. We will continue with the 42% threshold for now even though we may be over-optimized at this value.
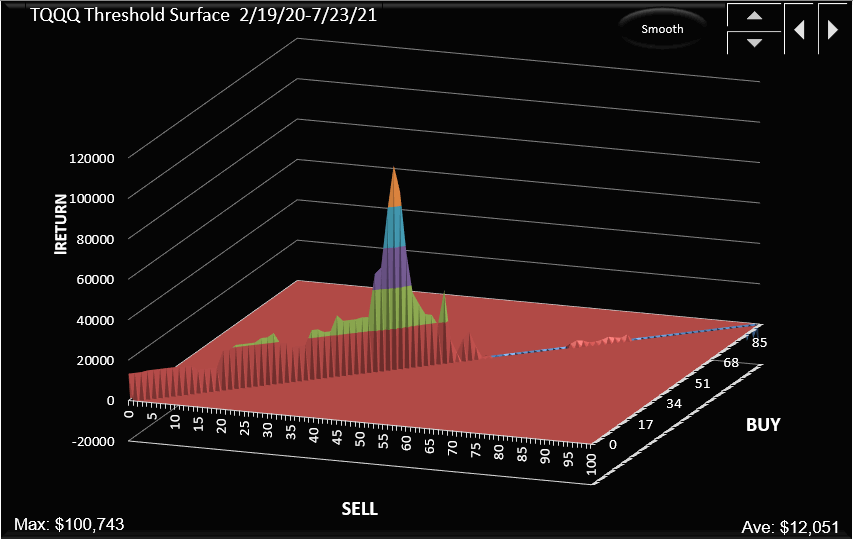
Threshold surface for the TQQQ strategy, for equal buy and sell thresholds.
Click here to see the SignalSolver settings for this strategy: TQQQ Sentiment Settings
We now move into the paper-trading phase for this project. Updates will be shown below.
Updates
We reported the progress of this algorithm daily as we paper traded here. Below we show where we ended up when we stopped tracking it.
We used constant thresholds of 42% buy, 42% sell for TQQQ which worked quite well until the end of 2021 after which we saw a dramatic fall.
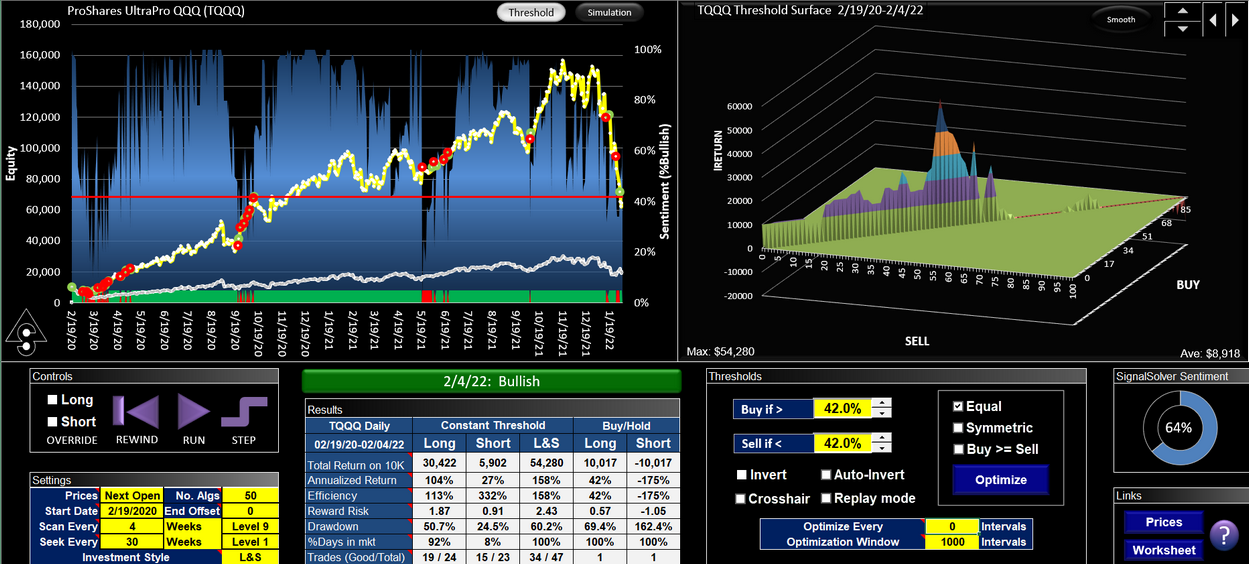
We stopped live paper trading on Feb 4th 2020 with TQQQ being down about 35% since we started paper trading on 16th July 2021. We now ask what, if anything, could have been done better. Well, similarly to AAPL, we would have done much better using adaptive thresholds. Below is an example using a threshold optimization window of 252 days or one trading year, and optimizing the thresholds every day. Using this technique, instead of making a 35% loss, we would have made a profit of 47%. The underlying stock lost 4% in the same period. As of this writing (March 1st 2022) the algorithm is up 63% while the stock is down 15% from its July 16th 2021 value. The algorithm uses the exact same sentiment profile as the original, only the buy and sell thresholds are handled differently.
Note that unlike AAPL, we do not force symmetrical thresholds, we let the thresholds float freely. The peak on the threshold surface is not at a symmetrical point.
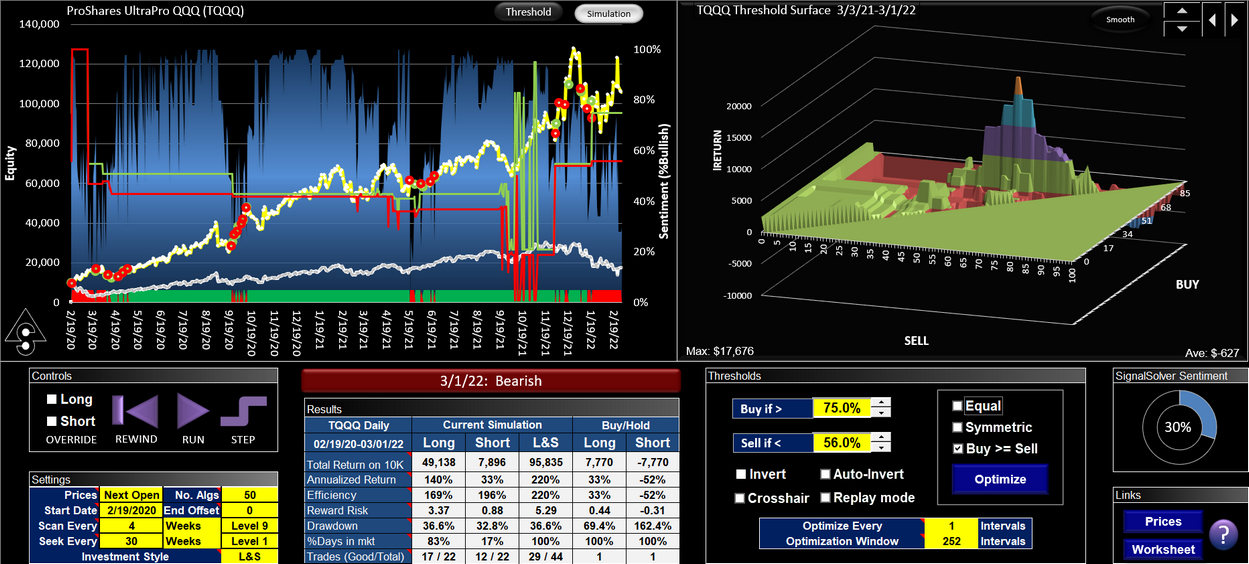
TQQQ traded using SignalSolver sentiment which is the blue bar chart in the background. The buy threshold is the green line and the sell threshold is the red line. The algorithm equity curve is yellow, buy-hold equity is the white line.
Overall the algorithm traded with a reward/risk about 12 times better than the underlying stock. This is a backtest so it doesn't mean that returns will continue, however we will track it over the next few months to see if it holds up.