The Sentiment Dashboard

The Sentiment Plot
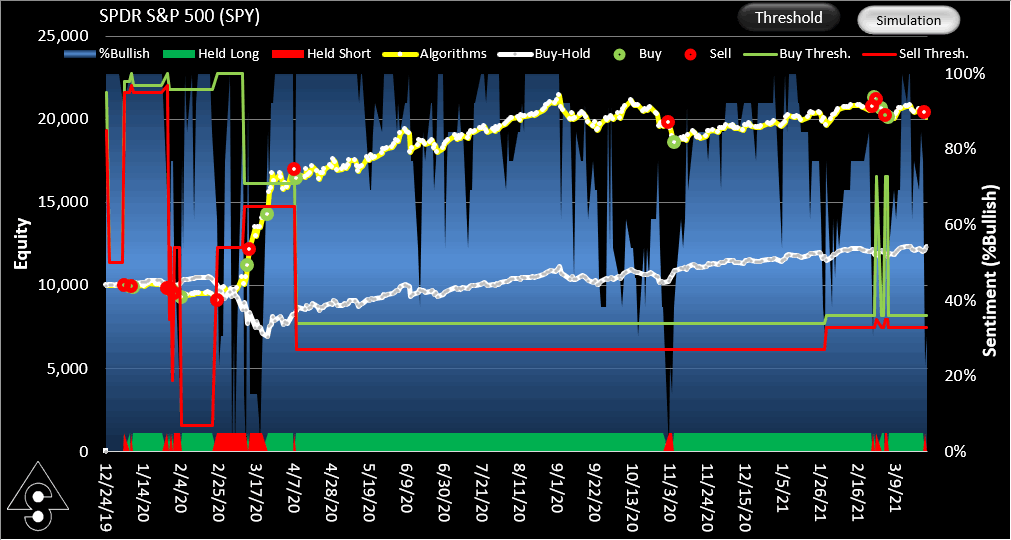
Shown on the sentiment plot are
- the equity curve (how the investment value changes over time)
- the SignalSolver Sentiment (the blue chart in the background),
- the positions held over time (green for long and red for short on the bottom axis),
- the buy-hold equity curve (white line),
- the buy threshold (thin green line visible if thresholds are not equal),
- the sell threshold (thin red line)
- Buy and sell points (green and red dots) are visible scattered along the equity curve.
The two buttons, Simulation and Threshold determine which equity curve is shown:
Simulation
When the Simulation button is selected, the chart shows the equity curve for the simulation. As the simulation progresses, the thresholds and signals change and buy and sells are generated accordingly. The simulation shows the combined effect of the program threshold selections and the user interventions. The decisions cannot be undone, you can't back up and change the decisions made without starting over by rewinding sentiment run.
Threshold
When the Threshold button is selected, the chart shows the equity curve for applying the selected thresholds across the entire sentiment run. This is useful to see how a given threshold set would have performed in the past.
Threshold Surface Plot
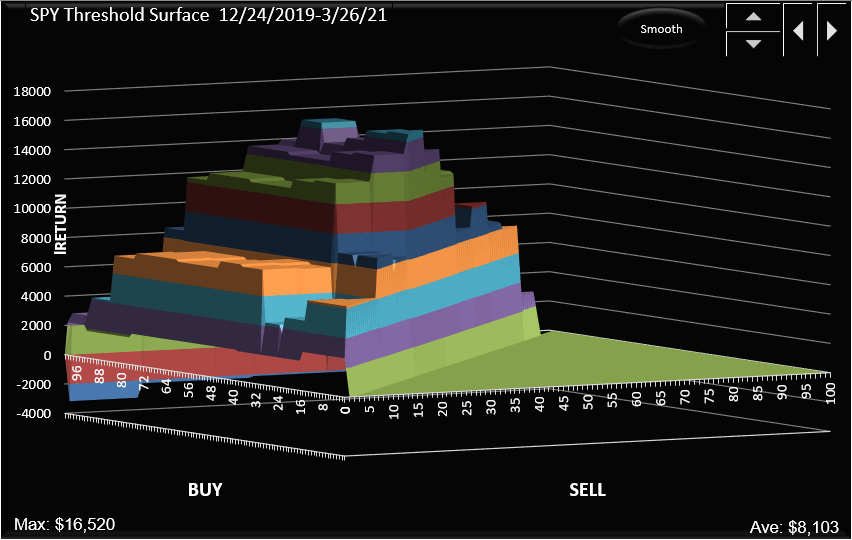
The Threshold Surface shows the returns for different values of buy and sell threshold. The taller the structures on this surface, the higher the returns have been for the period in question. It is updated at every step of the simulation. You can rotate or tilt the chart using the arrows in the top right hand corner. The graph only covers the period of the Optimization Window which is given in the title.
If you click on the buy or sell threshold value in the Threshold section, the view will change to a cross section of that threshold, but will switch back to the full threshold surface when the threshold value is de-selected.
If it is not clear where you are on the threshold surface, check the Crosshair checkbox to see the exact point at the center of the two cross sections.
There is a Smooth button at the top which may assist in visualization of the threshold surface construction.
The Sentiment Dashboard Controls

The Sentiment Dashboard controls enable you to start. stop, pause, step and rewind the sentiment run, and also give you the ability to override the program's decisions on what positions to hold.
Override
During a sentiment run you can override the program at any time to drive the sentiment to bullish or bearish. Depending on the Investment Style, this can be Long, Short or out of the market. To use these controls simply check the checkbox appropriate to the position you want to take. When you wish to give control back to the program, uncheck the checkbox.
Rewind
Clicking Rewind will clear the sentiment history in preparation for a new simulation. It will also store the last sentiment history in memory so it can be replayed in Replay mode.
Run
Clicking Run will start the simulation at the point it left off. This can have different effects
- If Replay Mode is checked, the program will start or continue to replay the last sentiment history. You can change the threshold strategy to effect different results.
- If Replay Mode is not checked, a simulation will start or continue, calling on the backtester seek/scan/run to generate sentiments. If you are at the end of the OHLC data, the program will request new data from the provider and process it, starting by repeating the last OHLC interval it processed.
If you click run and the simulator is at the end of the OHLC price data, the program will request new prices and calculate sentiment for the new data. It will also re-calculate sentiment for the last day of the old data.
Step
Works the same way as Run except only one OHLC interval (i.e. one day,week or month) is processed at a time.
Pause
Stops the sentiment processing on the current step. This enables you to examine the threshold surface and changing the thresholds before continuing.
Message Area
![]()
The message area gives information about what is happening in the simulation. The date is the date of the data currently being processed. If Replay Mode is unchecked, the message area will tell you if SignalSolver is working on a Seek, a Scan or a Run.
Depending on the state of the Invert setting, the sentiment value and the threshold values, the message area will indicate if the program is bullish or bearish for the day/week/month indicated. The color will change to indicate bullish (green) or bearish (red).
If there is a change in bullish disposition, the message area will indicate "Turned Bullish" or "Turned Bearish" to indicate that a trade is associated with the interval in question. lf you are using the dashboard for live trading, these "turned" messages would indicate that a trade should be made.
The Settings Pane
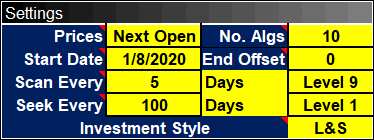
The settings pane has settings for the frequency of seeks and scans and for setting which prices and investment style are used in the simulation.
Prices
You can select Close prices or Next Open prices. If you choose Next Open, you can run the simulation after the close of business and the program will tell you if you need to change your position at the next open. If you choose Close then you should run the simulation for the day/week/month just before the close of business and then trade at the close.
No. Algs
Set the number of algorithms used to calculate sentiment. Should be less or equal to the Results Retained Setting on the Settings tab.
Start Date
The date you wish to start the simulation. Simulations are limited to 428 points.
End Offset
The number of recent OHLC data points to be excluded from the simulation. Normally zero.
Scan Every and Seek Every settings
You can set the frequency of scans and seeks as the simulation proceeds. If a scan is executed, the backtester will re-optimize the buy and sell points for the algorithms on the Algorithms tab. If a seek is executed, the backtester will first delete all the algorithms with scan level N (N is user defined) on the Algorithms tab and replace them with set of better optimized algorithms.
Between seeks and scans, the simulator will Run the algorithms on the Algorithms tab, re-sorting them at each step according to performance. Buy and sell points are not changed.
Investment Style
The simulator can simulate
- Long trading (L) where the user alternates between owning a stock long and being out of the market.
- Short trading (S) where the user alternates between short positions and out of the market.
- Long and short (L&S) trading where the user alternates between long and short
The sentiment plot and the threshold surface plot returns will reflect the style selected. The Results pane will give the results for all three styles regardless of the Investment style selected. Keep in mind, you can often get a better outcome by simulating Long trading (setting this to L), while in actuality trading L&S.
The Results pane

The results pane gives metrics for the sentiment simulation.
Total Return
Indicates the total return, usually on $10k for the security over the period specified.
Annualized Return
Shows the Compounded Annual Growth Rate (CAGR)
Efficiency
The compounded return divided by the %days in mkt. It represents the hypothetical return if you could have invested with the same rate of return for 100% of the time.
Reward Risk
The compounded return divided by the sum of the drawdown and the drawdown offset . Higher is better. The drawdown offset a user configurable percentage which can be used to prevent the reward/risk from going to infinity on zero drawdown strategies.
Drawdown
The greatest loss you could have incurred had you bought on a peak and sold on a subsequent trough. We use drawdown as a measure of risk. Lower is better.
%Days in Mkt
The percentage of days where a position was held.
Trades (Good/Total)
The number of profitable round trip trades/the total number of round trip trades. Each long trade is one buy and one sell. Each short trade is one short sell and one cover. A single reversal, long to short or short to long counts as one round trip trade.
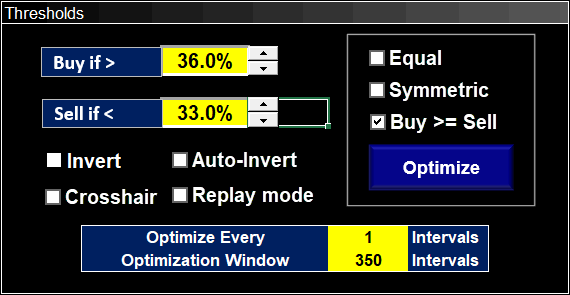
The Threshold Pane
During the simulation, if the sentiment crosses a threshold, a signal is raised triggering a trade. The Threshold Pane is where you set up and control the threshold strategy for the simulation.
Buy if >
Sell if <
Allows you to set the value of the buy and sell thresholds. If the sentiment crosses above the buy threshold, a buy signal occurs. If it crosses below the sell threshold a sell signal occurs. If the thresholds are inverted (the Invert checkbox is checked), the thresholds work in the opposite direction; a sell signal is generated when the sentiment goes up through the sell threshold and a buy signal when the sentiment goes down through the buy threshold.
The Invert Checkbox
Causes the thresholds to operate inversely. Normally a rising sentiment would generate a buy signal and a falling sentiment a sell signal. When this checkbox is checked, the thresholds operate in an inverse fashion, generating a sell signal on rising sentiment and a buy signal on falling sentiment.
The Auto-Invert Checkbox
If this checkbox is checked, when a threshold optimization occurs, the optimizer will look at both the normal threshold surface and the inverted threshold surface. It will then set the Invert checkbox appropriately to maximize the returns, depending on which threshold surface has the highest peak.
The Crosshair Checkbox
As you explore the threshold surface, it's not always clear where on the structures the selected thresholds lie. Checking the Crosshair checkbox will show you clearly exactly where the thresholds lie, at the junction of the buy and sell thresholds.
Replay Mode
It can take a long time to generate a sentiment profile, especially if you decide on frequent seeks. The Replay Mode checkbox allows you to replay the sentiment profile over without doing any backtesting. When you click on Replay Mode it will store the current sentiment profile in memory. You can then use the controls to step or run through the profile, enabling you to try different threshold strategies.
The Equal Checkbox
Forces the threshold plot to display the line of equal thresholds, and allows the equal threshold constraint in the optimization.
The Symmetric Checkbox
Forces the threshold plot to display the line of symmetric thresholds, and allows the symmetric threshold constraint in the optimization.
The Buy >=Sell Checkbox
Disallows the buy threshold to be less than the sell threshold in threshold optimizations. Prevents a situation where the sentiment decreases through the sell threshold and then returns back through the sell threshold without buying.
The Optimize Button
Finds the thresholds corresponding to the maximum return on the threshold surface and sets the threshold values accordingly. If Auto-Invert is checked, the optimizer will search both the normal threshold surface and the inverted threshold surface.
Optimize Every
Set the frequency of optimizations for the simulator in OHLC trading intervals. For example, if set to 5, on daily data it would cause a threshold optimization every 5 trading days. If set to zero, no optimizations will be performed automatically.
Optimization Window
The number of OHLC intervals (days/weeks/months) in the threshold optimization.
SignalSolver Sentiment

This gauge shows the sentiment for the current period. It is the ratio of algorithms which are bullish.
Note that the buy and sell signals are a combination of this number, the threshold values and the Invert checkbox. If the sentiment swings up and you are bearish, it will only be an indication to turn bullish if the buy threshold is crossed and the thresholds are not inverted. This will be indicated by the message area