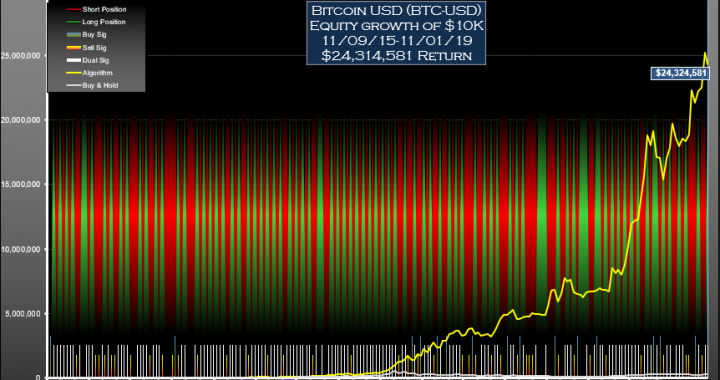
Split adjusted prices used throughout.
Key:
Cov S: Cover at the signal price
Buy S: Buy at the signal price
Sht S: Short at the signal price
Sell S: Sell at the signal price
C/B S: Cover or buy at the signal price (not clear which signal came first)
S/Sh S: Sell or short at the signal price (not clear which signal came first)
Cov o: Cover a short position at the subsequent weekly open
Sell o: Close a long position at the subsequent weekly open
| Week of signal |
Buy or Sell |
Price |
L&S Value Next Open |
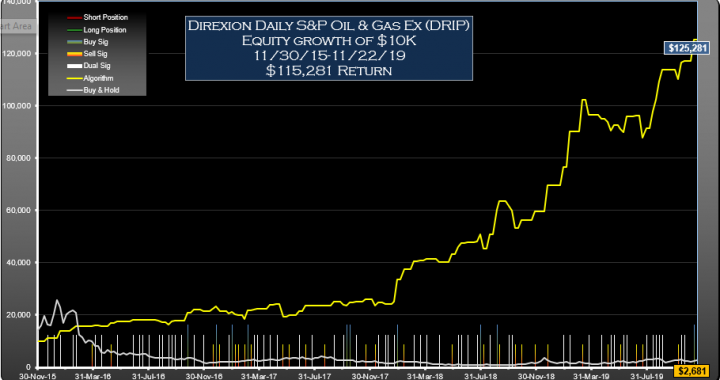
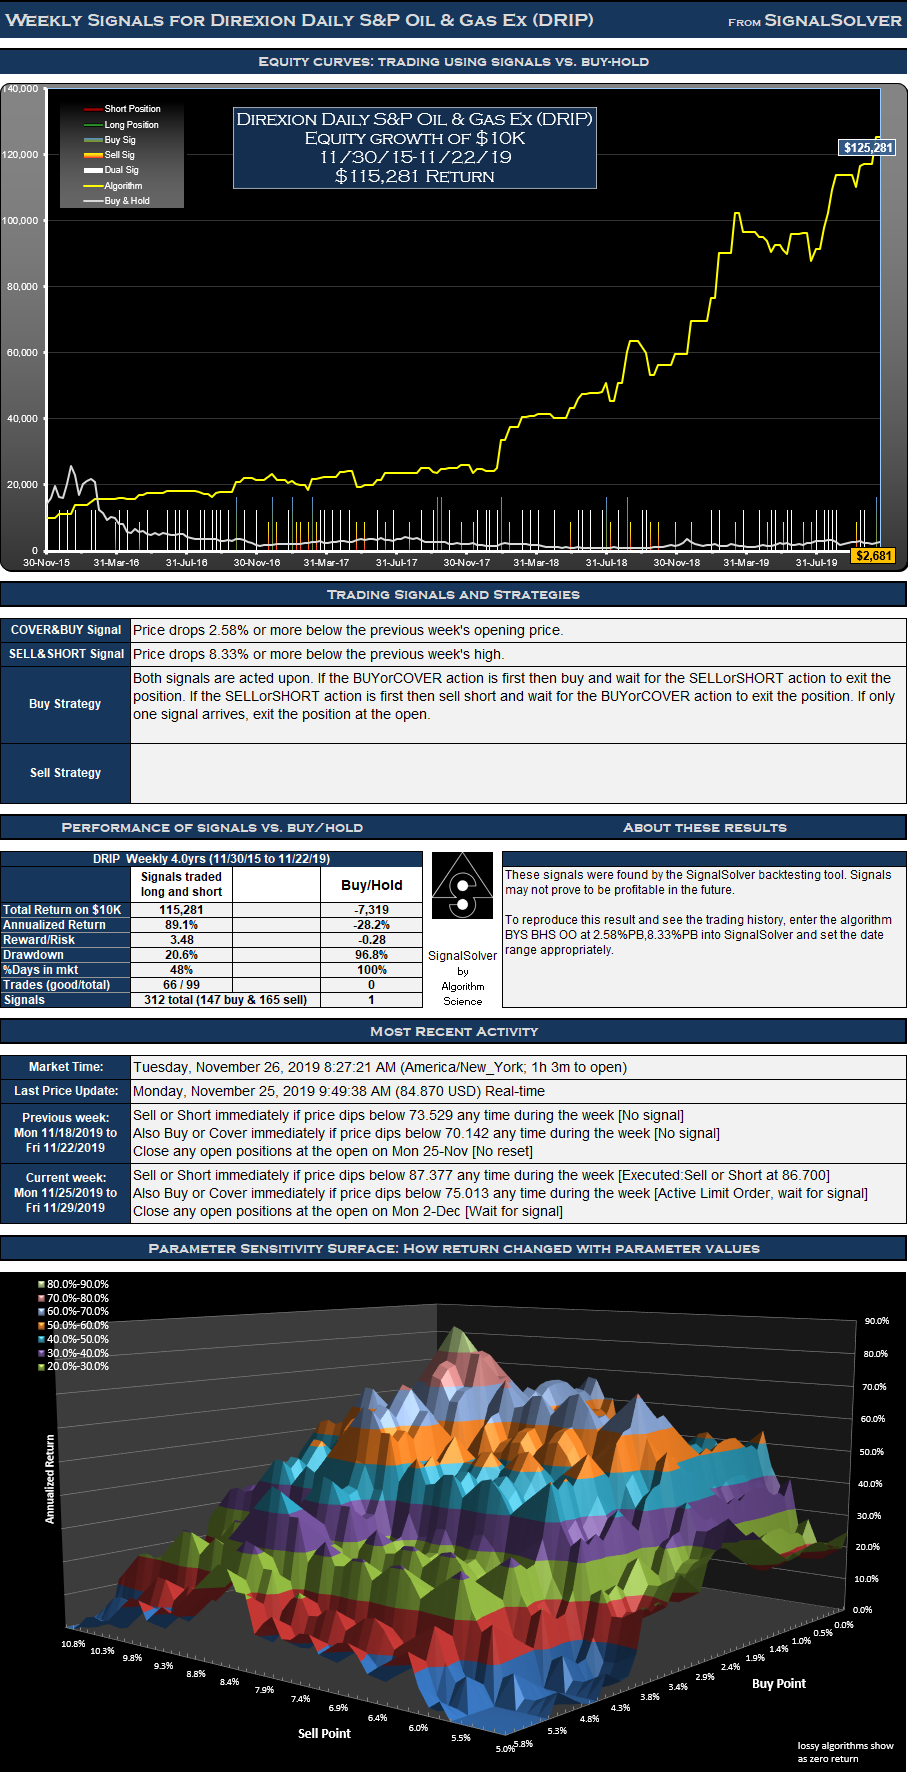
| 11/30/2015 |
|
|
10,000 |
| 12/21/2015 |
Cov S |
509.99 |
11,273 |
| 12/21/2015 |
Sht S |
584.40 |
11,273 |
| 1/4/2016 |
Cov S |
523.33 |
11,338 |
| 1/4/2016 |
Sht S |
526.36 |
11,338 |
| 1/18/2016 |
Cov S |
645.41 |
13,991 |
| 1/18/2016 |
Sht S |
842.56 |
13,991 |
| 2/15/2016 |
C/B S |
653.26 |
14,852 |
| 2/15/2016 |
S/Sh S |
694.69 |
14,852 |
| 2/22/2016 |
C/B S |
676.76 |
15,707 |
| 2/22/2016 |
S/Sh S |
716.88 |
15,707 |
| 3/28/2016 |
Sht S |
334.50 |
15,860 |
| 3/28/2016 |
Cov o |
331.25 |
15,860 |
| 4/4/2016 |
C/B S |
325.87 |
16,120 |
| 4/4/2016 |
S/Sh S |
331.25 |
16,120 |
| 4/18/2016 |
Buy S |
262.55 |
15,787 |
| 4/18/2016 |
Sell S |
257.13 |
15,787 |
| 5/9/2016 |
Sht S |
206.26 |
17,032 |
| 5/9/2016 |
Cov o |
190.00 |
17,032 |
| 5/23/2016 |
Cov S |
185.10 |
17,629 |
| 5/23/2016 |
Sht S |
191.82 |
17,629 |
| 6/27/2016 |
Cov S |
152.71 |
18,233 |
| 6/27/2016 |
Sht S |
158.13 |
18,233 |
| 7/11/2016 |
C/B S |
161.23 |
18,264 |
| 7/11/2016 |
S/Sh S |
161.50 |
18,264 |
| 7/18/2016 |
Buy S |
157.33 |
18,037 |
| 7/18/2016 |
Sell S |
155.38 |
18,037 |
| 8/1/2016 |
C/B S |
166.83 |
18,109 |
| 8/1/2016 |
S/Sh S |
167.50 |
18,109 |
| 8/22/2016 |
C/B S |
123.50 |
17,740 |
| 8/22/2016 |
S/Sh S |
121.00 |
17,740 |
| 8/29/2016 |
Buy S |
120.31 |
17,199 |
| 8/29/2016 |
Sell S |
116.65 |
17,199 |
| 9/12/2016 |
Buy S |
114.86 |
16,390 |
| 9/12/2016 |
Sell S |
109.45 |
16,390 |
| 9/19/2016 |
Cov S |
113.10 |
17,518 |
| 9/19/2016 |
Sht S |
121.46 |
17,518 |
| 9/26/2016 |
Cov S |
118.56 |
17,898 |
| 9/26/2016 |
Sht S |
121.19 |
17,898 |
| 10/10/2016 |
C/B S |
95.90 |
17,820 |
| 10/10/2016 |
S/Sh S |
95.48 |
17,820 |
| 10/24/2016 |
Buy S |
102.24 |
20,741 |
| 10/24/2016 |
Sell o |
119.00 |
20,741 |
| 11/7/2016 |
C/B S |
115.93 |
21,995 |
| 11/7/2016 |
S/Sh S |
123.15 |
21,995 |
| 11/28/2016 |
C/B S |
82.25 |
21,618 |
| 11/28/2016 |
S/Sh S |
80.85 |
21,618 |
| 12/19/2016 |
Sht S |
62.22 |
22,320 |
| 12/19/2016 |
Cov o |
60.20 |
22,320 |
| 12/26/2016 |
Buy S |
60.20 |
23,432 |
| 12/26/2016 |
Sell o |
63.20 |
23,432 |
| 1/3/2017 |
Sht S |
60.41 |
21,458 |
| 1/3/2017 |
Cov o |
65.50 |
21,458 |
| 1/23/2017 |
Buy S |
65.27 |
20,614 |
| 1/23/2017 |
Sell S |
62.70 |
20,614 |
| 1/30/2017 |
Buy S |
66.10 |
21,081 |
| 1/30/2017 |
Sell o |
67.60 |
21,081 |
| 2/6/2017 |
Sht S |
67.60 |
20,348 |
| 2/6/2017 |
Cov o |
69.95 |
20,348 |
| 2/13/2017 |
Sht S |
69.95 |
20,101 |
| 2/13/2017 |
Cov o |
70.80 |
20,101 |
| 2/27/2017 |
Sht S |
75.90 |
18,606 |
| 2/27/2017 |
Cov o |
81.55 |
18,606 |
| 3/6/2017 |
Buy S |
78.96 |
21,914 |
| 3/6/2017 |
Sell o |
93.00 |
21,914 |
| 3/13/2017 |
Sht S |
90.80 |
21,805 |
| 3/13/2017 |
Cov o |
91.25 |
21,805 |
| 3/20/2017 |
C/B S |
90.60 |
21,961 |
| 3/20/2017 |
S/Sh S |
91.25 |
21,961 |
| 3/27/2017 |
Cov S |
88.90 |
22,465 |
| 3/27/2017 |
Sht S |
90.98 |
22,465 |
| 4/10/2017 |
C/B S |
79.10 |
22,255 |
| 4/10/2017 |
S/Sh S |
78.36 |
22,255 |
| 4/24/2017 |
Cov S |
83.44 |
23,970 |
| 4/24/2017 |
Sht S |
90.41 |
23,970 |
| 5/8/2017 |
C/B S |
95.13 |
24,176 |
| 5/8/2017 |
S/Sh S |
95.95 |
24,176 |
| 5/22/2017 |
Sht S |
87.60 |
19,443 |
| 5/22/2017 |
Cov o |
104.75 |
19,443 |
| 6/5/2017 |
Sht S |
110.00 |
19,974 |
| 6/5/2017 |
Cov o |
107.00 |
19,974 |
| 6/26/2017 |
C/B S |
114.18 |
21,430 |
| 6/26/2017 |
S/Sh S |
122.80 |
21,430 |
| 7/10/2017 |
Sht S |
124.21 |
23,657 |
| 7/10/2017 |
Cov o |
111.30 |
23,657 |
| 7/24/2017 |
Cov S |
108.43 |
23,671 |
| 7/24/2017 |
Sht S |
108.49 |
23,671 |
| 8/21/2017 |
Sht S |
131.68 |
23,722 |
| 8/21/2017 |
Cov o |
131.40 |
23,722 |
| 9/11/2017 |
Cov S |
114.22 |
25,245 |
| 9/11/2017 |
Sht S |
122.06 |
25,245 |
| 10/2/2017 |
Buy S |
88.26 |
23,899 |
| 10/2/2017 |
Sell S |
83.56 |
23,899 |
| 10/9/2017 |
Buy S |
86.90 |
23,583 |
| 10/9/2017 |
Sell o |
85.75 |
23,583 |
| 10/16/2017 |
Buy S |
85.39 |
24,732 |
| 10/16/2017 |
Sell o |
89.55 |
24,732 |
| 10/30/2017 |
C/B S |
87.24 |
25,115 |
| 10/30/2017 |
S/Sh S |
88.60 |
25,115 |
| 11/20/2017 |
Sht S |
75.81 |
25,947 |
| 11/20/2017 |
Cov o |
73.30 |
25,947 |
| 12/11/2017 |
Sht S |
70.82 |
23,717 |
| 12/11/2017 |
Cov o |
76.90 |
23,717 |
| 12/18/2017 |
Cov S |
69.12 |
24,726 |
| 12/18/2017 |
Sht S |
72.19 |
24,726 |
| 1/2/2018 |
C/B S |
57.75 |
24,129 |
| 1/2/2018 |
S/Sh S |
56.37 |
24,129 |
| 1/8/2018 |
C/B S |
53.40 |
24,128 |
| 1/8/2018 |
S/Sh S |
53.40 |
24,128 |
| 1/22/2018 |
Cov S |
47.30 |
25,030 |
| 1/22/2018 |
Sht S |
49.14 |
25,030 |
| 1/29/2018 |
Buy S |
50.95 |
33,652 |
| 1/29/2018 |
Sell o |
68.50 |
33,652 |
| 2/12/2018 |
Sht S |
81.95 |
37,532 |
| 2/12/2018 |
Cov o |
72.50 |
37,532 |
| 3/5/2018 |
C/B S |
66.05 |
40,458 |
| 3/5/2018 |
S/Sh S |
71.40 |
40,458 |
| 3/19/2018 |
Cov S |
64.64 |
40,905 |
| 3/19/2018 |
Sht S |
65.36 |
40,905 |
| 4/2/2018 |
Cov S |
60.89 |
41,619 |
| 4/2/2018 |
Sht S |
61.97 |
41,619 |
| 4/30/2018 |
Buy S |
43.55 |
40,126 |
| 4/30/2018 |
Sell S |
41.98 |
40,126 |
| 5/29/2018 |
Sht S |
35.06 |
43,289 |
| 5/29/2018 |
Cov o |
32.30 |
43,289 |
| 6/11/2018 |
C/B S |
31.47 |
45,937 |
| 6/11/2018 |
S/Sh S |
33.45 |
45,937 |
| 6/18/2018 |
Cov S |
32.59 |
47,566 |
| 6/18/2018 |
Sht S |
33.78 |
47,566 |
| 7/2/2018 |
C/B S |
30.10 |
47,719 |
| 7/2/2018 |
S/Sh S |
30.20 |
47,719 |
| 7/23/2018 |
C/B S |
29.52 |
48,252 |
| 7/23/2018 |
S/Sh S |
29.85 |
48,252 |
| 7/30/2018 |
Buy S |
29.08 |
50,775 |
| 7/30/2018 |
Sell o |
30.60 |
50,775 |
| 8/6/2018 |
Sht S |
29.29 |
45,554 |
| 8/6/2018 |
Cov o |
32.30 |
45,554 |
| 8/20/2018 |
Cov S |
31.47 |
50,755 |
| 8/20/2018 |
Sht S |
35.52 |
50,755 |
| 9/4/2018 |
Buy S |
29.10 |
60,173 |
| 9/4/2018 |
Sell o |
34.50 |
60,173 |
| 9/10/2018 |
Sht S |
33.41 |
63,710 |
| 9/10/2018 |
Cov o |
31.45 |
63,710 |
| 10/1/2018 |
C/B S |
26.65 |
61,714 |
| 10/1/2018 |
S/Sh S |
25.83 |
61,714 |
| 10/8/2018 |
Buy S |
25.96 |
59,923 |
| 10/8/2018 |
Sell S |
25.21 |
59,923 |
| 10/15/2018 |
Sht S |
30.16 |
53,286 |
| 10/15/2018 |
Cov o |
33.50 |
53,286 |
| 10/29/2018 |
Sht S |
43.77 |
56,417 |
| 10/29/2018 |
Cov o |
41.20 |
56,417 |
| 11/26/2018 |
Sht S |
52.44 |
59,683 |
| 11/26/2018 |
Cov o |
49.40 |
59,683 |
| 12/24/2018 |
Sht S |
103.36 |
69,677 |
| 12/24/2018 |
Cov o |
86.05 |
69,677 |
| 1/28/2019 |
Cov S |
50.51 |
76,517 |
| 1/28/2019 |
Sht S |
56.01 |
76,517 |
| 2/11/2019 |
Cov S |
53.09 |
90,301 |
| 2/11/2019 |
Sht S |
64.76 |
90,301 |
| 3/11/2019 |
Sht S |
62.66 |
102,345 |
| 3/11/2019 |
Cov o |
54.30 |
102,345 |
| 3/25/2019 |
Buy S |
52.90 |
96,482 |
| 3/25/2019 |
Sell S |
49.87 |
96,482 |
| 4/22/2019 |
Buy S |
40.04 |
95,205 |
| 4/22/2019 |
Sell S |
39.51 |
95,205 |
| 5/6/2019 |
Sht S |
51.43 |
93,959 |
| 5/6/2019 |
Cov o |
52.10 |
93,959 |
| 5/13/2019 |
C/B S |
52.10 |
90,533 |
| 5/13/2019 |
S/Sh S |
50.24 |
90,533 |
| 5/20/2019 |
Cov S |
50.76 |
92,582 |
| 5/20/2019 |
Sht S |
51.93 |
92,582 |
| 6/3/2019 |
Sht S |
71.14 |
91,067 |
| 6/3/2019 |
Cov o |
72.30 |
91,067 |
| 6/10/2019 |
Buy S |
72.24 |
90,026 |
| 6/10/2019 |
Sell S |
71.41 |
90,026 |
| 6/17/2019 |
Cov S |
70.43 |
95,927 |
| 6/17/2019 |
Sht S |
75.38 |
95,927 |
| 7/8/2019 |
Sht S |
62.45 |
96,181 |
| 7/8/2019 |
Cov o |
62.28 |
96,181 |
| 7/22/2019 |
Sht S |
75.27 |
87,735 |
| 7/22/2019 |
Cov o |
81.88 |
87,735 |
| 7/29/2019 |
Cov S |
74.04 |
91,311 |
| 7/29/2019 |
Sht S |
77.19 |
91,311 |
| 8/12/2019 |
C/B S |
93.43 |
97,918 |
| 8/12/2019 |
S/Sh S |
100.43 |
97,918 |
| 8/19/2019 |
C/B S |
97.84 |
102,305 |
| 8/19/2019 |
S/Sh S |
102.32 |
102,305 |
| 8/26/2019 |
Cov S |
99.68 |
109,232 |
| 8/26/2019 |
Sht S |
106.92 |
109,232 |
| 9/3/2019 |
C/B S |
106.19 |
113,898 |
| 9/3/2019 |
S/Sh S |
110.82 |
113,898 |
| 10/7/2019 |
Sht S |
89.96 |
110,302 |
| 10/7/2019 |
Cov o |
92.80 |
110,302 |
| 10/14/2019 |
C/B S |
87.64 |
116,617 |
| 10/14/2019 |
S/Sh S |
92.80 |
116,617 |
| 10/21/2019 |
Cov S |
90.41 |
117,146 |
| 10/21/2019 |
Sht S |
90.82 |
117,146 |
| 11/11/2019 |
Buy S |
72.00 |
125,281 |
| 11/11/2019 |
Sell o |
77.00 |
125,281 |
| 11/25/2019 |
S/Sh S |
86.70 |
125,281 |