Alibaba Signals Equity Growth

Alibaba (BABA) Signals – Daily

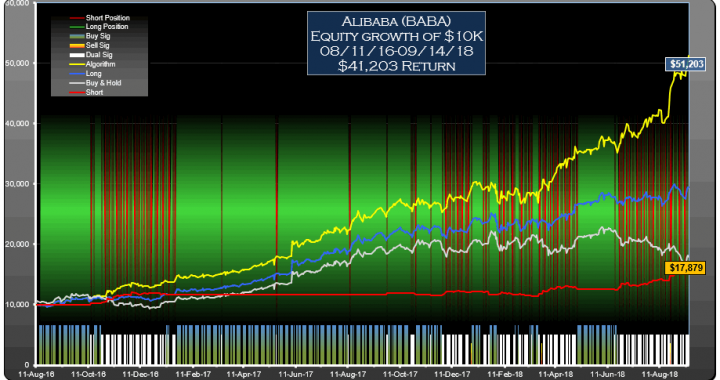
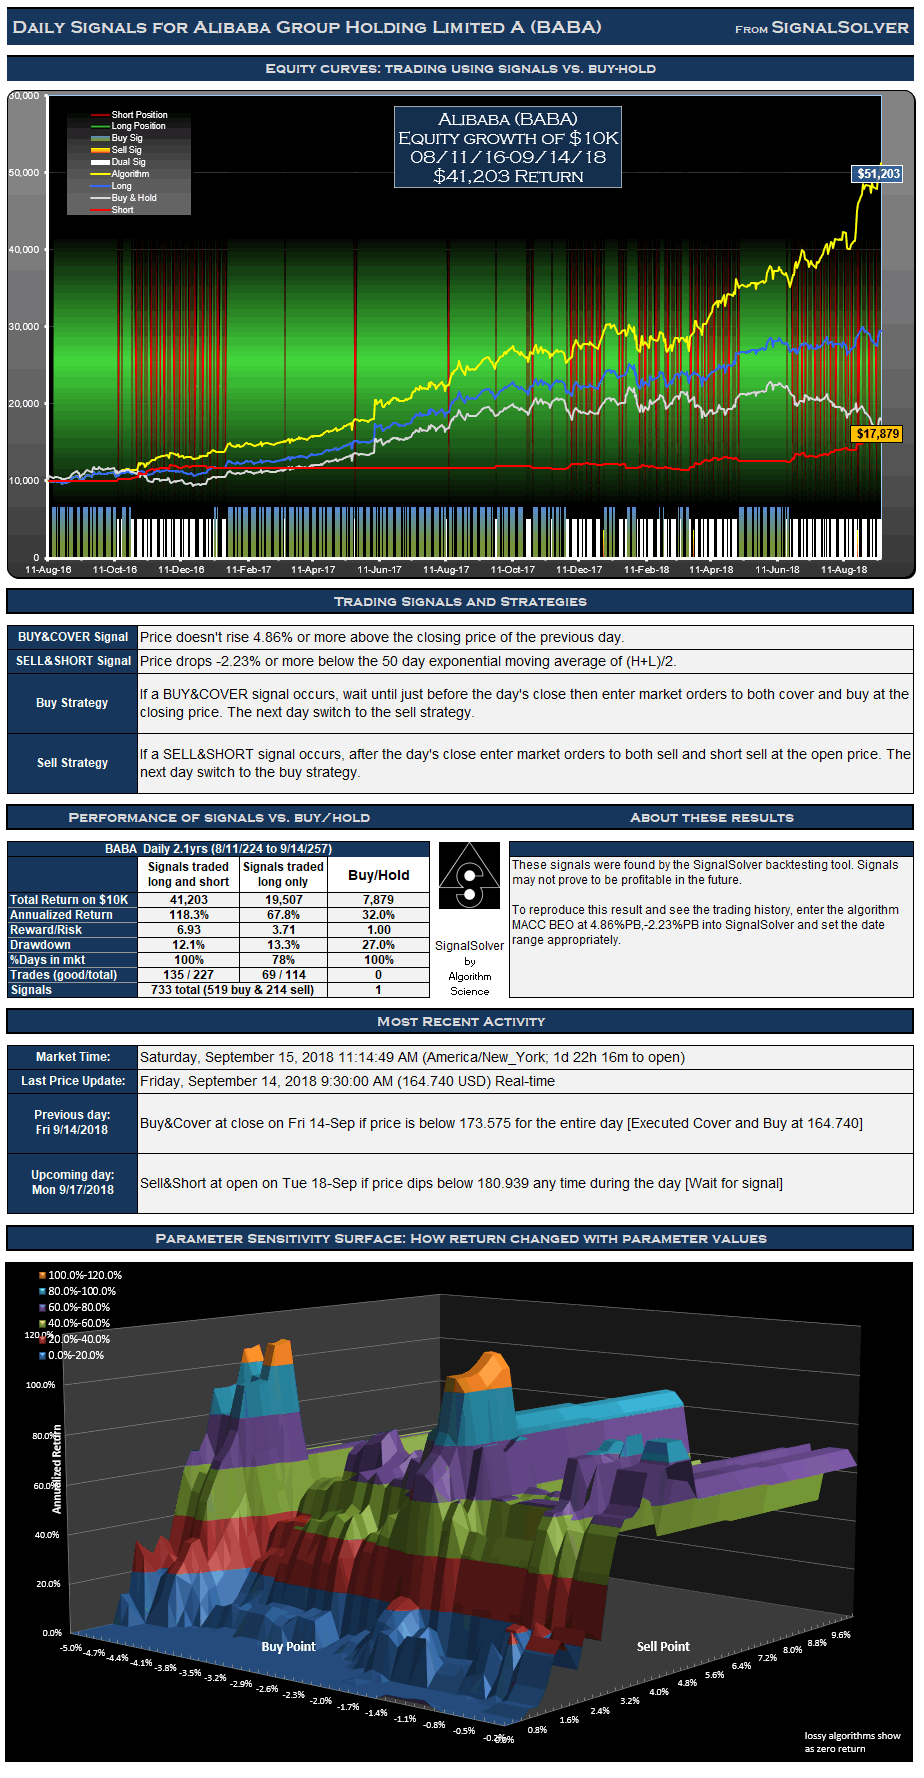
From 11-Aug-16 to 14-Sep-18, these trading signals for Alibaba (BABA) used as directed would have performed around 5.2 times better than buy-hold.

Alibaba (BABA) Daily Signals

These trading signals for BABA were selected from over a million backtest results for their reward/risk and parameter sensitivity characteristics.While backtests don't always provide reliable signals which can be counted on moving forward, many traders find value in knowing what buy and sell signals would have worked well in the past.

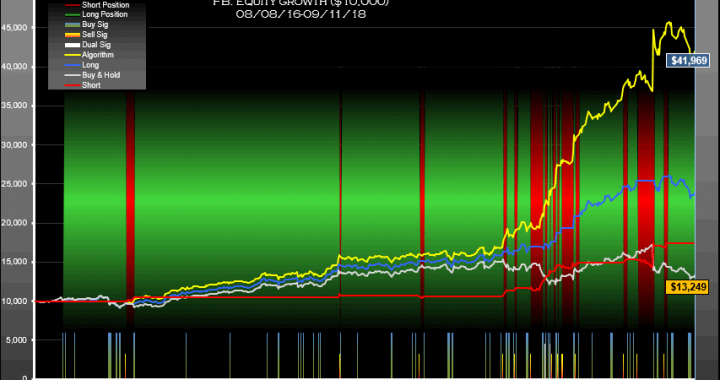
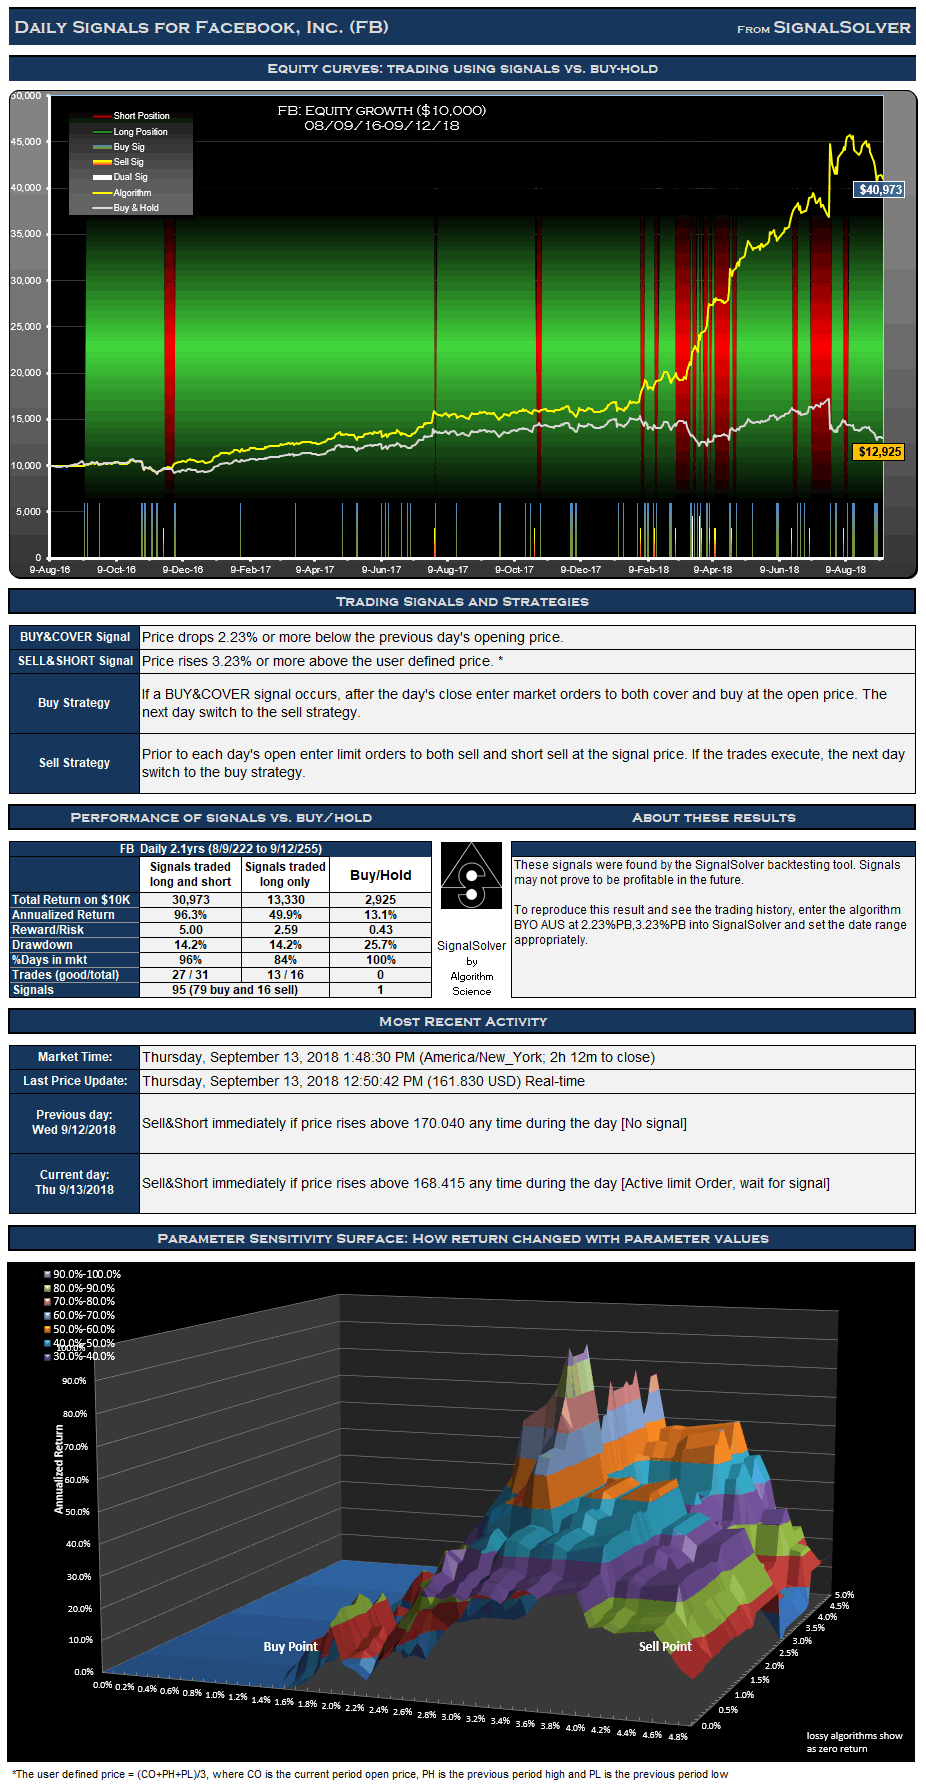
For the 528 day (2.1 year) period from Aug 11 2016 to Sep 14 2018, these signals for Alibaba (BABA) traded both long and short would have yielded $41,203 in profits from a $10,000 initial investment, an annualized return of 118.3%. Traded long only (no short selling) the signals would have returned $19,507, an annualized return of 67.8%. 78.0% of time was spent holding stock long. If you had bought and held the stock for the same period the profit would have been $7,879 (an annualized return of 32.0%).

For this type of strategy, not every signal is acted upon and signals are often reinforced. If you are long in the security, buy signals can be ignored, for example. Similarly if you are short you can ignore sell signals. For this particular BABA strategy there were 519 buy buy signals and 214 sell sell signals.These led to 114 round trip long trades of which 69 were profitable, and 113 short trades of which 66 were profitable. This is a daily strategy; daily OHLC data is used to derive all signals and there is at most one buy and sell signal and one trade per day.

Drawdown (the worst case loss for an single entry and exit into the strategy) was 12% for long-short and 13% for long only, compared to 27% for buy-hold. Using drawdown plus 5% as our risk metric, and annualized return as the reward metric, the reward/risk for the trading long and short was 6.93 vs. 1.00 for buy-hold, an improvement factor of around 6.9 If traded long only, the reward/risk was 3.71

The backtests assume a commission per trade of $7.

Facebook (FB) Signals – Daily

From 09-Aug-16 to 12-Sep-18, these trading signals for Facebook (FB) used as directed would have performed around 10.6 times better than buy-hold.

Facebook (FB) Signals-Daily

These trading signals for FB were selected from over a million backtest results for their reward/risk and parameter sensitivity characteristics. While backtests don't always provide reliable signals which can be counted on moving forward, many traders find value in knowing what buy and sell signals would have worked well in the past.

For the 528 day (2.1 year) period from Aug 9 2016 to Sep 12 2018, these signals for Facebook, Inc. (FB) traded both long and short would have yielded $30,973 in profits from a $10,000 initial investment, an annualized return of 96.3%. Traded long only (no short selling) the signals would have returned $13,330, an annualized return of 49.9%. 83.5% of time was spent holding stock long. If you had bought and held the stock for the same period the profit would have been $2,925 (an annualized return of 13.1%).

For this type of strategy, not every signal is acted upon and signals are often reinforced. If you are long in the security, buy signals can be ignored, for example. Similarly if you are short you can ignore sell signals. For this particular FB strategy there were 79 buy signals and 16 sell signals.These led to 16 round trip long trades of which 13 were profitable, and 15 short trades of which 14 were profitable. This is a daily strategy; daily OHLC data is used to derive all signals and there is at most one buy and sell signal and one trade per day.

Drawdown (the worst case loss for an single entry and exit into the strategy) was 14% for long-short and 14% for long only, compared to 26% for buy-hold. Using drawdown plus 5% as our risk metric, and annualized return as the reward metric, the reward/risk for the trading long and short was 5.00 vs. 0.43 for buy-hold, an improvement factor of around 11.8. If traded long only, the reward/risk was 2.59.

The backtests assume a commission per trade of $7.

AMZN Equity

AMZN (Amazon) Signals – Monthly

From Jul 2008 to Aug 2018, these trading signals for Amazon (AMZN) used as directed would have performed around 744 times better than buy-hold.

AMZN Signals Monthly

For the 255 month (21.2 year) period from May 1 1997 to Jul 31 2018, these signals for Amazon.com, Inc. (AMZN) traded long and short would have yielded $5,434,919,985 in profits from a $10,000 initial investment, an annualized return of 86.6%. The long-side profit (buy/sell only, no shorts) for the signals was $462,171,488, an annualized return of 66.1%. If you had bought and held the stock for the same period the profit would have been $7,308,974 (an annualized return of 36.6%). The trading style was Long & Short, meaning that you would be long or short the security at all times.

For this type of strategy, not every signal is acted upon and signals are often reinforced. If you are long in the security, buy signals can be ignored, for example. Similarly if you are short you can ignore sell signals. For this particular AMZN strategy there were 150 buy signals and 53 sell signals.These led to 34 long trades of which 22 were profitable, and 33 short trades of which 22 were profitable.

This is a monthly strategy; monthly OHLC data is used to derive all signals and there is at most one buy and sell signal and one trade per month. Drawdown (the worst case loss for an single entry and exit into the strategy) was 46% vs. 93% for buy-hold. Using drawdown plus 5% as our risk metric, and annualized return as the reward metric, the reward/risk for the strategy was 1.70 vs. 0.37 for buy-hold, an improvement factor of around 4.6

BABA Equity

BABA (Alibaba) Signals – Weekly

From Jul 2008 to Aug 2018, these trading signals for Alibaba (BABA) used as directed would have performed around 14 times better than buy-hold.

These trading signals for BABA were selected from 1,173,290 backtest results for their reward/risk and parameter sensitivity characteristics.While backtests don't always provide reliable signals which can be counted on moving forward, many swing traders find value in knowing what buy and sell signals could have been used in the past.

For the 205 week (3.9 year) period from Sep 15 2014 to Aug 17 2018, these signals for Alibaba Group Holding Limited A (BABA) traded long and short would have yielded $152,176 in profits from a $10,000 initial investment, an annualized return of 103.9%. The long-side profit (buy/sell only, no shorts) for the signals was $50,880, an annualized return of 58.7%. If you had bought and held the stock for the same period the profit would have been $8,902 (an annualized return of 17.7%). The trading style was Long & Short, meaning that you would be long or short the security at all times.

For this type of strategy, not every signal is acted upon and signals are often reinforced. If you are long in the security, buy signals can be ignored, for example. Similarly if you are short you can ignore sell signals. For this particular BABA strategy there were 16 buy signals and 30 sell signals.These led to 12 long trades of which 9 were profitable, and 12 short trades of which 11 were profitable.

This is a weekly strategy; weekly OHLC data is used to derive all signals and there is at most one buy and sell signal and one trade per week. Drawdown (the worst case loss for an single entry and exit into the strategy) was 20% vs. 50% for buy-hold. Using drawdown plus 5% as our risk metric, and annualized return as the reward metric, the reward/risk for the strategy was 4.16 vs. 0.32 for buy-hold, an improvement factor of around 13.0

GOOGL (Alphabet Inc.) Signals – Weekly

These Alphabet Inc. GOOGL signals were selected from 1,240,000 backtest results for their reward/risk and parameter sensitivity characteristics. While backtests don't typically provide reliable signals which can always be counted on moving forward, many swing traders find value in knowing what buy and sell signals would have worked over time.

GOOGL Signals Weekly

For the 528 week (10.1 year) period from Jul 7 2008 to Aug 17 2018, these signals for Alphabet Inc. (GOOGL) traded as directed would have yielded $525,656 in profits from a $10,000 initial investment, an annualized return of 48.3%. The long-side profit (buy/sell only, no shorts) for the signals was $175,257, an annualized return of 33.5%. If you had bought and held the stock for the same period the profit would have been $35,599 (an annualized return of 16.2%). The trading style was Long & Short, meaning that you would be long or short the security at all times.

For this type of strategy, not every signal is acted upon and signals are often reinforced. If you are long in the security, buy signals can be ignored, for example. Similarly if you are short you can ignore sell signals. For this particular GOOGL strategy there were 471 buy signals and 101 sell signals.These led to 68 long trades of which 54 were profitable, and 67 short trades of which 41 were profitable.

This is a weekly strategy; weekly OHLC data is used to derive all signals and there is at most one buy and sell signal and one trade per week. Drawdown (the worst case loss for an single entry and exit into the strategy) was 36% vs. 50% for buy-hold. Using drawdown plus 5% as our risk metric, and annualized return as the reward metric, the reward/risk for the strategy was 1.18 vs. 0.29 for buy-hold, an improvement factor of around 4.0

MSFT Signals Weekly Equity

MSFT (Microsoft) Signals – Weekly

These trading signals for MSFT were selected from 1,220,000 backtest results for their reward/risk and parameter sensitivity characteristics. While backtests don't typically provide reliable signals which can always be counted on moving forward, many swing traders find value in knowing what buy and sell signals would have worked over time.

MSFT Signals Weekly

For the 528 week (10.1 year) period from Jul 7 2008 to Aug 17 2018, these signals for Microsoft Corporation (MSFT) traded as directed would have yielded $396,274 in profits from a $10,000 initial investment, an annualized return of 44.3%. The long-side profit (buy/sell only, no shorts) for the signals was $141,145, an annualized return of 30.8%. If you had bought and held the stock for the same period the profit would have been $43,187 (an annualized return of 18.0%). The trading style was Long & Short, meaning that you would be long or short the security at all times.

For this type of strategy, not every signal is acted upon and signals are often reinforced. If you are long in the security, buy signals can be ignored, for example. Similarly if you are short you can ignore sell signals. For this particular MSFT strategy there were 364 buy signals and 273 sell signals.These led to 148 long trades of which 107 were profitable, and 147 short trades of which 104 were profitable.

This is a weekly strategy; weekly OHLC data is used to derive all signals and there is at most one buy and sell signal and one trade per week. Drawdown (the worst case loss for an single entry and exit into the strategy) was 27% vs. 44% for buy-hold. Using drawdown plus 5% as our risk metric, and annualized return as the reward metric, the reward/risk for the strategy was 1.40 vs. 0.36 for buy-hold, an improvement factor of around 3.8

FB Signals Weekly Equity

FB (Facebook) Signals – Weekly

These trading signals for FB were selected from 1,210,488 backtest results for their reward/risk and parameter sensitivity characteristics. While backtests don't typically provide reliable signals which can be counted on moving forward, many swing traders are curious as to what buy and sell signals would have worked up until now.

FB Signals Weekly

For the 327 week (6.2 year) period from May 14 2012 to Aug 17 2018, these signals for Facebook, Inc. (FB) traded as directed would have yielded $494,263 in profits from a $10,000 initial investment, an annualized return of 87.3%. The long-side profit (buy/sell only, no shorts) for the signals was $170,258, an annualized return of 58.9%. If you had bought and held the stock for the same period the profit would have been $31,389 (an annualized return of 25.5%). The trading style was Long & Short, meaning that you would be long or short the security at all times.

For this type of strategy, not every signal is acted upon and signals are often reinforced. If you are long in the security, buy signals can be ignored, for example. Similarly if you are short you can ignore sell signals. For this particular FB strategy there were 320 buy signals and 31 sell signals.These led to 24 long trades of which 18 were profitable, and 24 short trades of which 19 were profitable.

This is a weekly strategy; weekly OHLC data is used to derive all signals and there is at most one buy and sell signal and one trade per week. Drawdown (the worst case loss for an single entry and exit into the strategy) was 22% vs. 57% for buy-hold. Using drawdown plus 5% as our risk metric, and annualized return as the reward metric, the reward/risk for the strategy was 3.20 vs. 0.41 for buy-hold, an improvement factor of around 7.8 .

NFLX Signals Weekly Equity

NFLX (Netflix) Signals Weekly

NFLX Signals (Weekly)

NFLX Signals (Weekly)

For the 528 week (10.1 year) period from Jul 7 2008 to Aug 17 2018, these signals for Netflix, Inc. (NFLX) traded long and short would have yielded $38,786,358 in profits from a $10,000 initial investment, an annualized return of 126.6%. The long-side profit (buy/sell only, no shorts) for the signals was $7,434,281, an annualized return of 92.5%. If you had bought and held the stock for the same period the profit would have been $790,902 (an annualized return of 54.3%). The trading style was Long & Short, meaning that you would be long or short the security at all times.

For this type of strategy, not every signal is acted upon and signals are often reinforced. If you are long in the security, buy signals can be ignored, for example. Similarly if you are short you can ignore sell signals. For this particular NFLX strategy there were 276 buy signals and 44 sell signals.These led to 27 long trades of which 18 were profitable, and 26 short trades of which 19 were profitable.

This is a weekly strategy; weekly OHLC data is used to derive all signals and there is at most one buy and sell signal and one trade per week. Drawdown (the worst case loss for an single entry and exit into the strategy) was 45% vs. 82% for buy-hold. Using drawdown plus 5% as our risk metric, and annualized return as the reward metric, the reward/risk for the strategy was 2.53 vs. 0.63 for buy-hold, an improvement factor of around 4.0

AAPL Signals Weekly Equity

AAPL (Apple) Signals – Weekly

AAPL Signals (Weekly)

AAPL Signals (Weekly)

For the 528 week (10.1 year) period from Jul 7 2008 to Aug 17 2018, these signals for Apple Inc. (AAPL) traded long and short would have yielded $1,024,775 in profits from a $10,000 initial investment, an annualized return of 58.3%. The long-side profit (buy/sell only, no shorts) for the signals was $414,729, an annualized return of 44.9%. If you had bought and held the stock for the same period the profit would have been $119,789 (an annualized return of 28.9%). The trading style was Long & Short, meaning that you would be long or short the security at all times.

For this type of strategy, not every signal is acted upon and signals are often reinforced. If you are long in the security, buy signals can be ignored, for example. Similarly if you are short you can ignore sell signals. For this particular AAPL strategy there were 325 buy signals and 22 sell signals.These led to 20 long trades of which 19 were profitable, and 19 short trades of which 11 were profitable.

This is a weekly strategy; weekly OHLC data is used to derive all signals and there is at most one buy and sell signal and one trade per week. Drawdown (the worst case loss for an single entry and exit into the strategy) was 40% vs. 54% for buy-hold. Using drawdown plus 5% as our risk metric, and annualized return as the reward metric, the reward/risk for the strategy was 1.30 vs. 0.49 for buy-hold, an improvement factor of around 2.7. Prices have been adjusted to account for 1 split. Returns have been adjusted for the worst case effects of 25 dividends.

AMZN Signals Weekly Equity

AMZN (Amazon) Signals – Weekly

AMZN Signals (Weekly)

AMZN Signals (Weekly)

For the 528 week (10.1 year) period from Jul 7 2008 to Aug 17 2018, these trading signals for Amazon.com, Inc. (AMZN) would have yielded $1,951,107 in profits from a $10,000 initial investment, an annualized return of 68.6%. If you had bought and held the stock for the same period the profit would have been $251,237 (an annualized return of 38.1%).

The trading style was Long & Short, meaning that you would be long or short the security at all times. For this type of strategy, not every signal is acted upon and signals are often reinforced. If you are long in the security, buy signals can be ignored, for example. Similarly if you are short you can ignore sell signals. For this particular AMZN strategy there were 198 buy signals and 55 sell signals.These led to 42 long trades of which 34 were good, and 41 short trades of which 21 were good.

This is a weekly strategy, which means that weekly OHLC data is used to derive all signals and there is at most one buy and sell signal and one trade per week. Drawdown (the worst case loss for an single entry and exit into the strategy) was 29% vs. 55% for buy-hold. Using drawdown plus 5% as our risk metric, and annualized return as the reward metric, the reward/risk for the strategy was 2.01 vs. 0.64 for buy-hold, an improvement factor of around 3.2