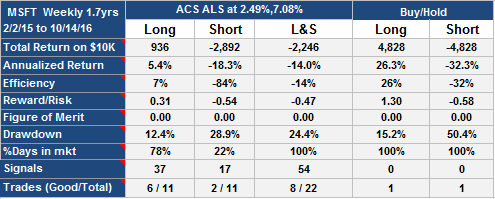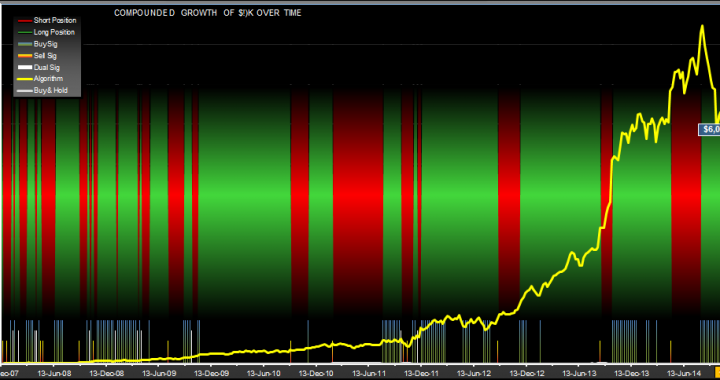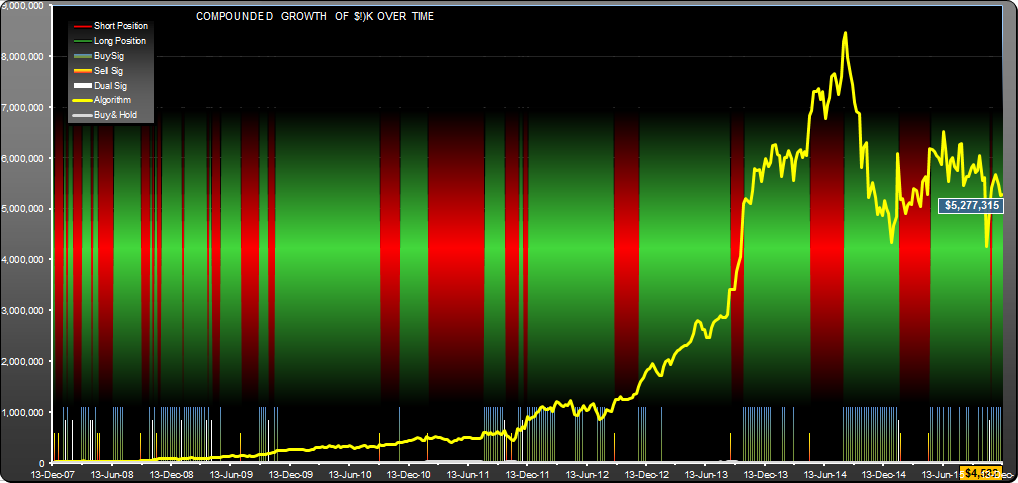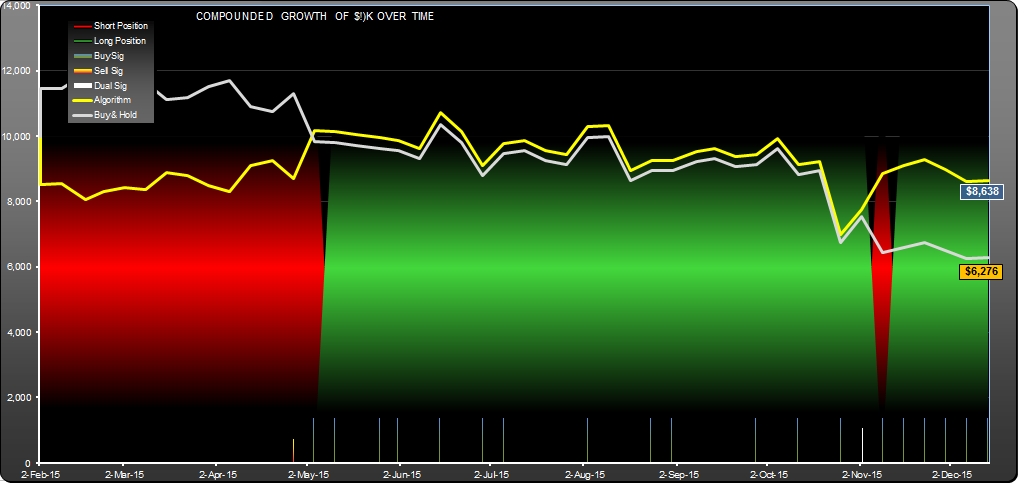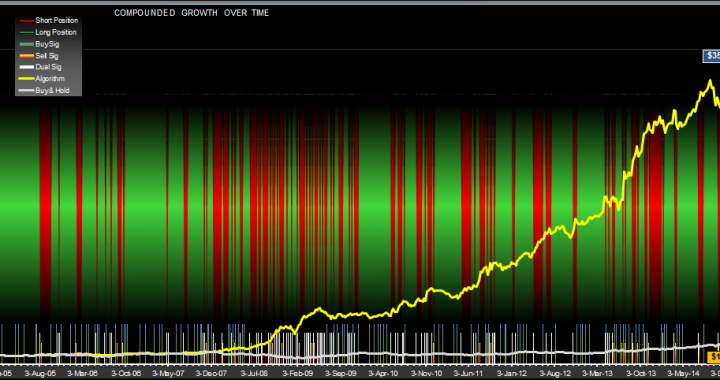
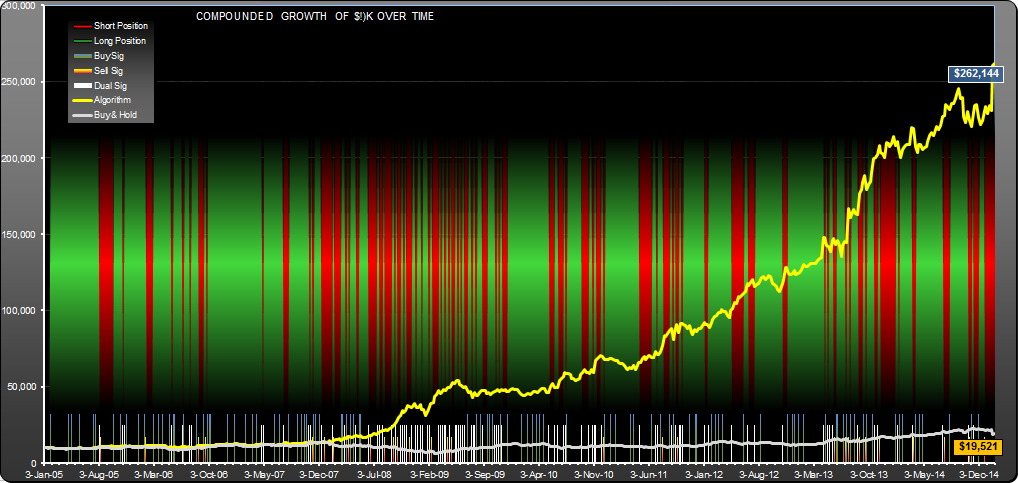
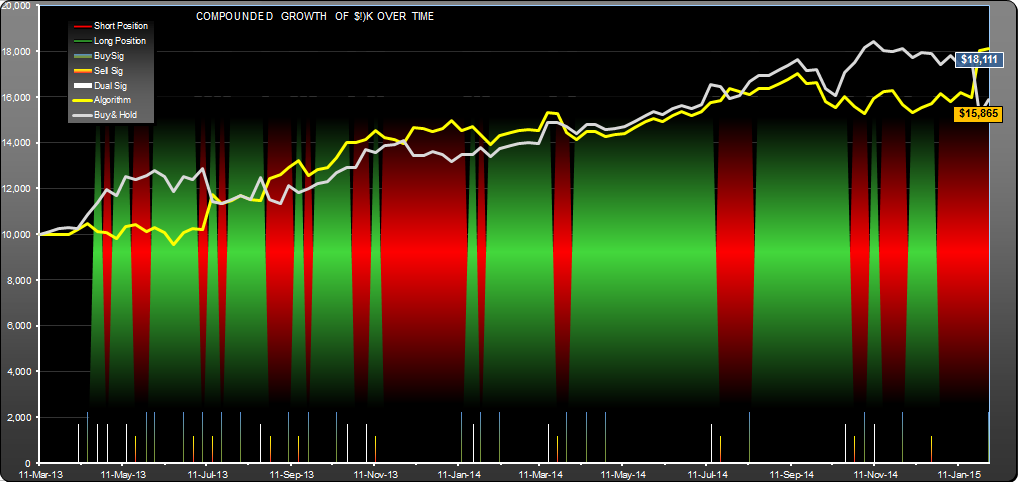
This graph shows the equity curve of the trading system for Microsoft (MSFT) over a ten year period, 1/3/05 to 2/6/15 for a $10K initial investment. The value increased to $262,144 vs. $19,521 for buy-hold. The background bands show if the stock was held long (green) or short (red). Note that most of the sell signals (shown at the bottom) are also dual signals as a buy signal generally occurs in the same time period. This is common with this kind of trading strategy.
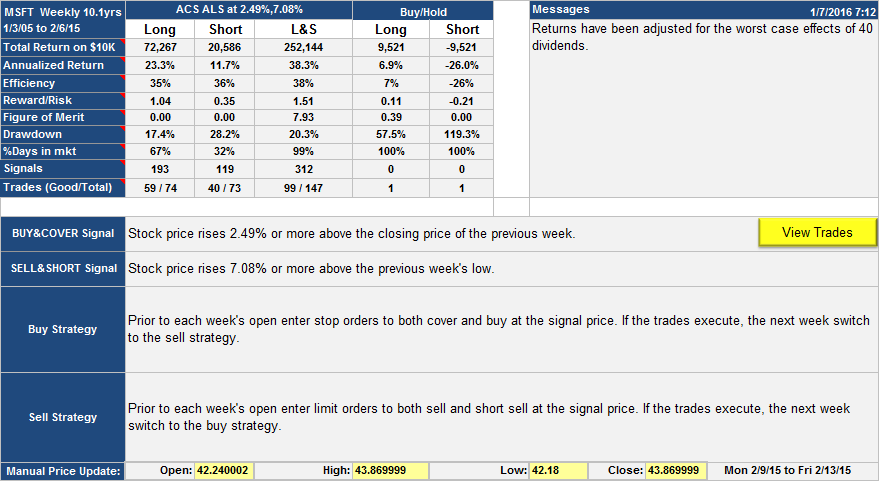
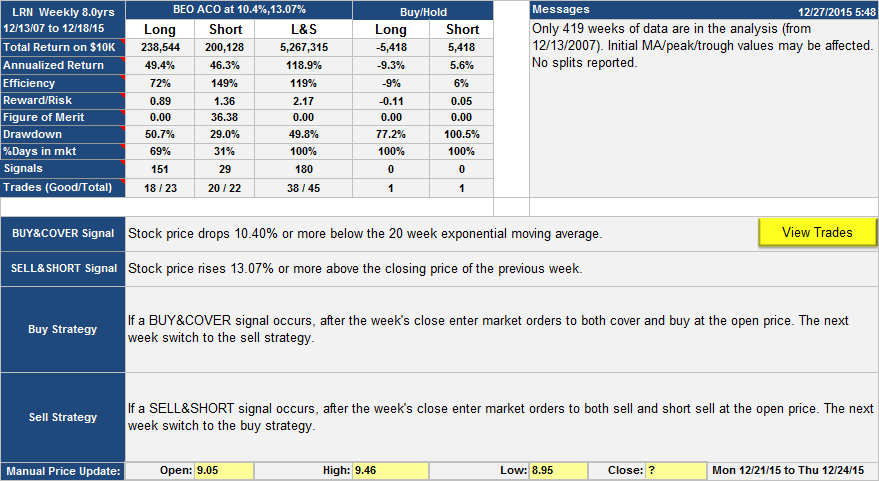
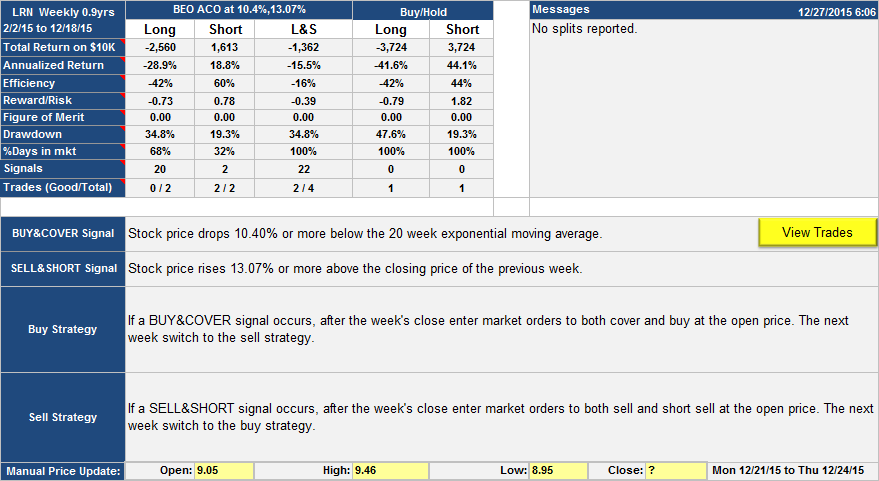
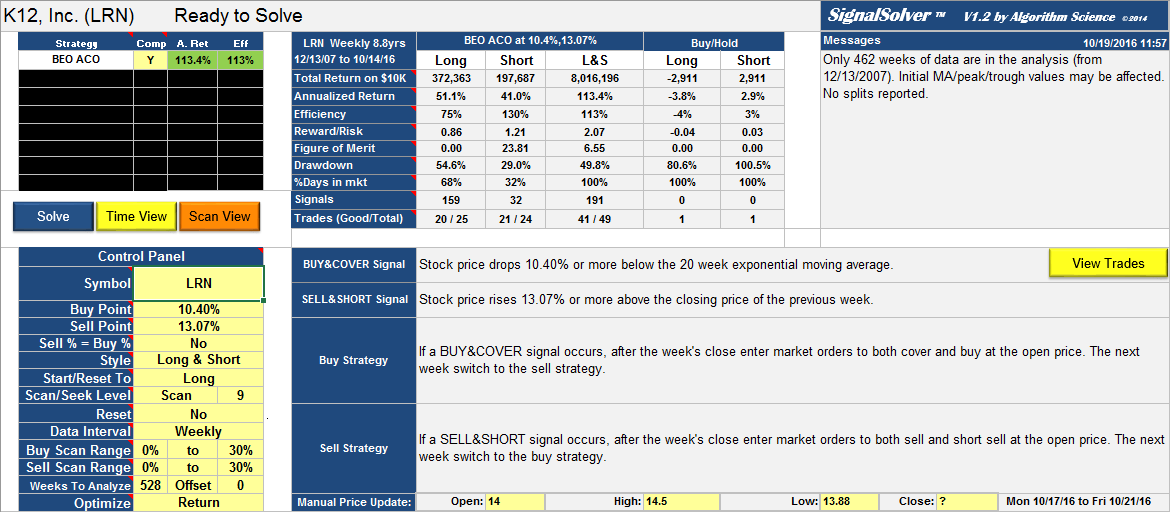
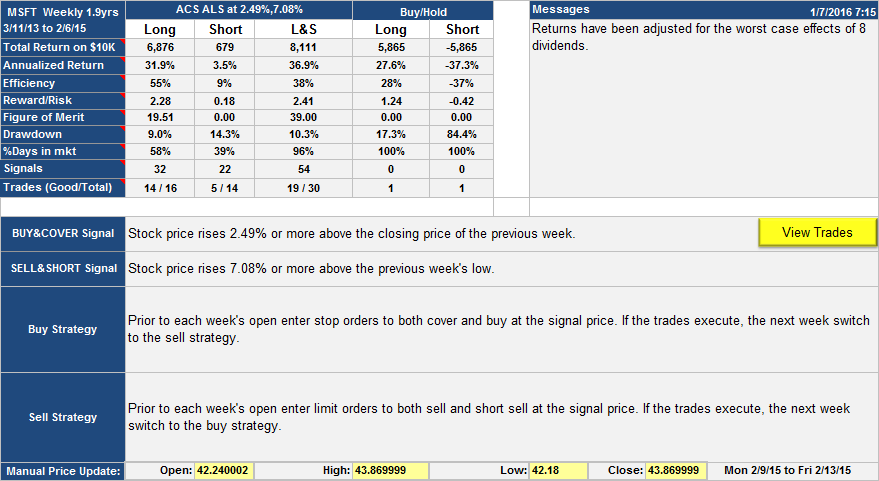
The trading strategy works off weekly data, so it trades at most once a week and uses stop cover/buys and limit short/sells. The L&S column shows results for trading both Long and Short. Drawdown (20%) was much better than for buy-hold (57%).
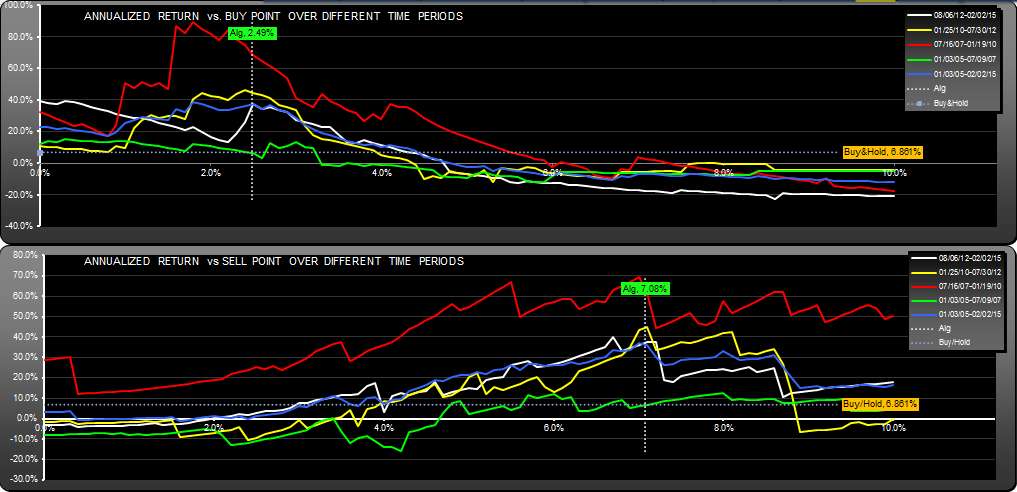
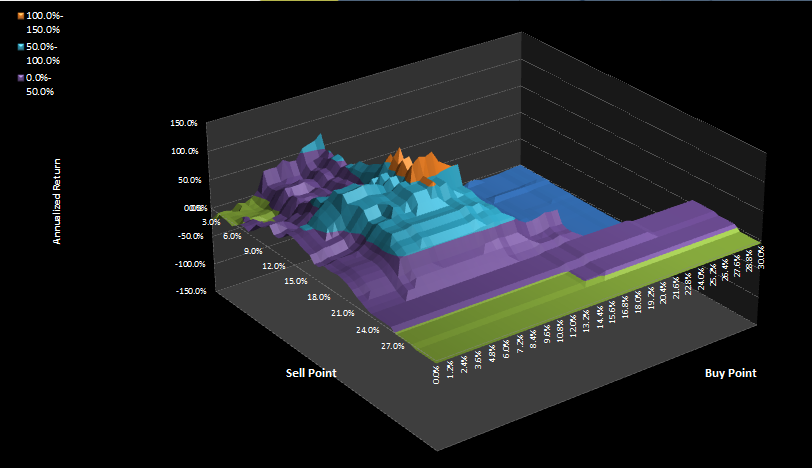
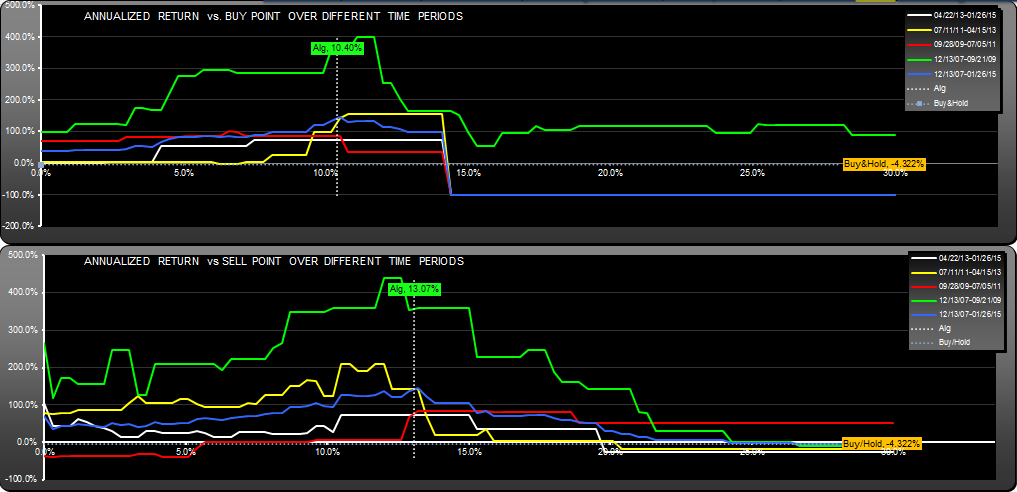
Here we compare the returns over different time periods, as they change with buy and sell point. We look for algorithms which give consistent returns–this one has one period of high returns (the red lines) and a period of returns similar to buy-hold (the green lines). Overall the returns were good (the blue lines).
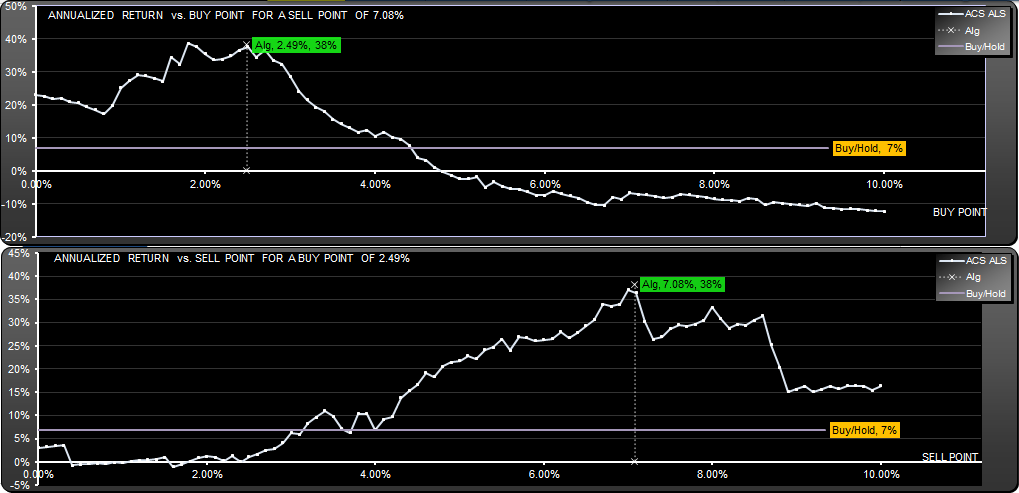
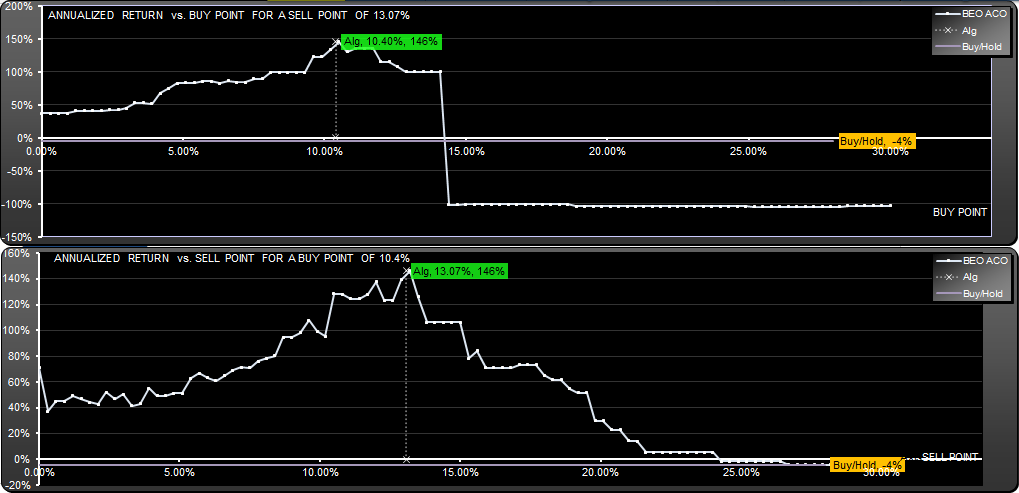
Plotting how returns change with buy and sell points gives us an idea how sensitive the algorithms are to changes in parameters. Here we see two broad peaks indicating that the algorithms are not overly sensitive to changes in parameters. In fact this buy point was profitable for all values of sell point from 2.5% to 10%.
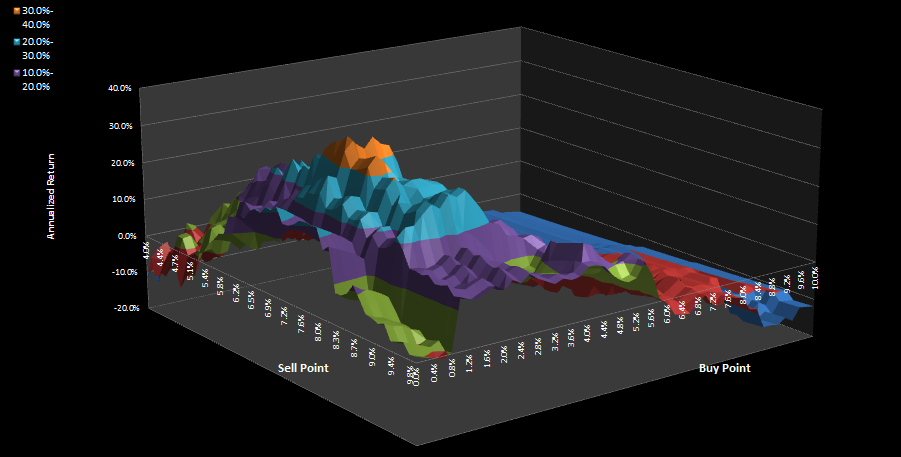
In the surface plot of return vs. buypoint/sellpoint we are looking for high ground, not too close to cliffs or valleys. For this algorithm there is a distinct hill feature showing a fairly stable exploit region.
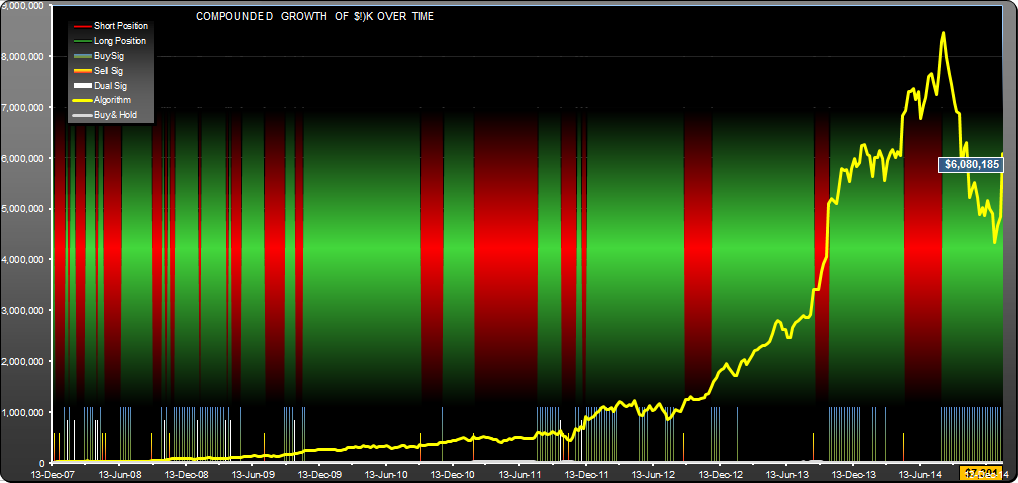
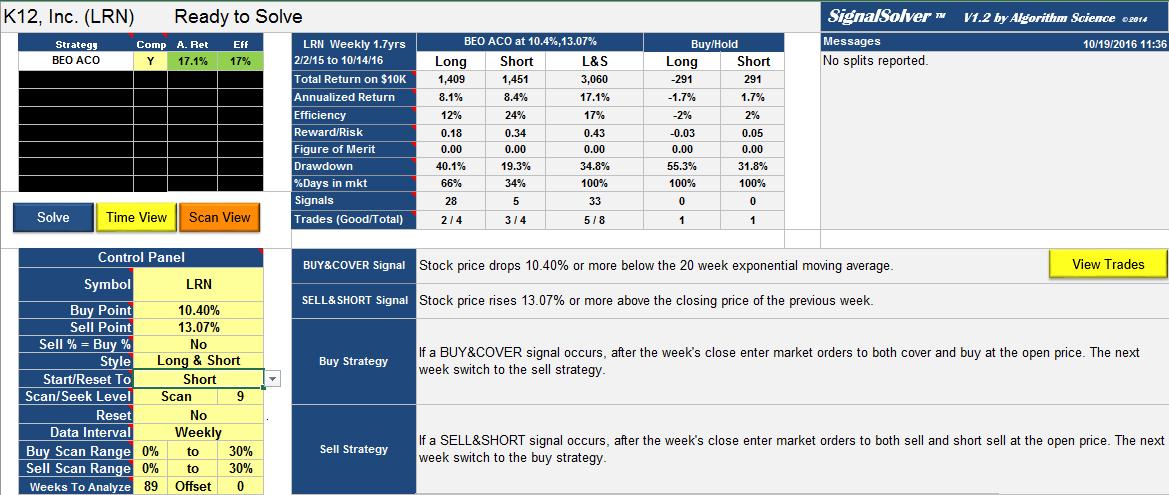
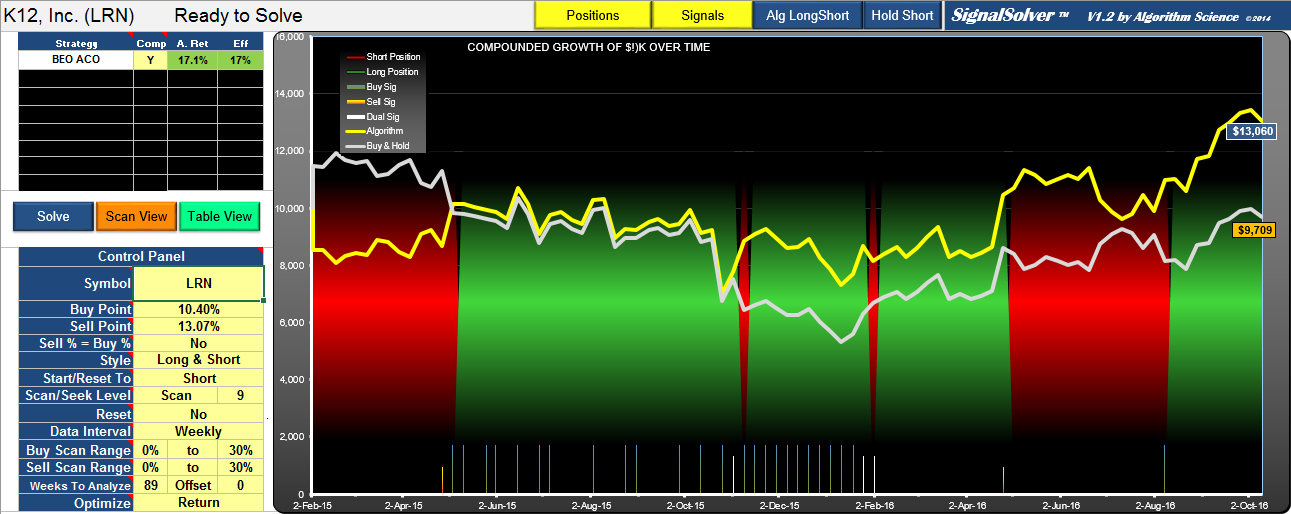
Looking at 100 week performance for the same algorithm shows an improvement over buy-hold and better drawdown, although the equity curve (below) is similar.
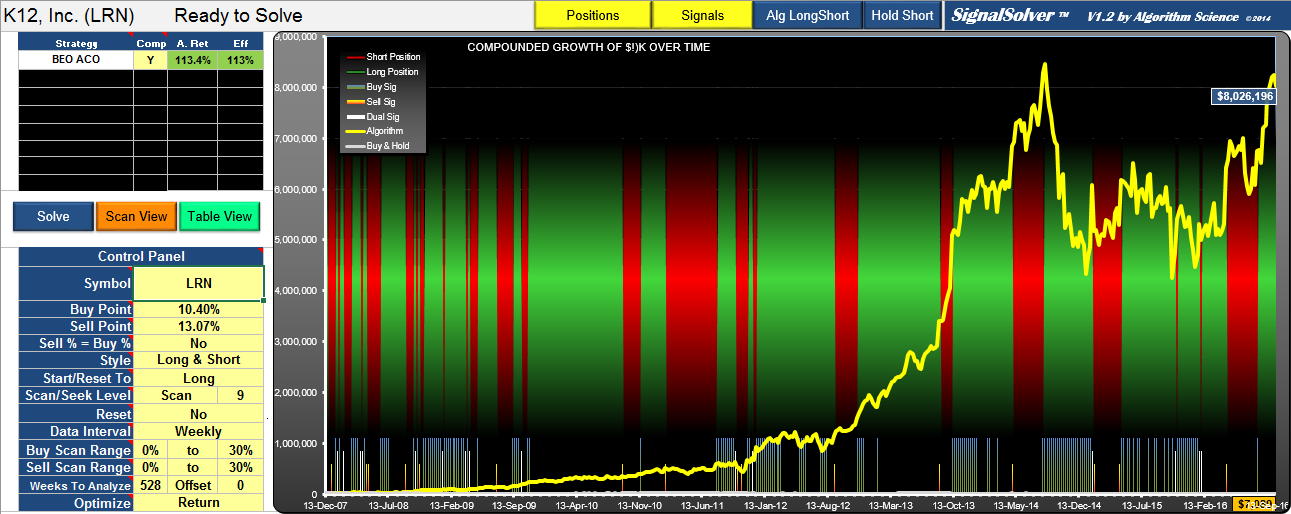
Update 10/19/2016
This strategy has lost around 22% since inception, the underlying stock has gained 48%.