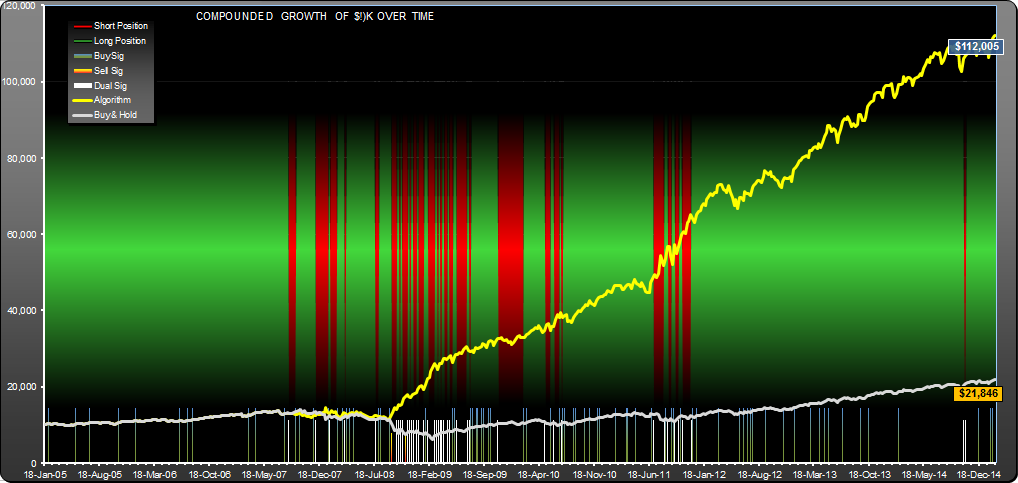
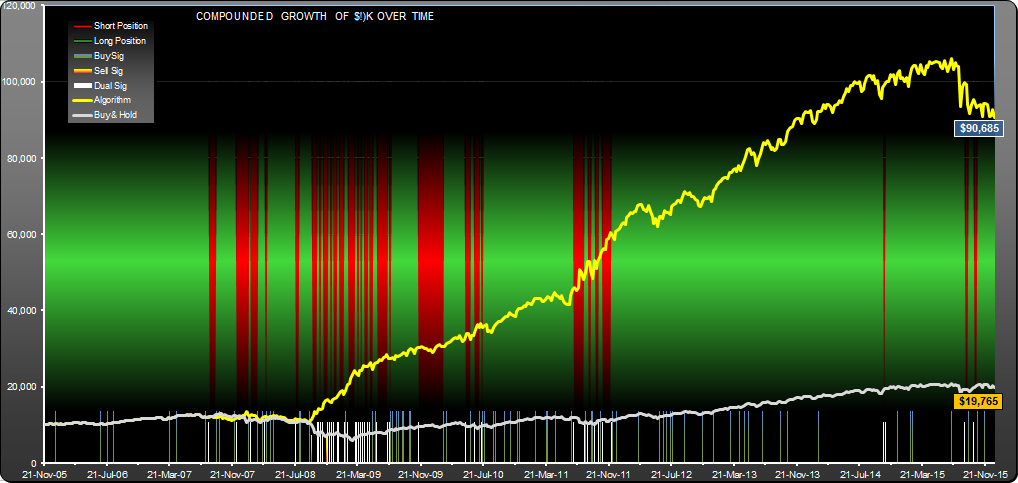
Trading strategy for SPY with a weekly setup. The strategy (yellow line) returned $102,005 over a 10 year period for a $10K initial investment. Buy and hold returned $11,846. Trading signals were reinforcing--note that every week with a sell signal also had a buy signal.
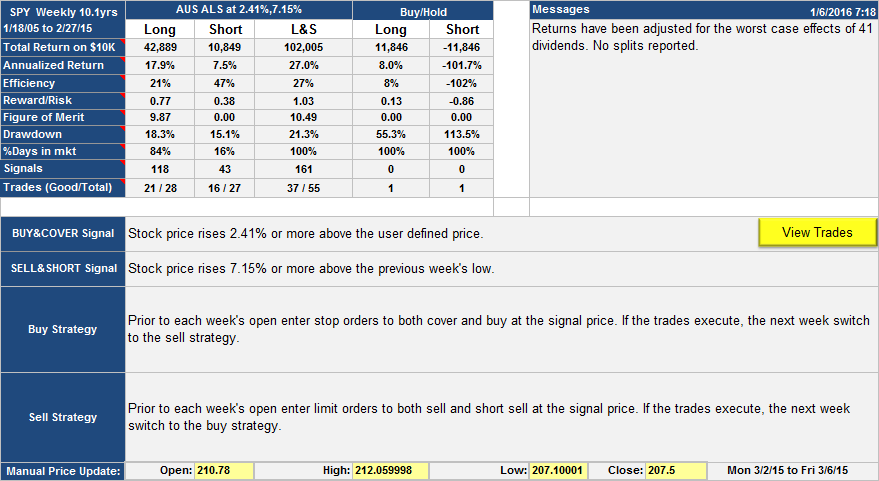
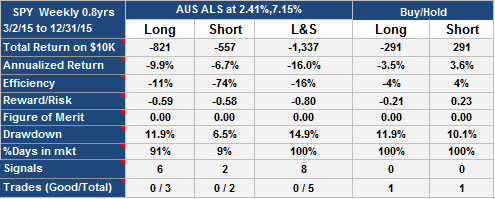
SPY Weekly, tabular view of the backtest. Trading strategy gave 27% annualized return vs. 8% for buy-hold. Reward/risk was around 7x better for the strategy. Note that the "user defined" referred to in the buy signal is the average of the current weeks open price, the previous week's high and the previous week's low. Also of note, drawdown was only 21.3% (Sept '08) vs. 55.3% for buy-hold (March '09).
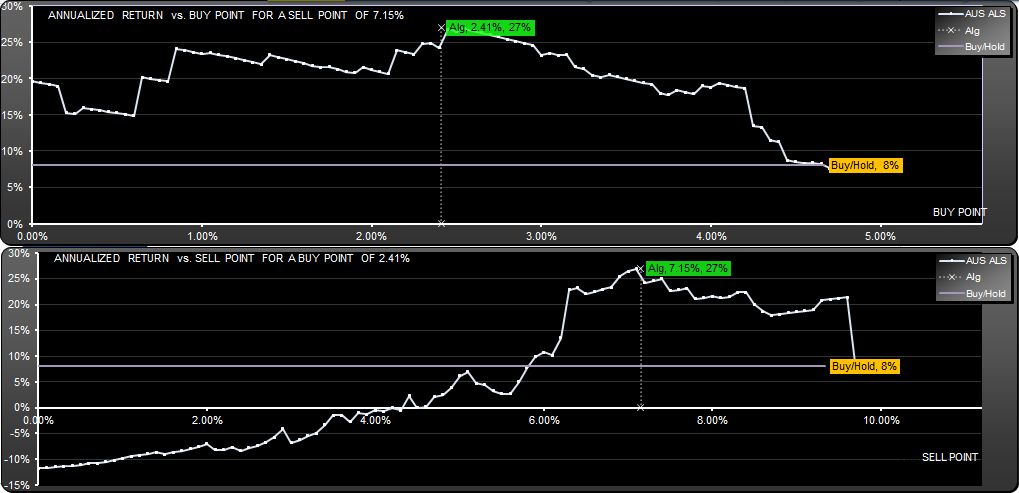
Charts show how annualized return varies with buy/sell point (for a fixed sell/buy point). For a sell point of 7.15% all buy points 0-6.5% were profitable. For a buy point of 2.41%, all sell points in the range 4.1%-9.6% were profitable.
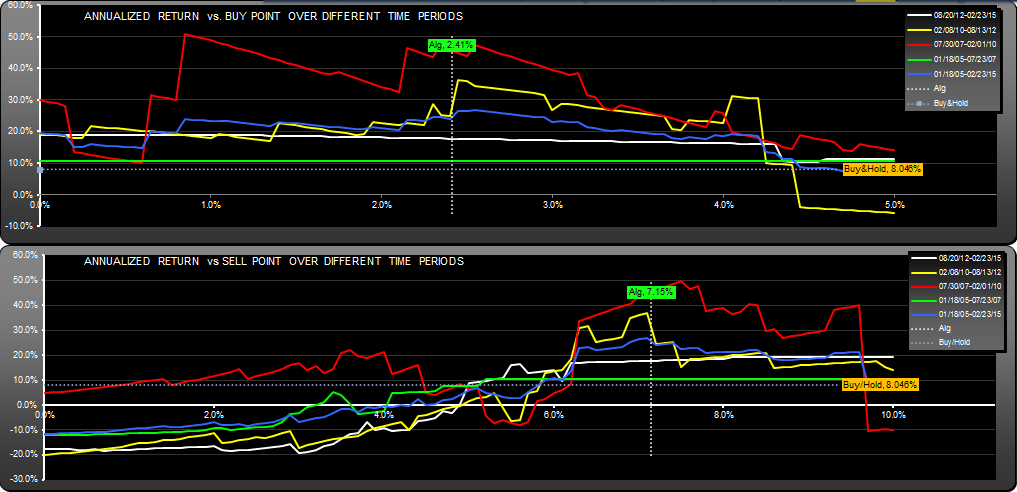
This chart shows return of the algorithm for different time periods, and how they change with buy and sell point. The green line (1/05 to 7/07) shows little improvement over buy-hold. The white line (8/12 to present) is distinctly lower showing a tailing off in performance in recent times. In fact, the algorithm has sub-performed buy-hold for the last 3 years, by a small margin. You can see from the time chart that the algorithm has stayed mostly long for 3 years. Some may like this behavior; an algorithm that stays largely out of the way in the good times. Others may argue that the algorithm fails to exploit recent price fluctuations.
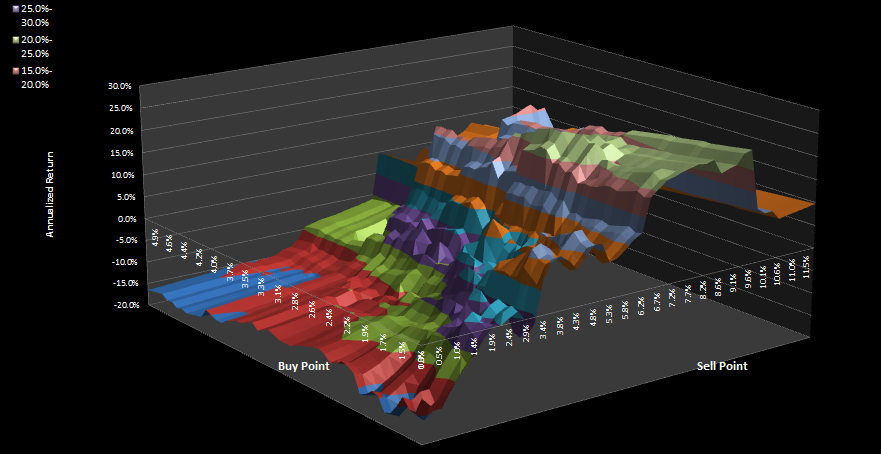
SPY weekly, surface plot. Shows how return varies with changing buy and sell point percentages. The area of interest is the plateau. It is wide with few cliffs which is what you want to see.
Update Jan 6th 2016
This algorithm began to break down around Aug 10th. Since publication it has lost around 16%.
Update Oct 19th 2016
Still unspectacular performance from this:

SPY Trading Strategy (Weekly), Update 10-19-2016
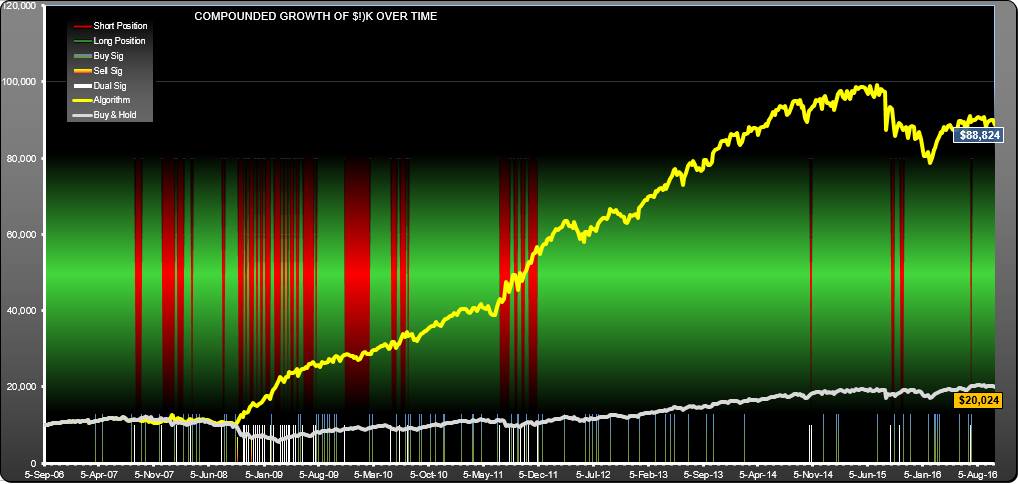
SPY Trading Strategy (Weekly) Update Oct 19 2016 Equity
Update 5/26/2015:
Since publication 2/26/2015, the strategy has stayed long with no trades, gaining 1.42%(6.1% annualized)
Andrew
Hi Andrew,
I recently came across your website and it is very informative. I am especially interested in the SPY Weekly system as I currently trade a monthly system.
One question: when Shorting SPY, is the only rule to Short when SPY rises 7.15% or more above the previous week’s low? Or are there any other Short rules – e.g. Short when SPY falls X% below the previous week’s high?
Thanks,
Malcolm
Hi Malcolm
No, the only rule is to sell and short when SPY rises 7.15% or more above the previous week’s low.
The last buy I show is the week of 27th Oct 2014. Since then there has been no sell/short, and the gains have been flat since publication last Feb.
Andrew
Thank you, Andrew.
Update 8/28/15:
The strategy has been long since publication on 2/23. SPY has lost around 5% in that time.