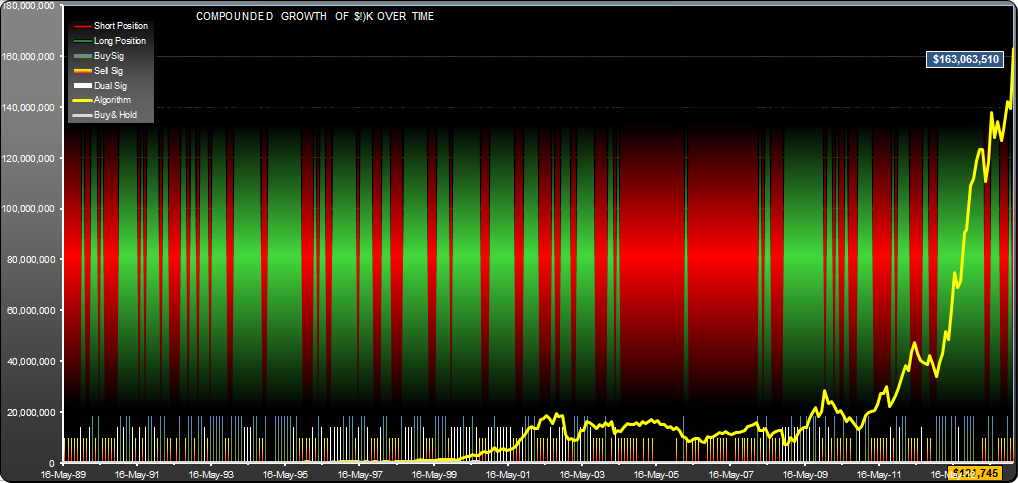
Micron Technology (MU) trading strategy base on monthly OHLC data. Would have returned $153,063,510 for a $10K initial investment. B/H returned $111,745 over the same period (5/16/89 to 2/2/15). Signals (at bottom of graph) generally show good reinforcement with occasional periods of confusion. Background red/green stripes show short/long hold periods
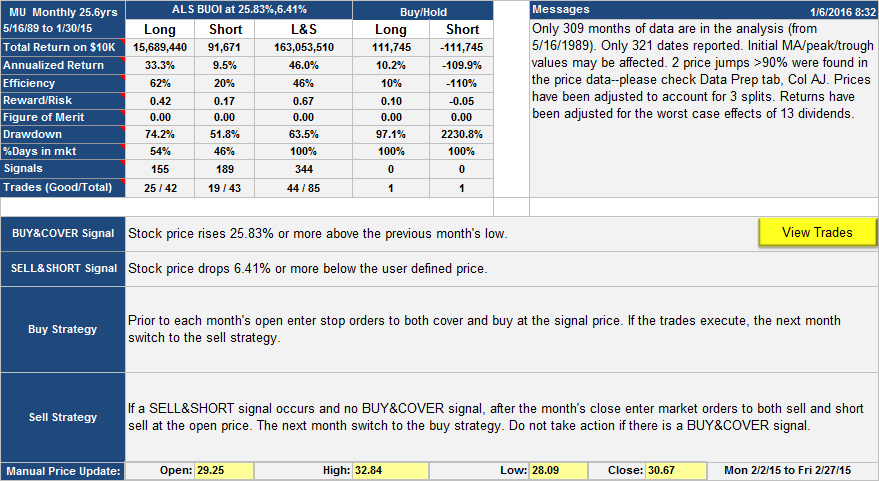
MU Monthly. Annualized return for this trading strategy was 46% vs 10.2% for buy/hold. Drawdown was a disconcerting 97.1% for buy/hold in Dec 2009, vs. 57% in Sept 2006 for the trading strategy. The price jumps reported were 50% drops in '87 and '00. The "user defined price" referred to in the strategy is the open price of the current month plus the high and low price of the previous month, divided by 3. Reward-risk was 6.7 times better than B/H using return/drawdown+10% as the yardstick.
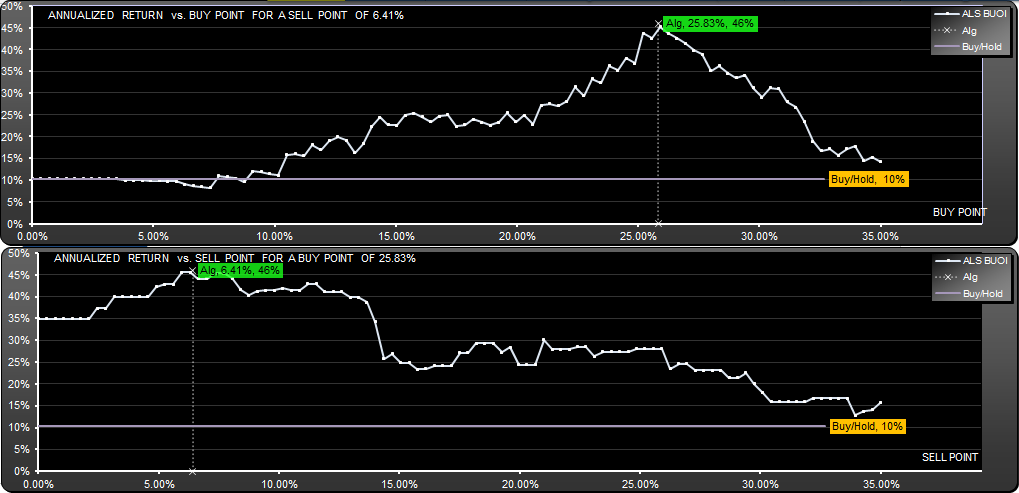
This graph shows the effect of changing the buy and sell parameters on the annualized return of the algorithm. For a buy point of 25.83%, all sell points 0 through 35% were profitable. For a sell point of 6.41%, all buy points 0 through 35% were profitable.
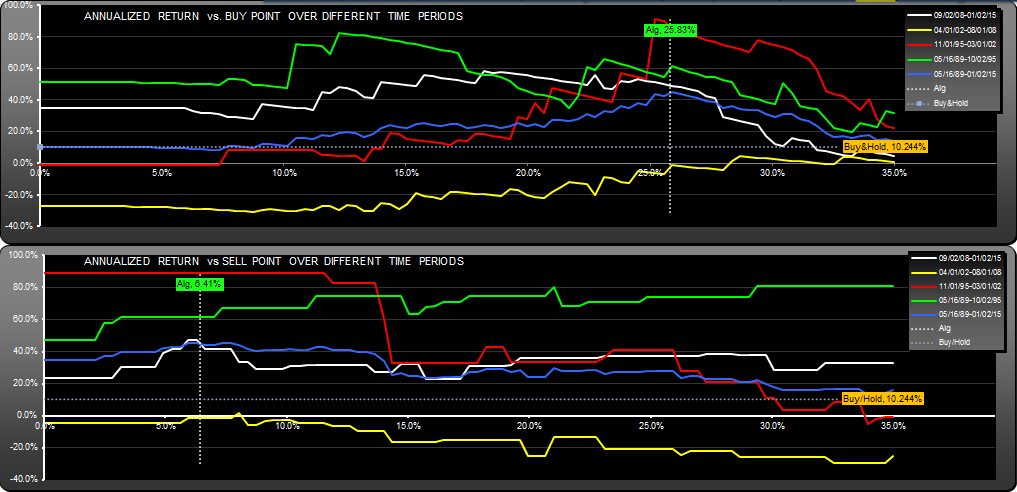
The life graph shows the return vs buy/sell points for different periods. The problem here is that the yellow graph shows that there was a period (5/89 to 10/95) with much worse return than the other periods. A more consistent algorithm over time would be preferable to the author, even if it had lower returns.
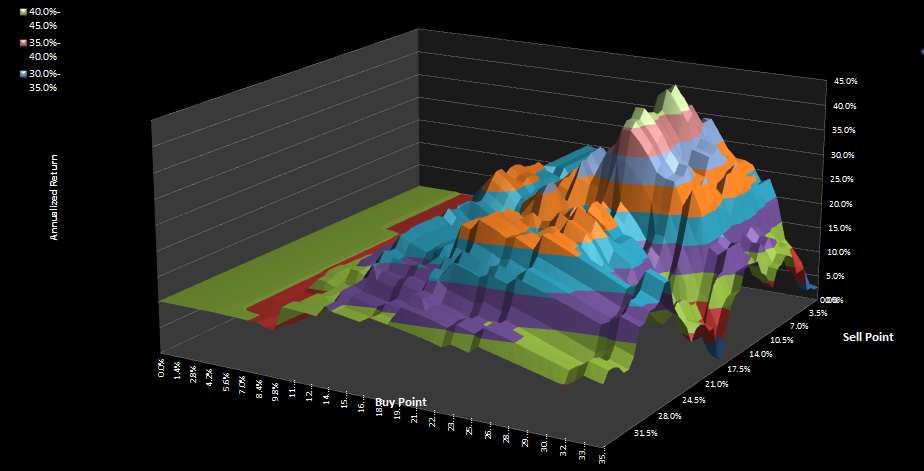
The parameter surface shows how the return changed over the whole parameter space. Cliffs and steep slopes are not good, but for this the drop-offs are reasonable.
MU Monthly, Update Jan 6th 2016
Since original publication, this algorithm would have returned 58%
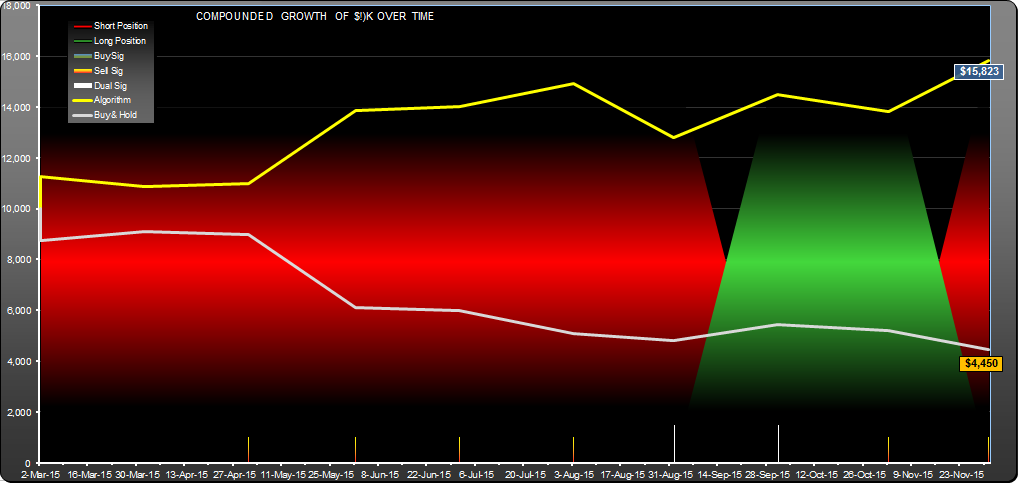
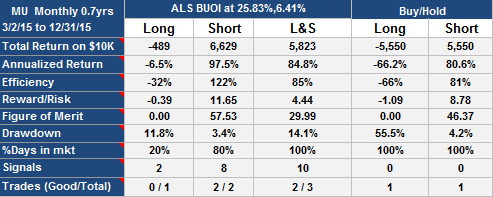
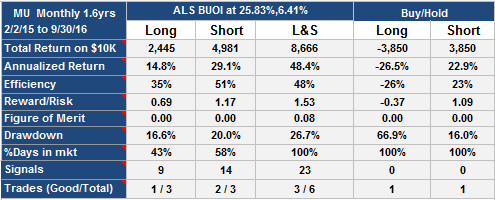
MU Monthly Trading System, Update 10/19/2016
The strategy, since publication in Feb 2015, has performed much better (86% return) than buy-hold and short-hold, with good drawdown. However, the optimum buy parameter for the period (16.45%) would have yielded a 151% return.
MU Monthly trading strategy update 10/192016
Since 5/16/89 the strategy would have returned $279,572,374
Update 5/26/2015:
Since 2/2/2015 the strategy has stayed short posting a small gain of 7.03% (31.6% annualized). The underlying stock has lost 6.56% (24% annualized).
Andrew
Update Aug 15th 2015:
Since original publication the strategy has gained 72%, staying short the whole period. The stock has lost 42%.