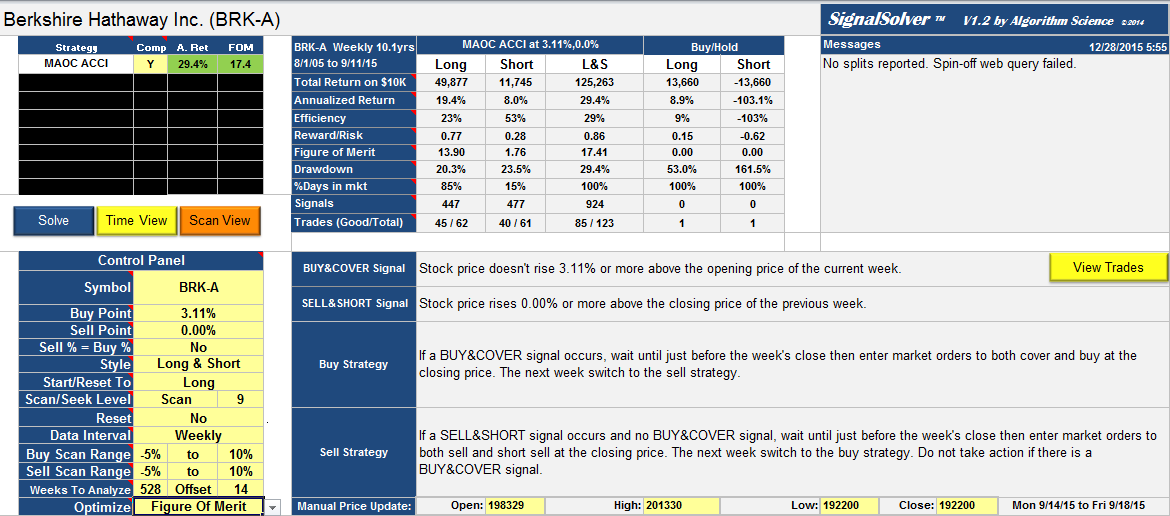
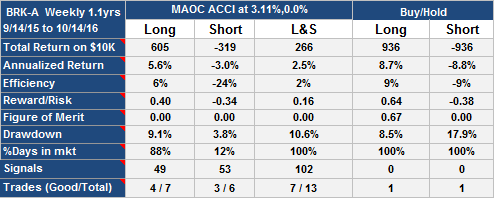
This is a Berkshire Hathaway trading strategy which would have given almost ten times the return performance of buy/hold over the last 10 years with half the drawdown. The strategy is detailed in the table below, it was straightforward, with 123 trades over the 10 year backtest period. All trading was done at the weekly close of business. This was a strategy where there was usually a buy and a sell signal every week (398 out of 528 weeks), but selling was initiated by the presence of a sell signal and an absence of a buy signal. There was a strong buy bias, appropriate for the underlying positive trend of the stock.
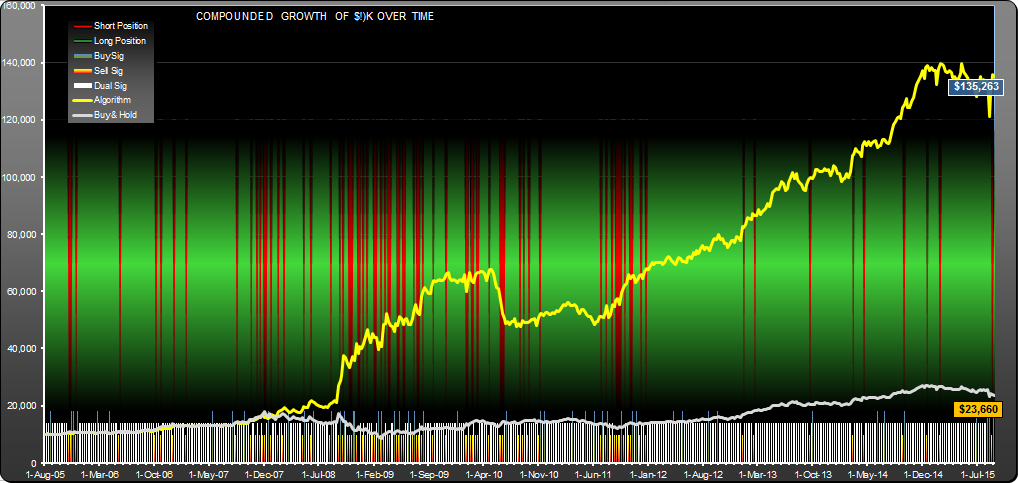
Equity curve, signals and positions are shown in the growth chart below. Notice the preponderance of white signals which indicate dual signal days.
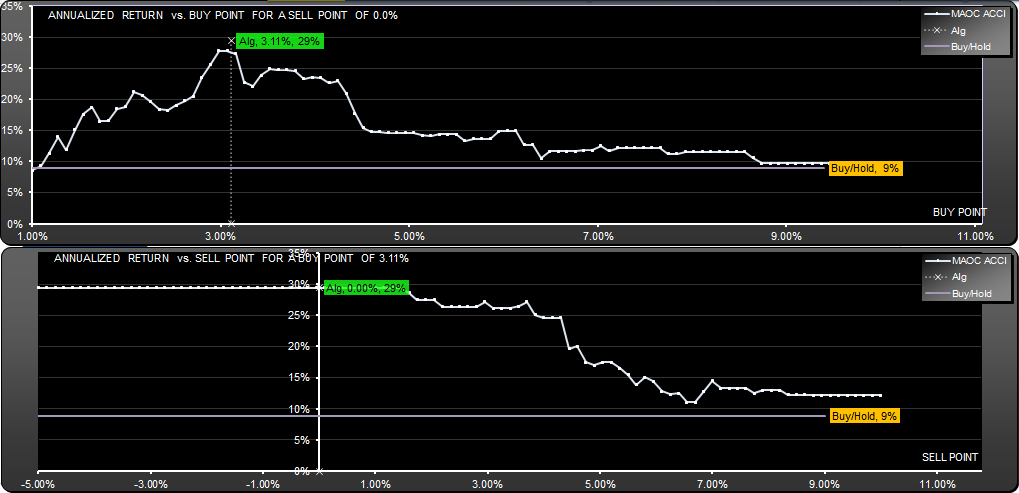
If the sell point was set at zero percent, the algorithm gave positive results for all buy points greater than 0.25%. Below we show how return varies with buy and sell parameters.
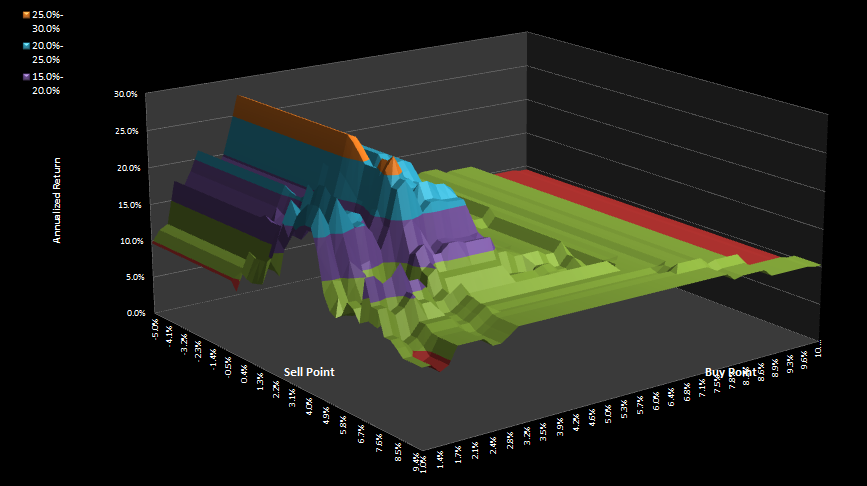
The returns for every combination of buy and sell parameter are shown in the surface plot below.
Looking at the minimum annualized returns for each of the four 132 week periods, you can see that the algorithm was much better behaved than the underlying stock, worst case was 19.26% which happened in the most recent quartus. The long side of the algorithm showed a min return of 15% with a stddev of only 3.37%, which is quite tight.
As always, this is not a recommendation to trade using this algorithm, just an interesting backtest result. For a list of trades, see here: BRKA.W Trades.
Please note, the above result was corrected 12/28/2015 to address a bug fix in the short side calculations.
Update Oct 21st 2016
