Original Post July 23 2021

AAPL trading system using SignalSolver Sentiment
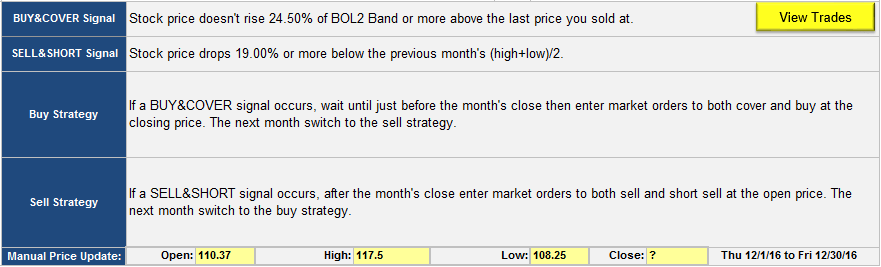
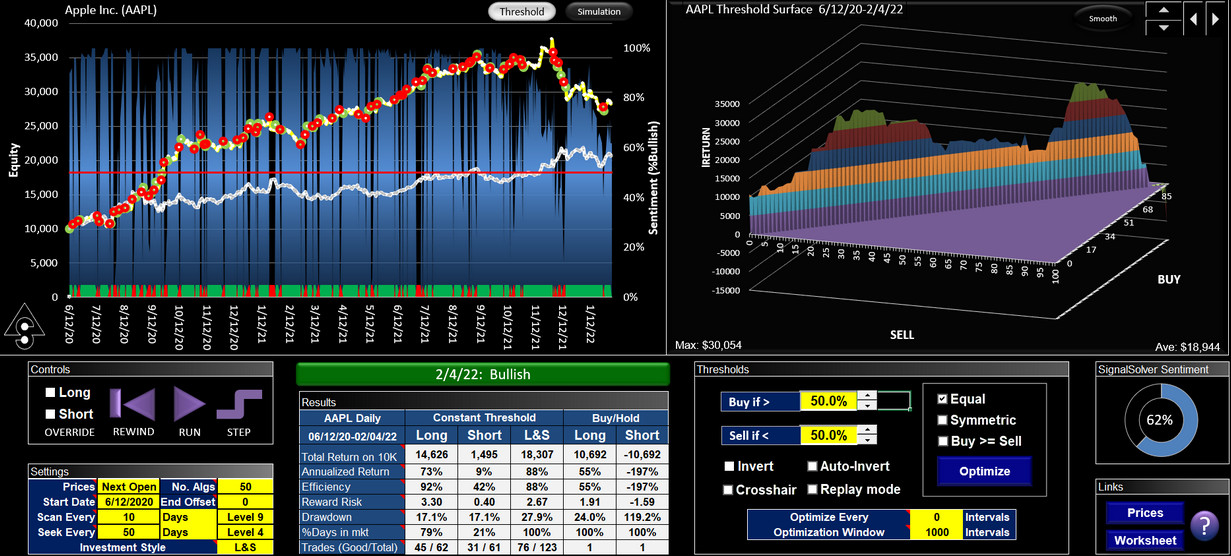
Methodology
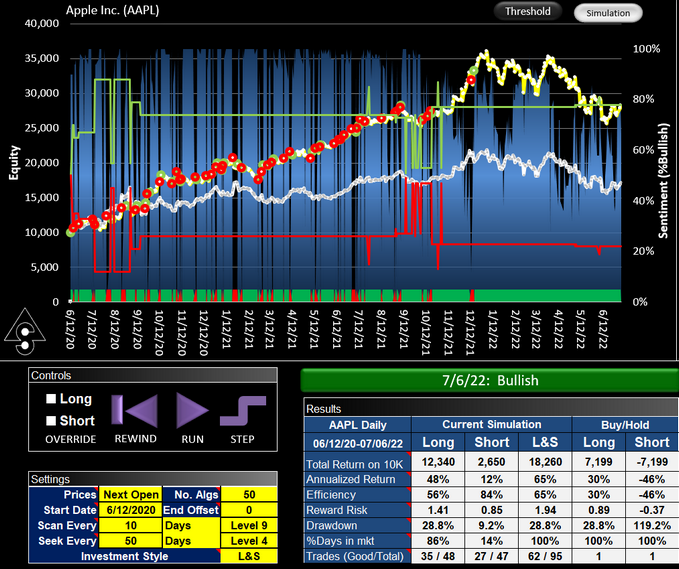
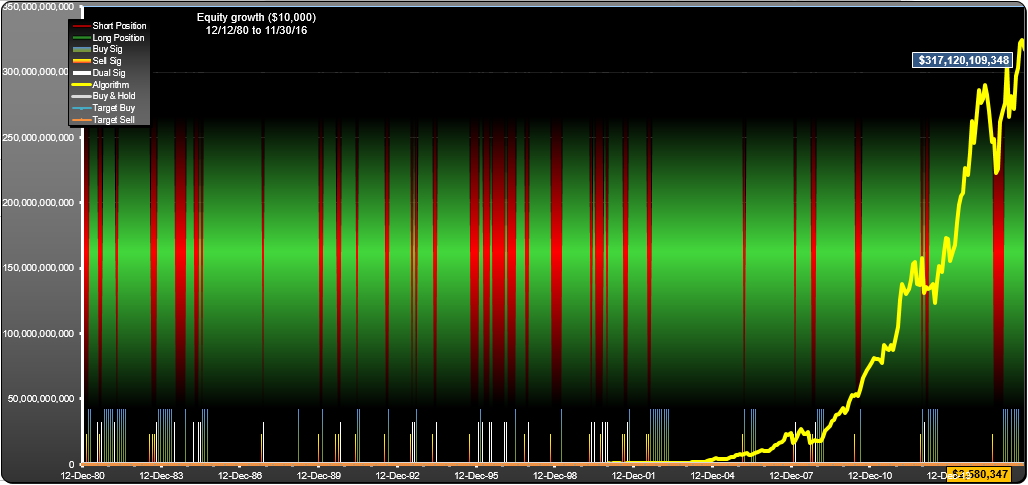
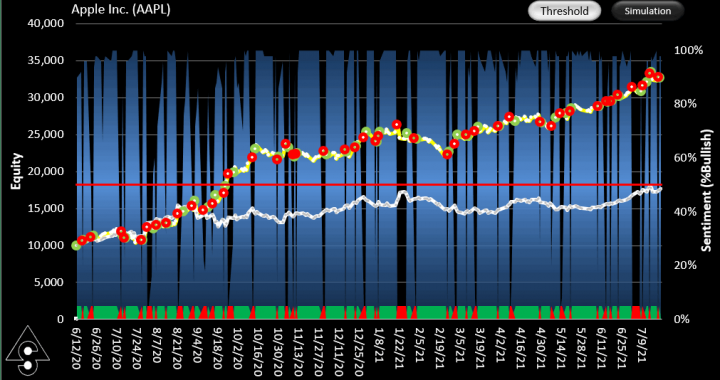
Shown above is the simulated result of trading AAPL using SignalSolver Sentiment. The sentiment is shown as a blue area chart in the background. The equity curve for the strategy is shown in yellow, buy-hold equity in white. Sentiment is calculated each day after the close of business by assessing what percentage of the top 50 SignalSolver backtest algorithms are bullish. The buy and sell thresholds are fixed at 50% (red line) with bullish being above the threshold. A trade is executed at the next open whenever a change in sentiment is indicated, so the trade price is always out-of-sample from the backtest period which is fixed at 250 trading days. The simulation then walks forward to the next day, repetitively. Algorithms are re-parametrized every 10 trading days and flushed and refreshed every 50 trading days. For more information on methodology, please see here.
Performance of AAPL trading system using SignalSolver Sentiment
Performance
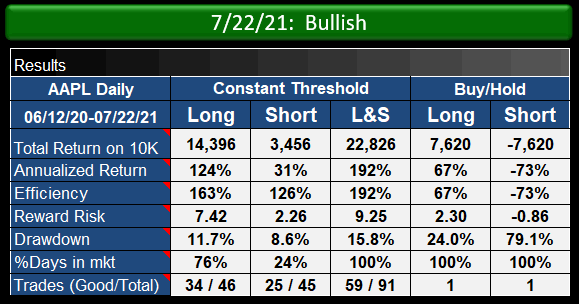
Trading on sentiment (L&S column above) performed around four times better in this simulation than buy-hold in terms of reward/risk, with final equity being around 3 times better for Long/Short trading of the signals and trading long only being about twice as good. In all cases, drawdown was lower for the sentiment trading than for buy-hold.
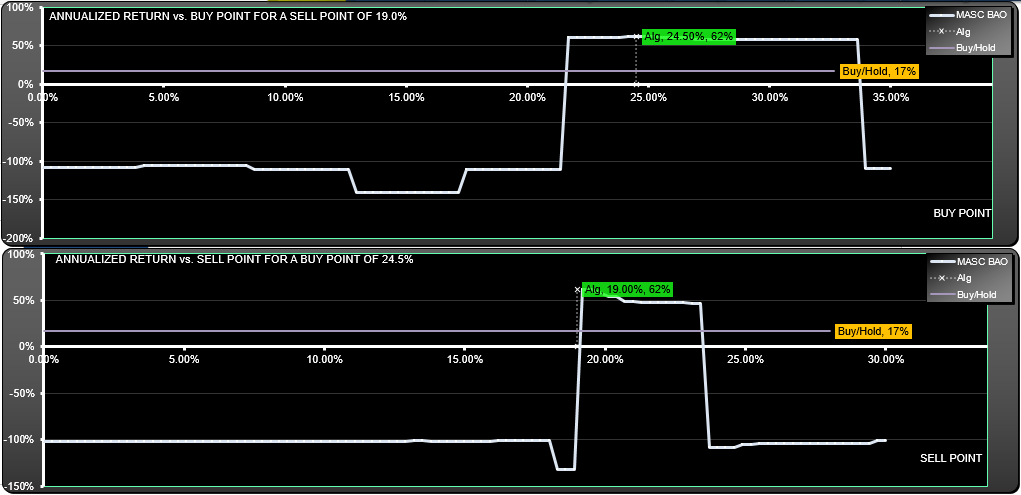
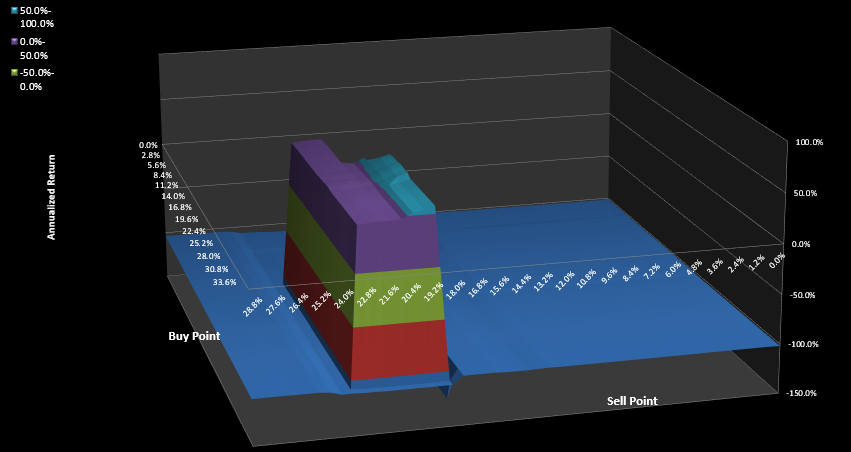
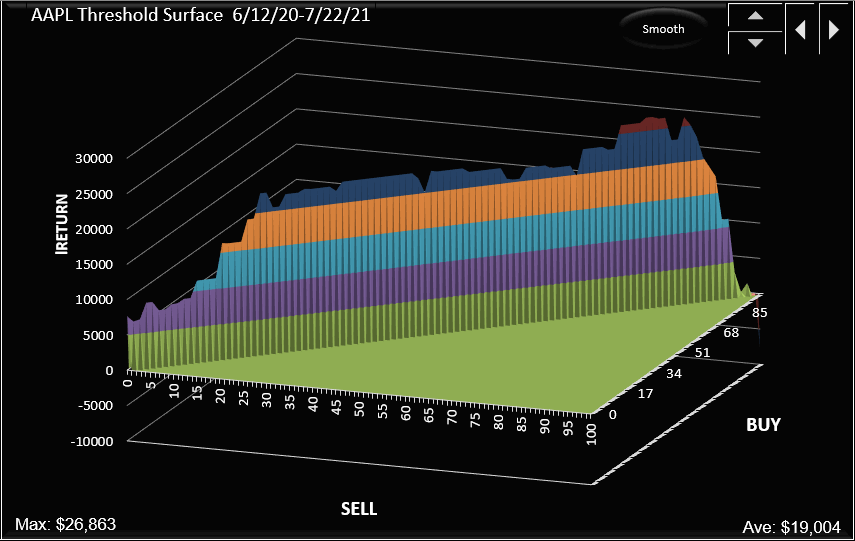
Below is shown the threshold surface for the equal buy/sell thresholds showing that annualized return (CAGR) is insensitive to threshold changes. The peak return is $26,863 at a threshold value of 83%.
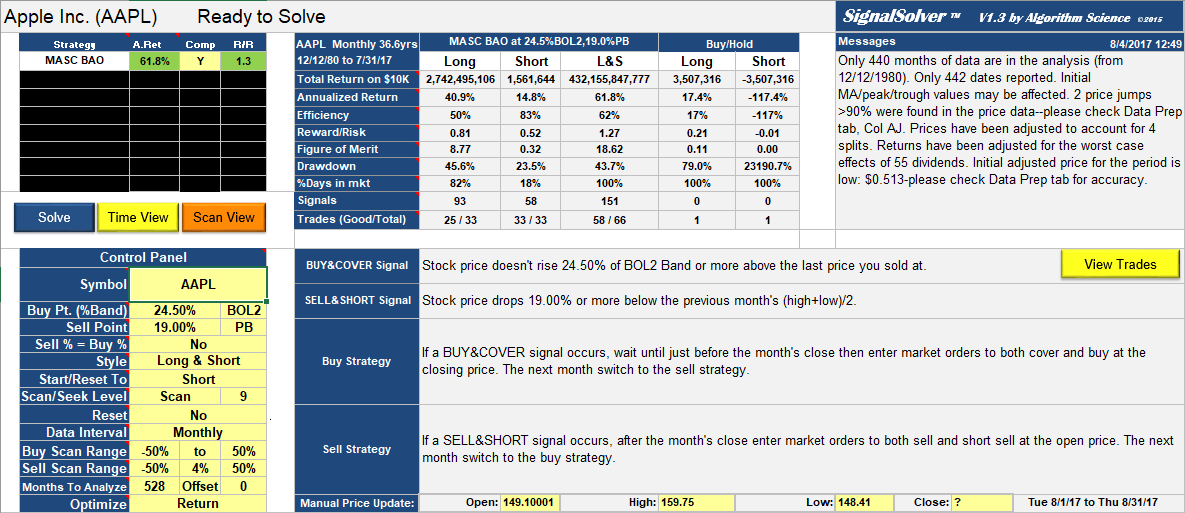
Click here to see the SignalSolver settings for this strategy: AAPL Sentiment Settings
We now move into the paper-trading phase for this project. Updates will be shown below.
Updates
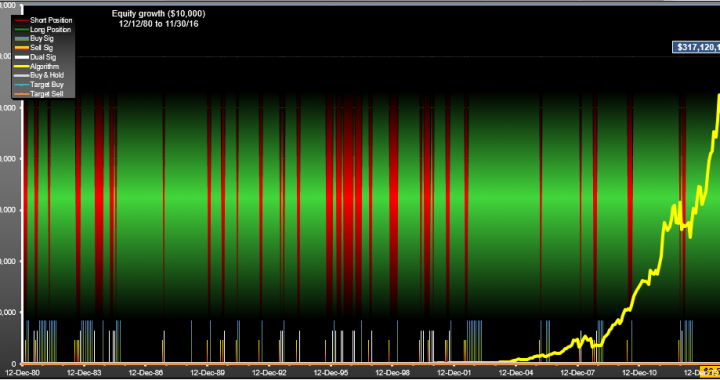
We tracked this algorithm with daily updates (up until Jan 4th 2022) here.
As of Jan 4th, (the time we stopped tracking it), here's how it looked:
From July 16th 2021 (the time we started paper trading this algorithm) it had lost 12.4%. Not good.
What we could have done better
We should not have forced a 50% threshold. It worked fairly well until 11/30/21 when it reached a peak of $37,705, up from $32,323 or a gain of 16.6% (vs. 25% gain in the underlying stock). But let's look at what would have happened if we had allowed the thresholds to float:

Here we are allowing the buy and sell thresholds to float, with the stipulation that the buy threshold must be greater than the sell threshold and the buy and sell thresholds must add up to 100% (the Symmetric box is ticked). Also we have set, Optimize Every to re-optimize the thresholds every day (set to 1) and we use an Optimization Window of 252 trading days (1 calendar year). This gives a return between July 16th 2021 to Jan 4th 2022 of 33% (vs. just under 20% for buy-hold).
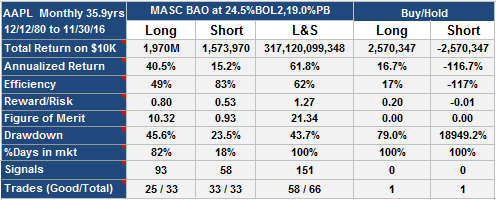
Hindsight is 20/20. When we made the decision to run with 50% thresholds (on July 15th 2021), the return of its algorithm since Jun 12th 2020 was higher than that for the floating thresholds--203% annualized vs. 160% annualized.
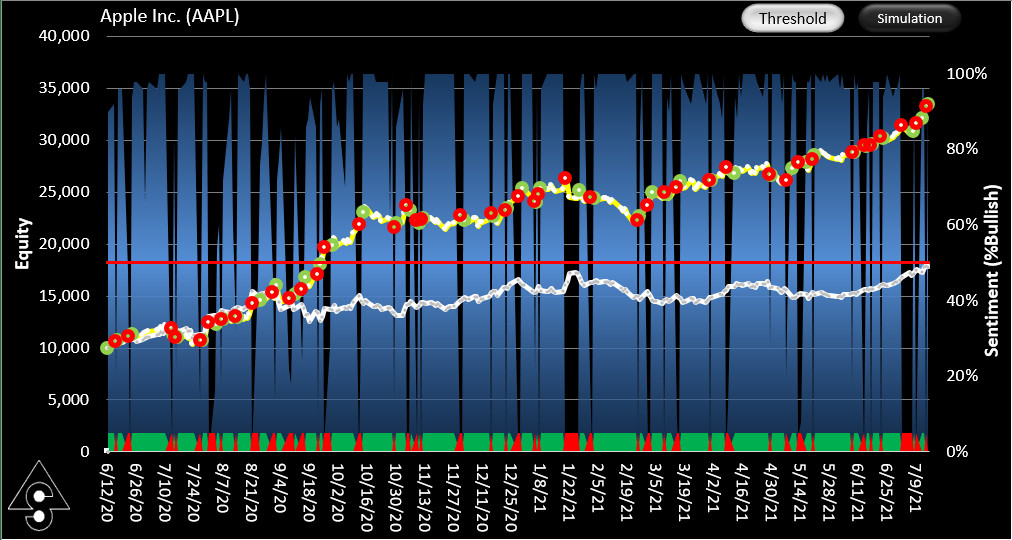
Back in July 2021 the constant 50% threshold algorithm (above) looked better than the adaptive threshold algorithm (below). Sentiment is shown in blue, algorithm in yellow and buy-hold in white.
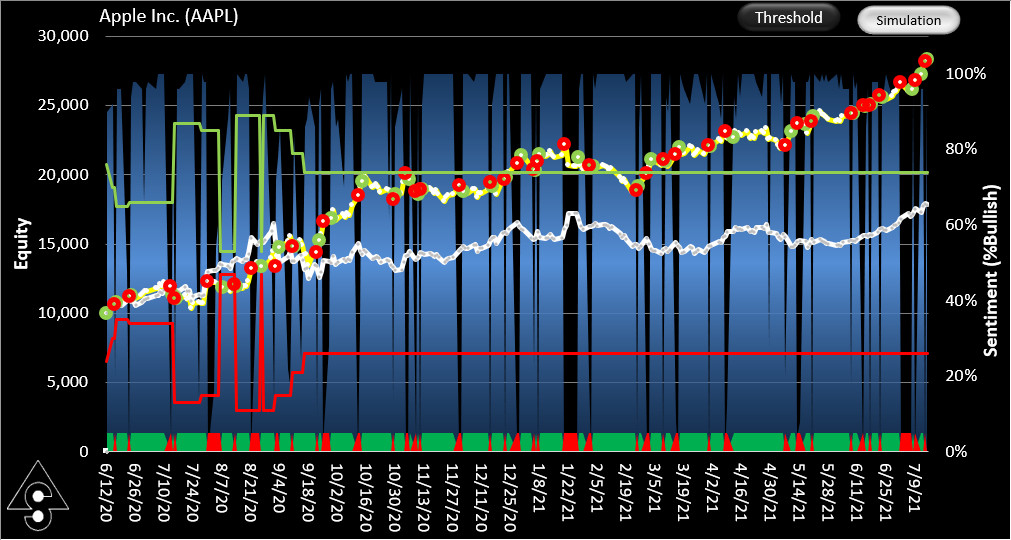
The adaptive symmetrical threshold algorithm back in July 2021 when we started trading. Buy threshold is green, sell threshold in red. Part of the under-performance is due to threshold hunting at the start of the run. Ultimately this was the better strategy.
Plus, 50-50 thresholds have a certain hard-to-resist appeal. But given the fact that AAPL (and most of the other stocks we tracked) did better with a floating threshold, we have become wiser. Lets track this algorithm for a while and see what it does.
A quick word about the floating thresholds. A 76/24 threshold was established in mid September 2020. Shown below is what the backtest looked like in July 2021 using a constant 76/24 threshold right back to the June 12th 2020 sentiment run start date. It actually outperforms every constant equal threshold algorithm, so the clues were there. Had we stuck with the constant 76/24 thresholds, we would have netted a 36% profit from July 16th 2021 to Jan 4th 2022, an even better result than the floating thresholds.
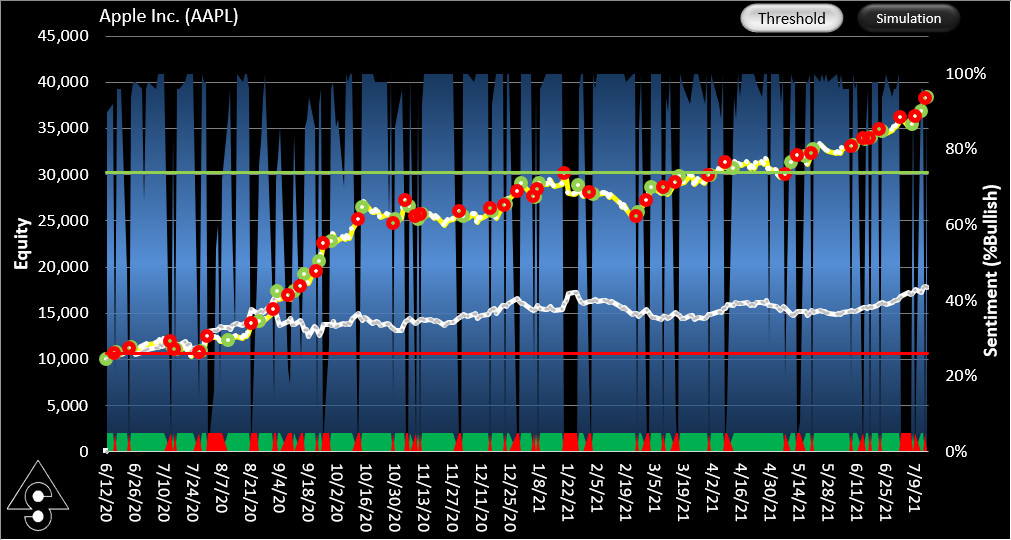
AAPL Backtest result for using a constant 76% buy threshold and 24% sell threshold at the decision point of 7/16/21. It is a better result than the 50/50 threshold and we could have moved forward with this strategy with good results.
Update 7/7/2022
The adaptive threshold used above did not work out, losing 14% since the last update on 2/4/2022. Disappointing that it did not go bearish since the last update.