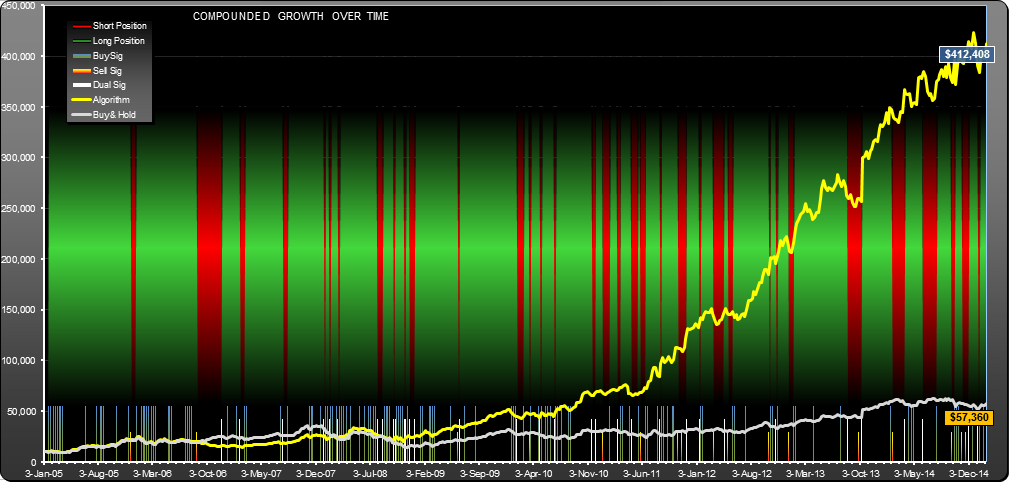
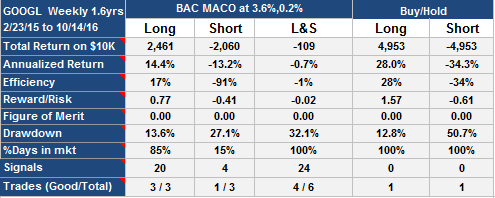
Buy signals around 3 times more frequent than sell signals, some overlap (dual signal months shown as white lines). 80% long, 20% short. Algorithm showing flattening out of performance in recent months.
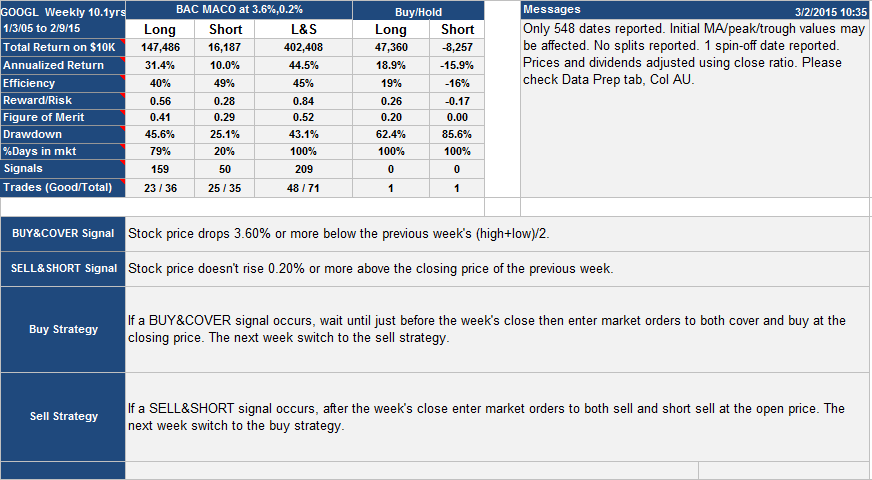
GOOGL.M Performance table and strategy description. Showed about 3 times the reward-risk of buy-hold. Strong bias to buy side (as is appropriate for upward trending stocks), clearly shown in signal count and %days long vs. short.
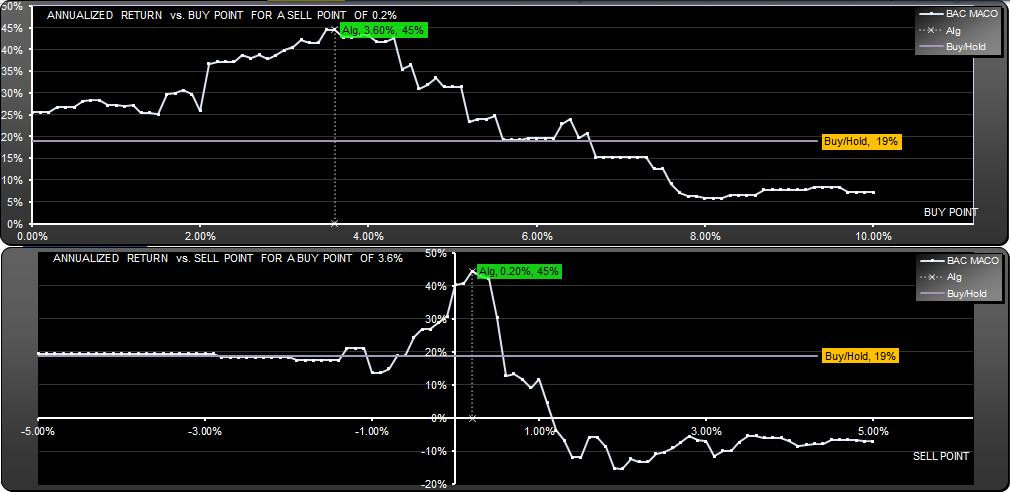
Return vs. parameter for buy and sell parameters. Buy side is reasonably insensitive. Sell side seems more highly tuned, however algorithms of the "misses target" type often have this characteristic of being tightly clustered around zero.
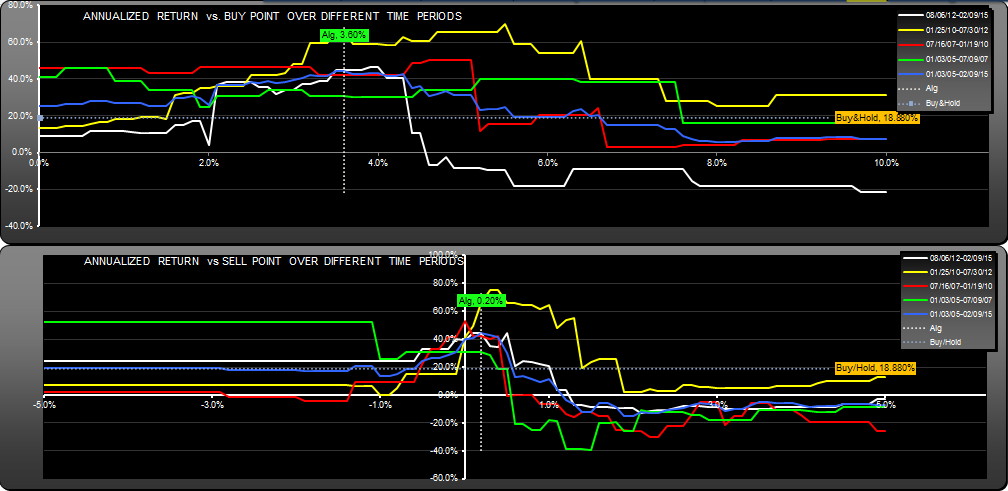
The life chart shows parameter sensitivity for different time periods. All timeframes beat buy-hold by a decent margin.
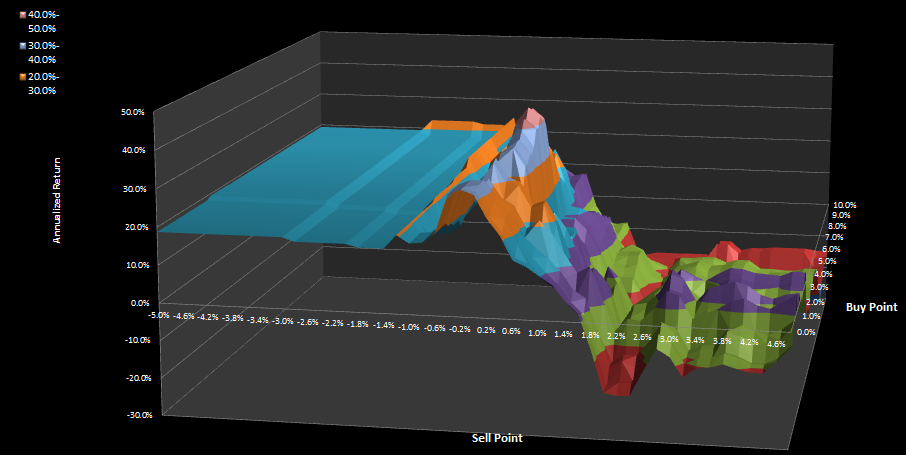
GOOGL Surface chart showing how return changed with buy and sell parameters.
Update 10/20/2016
GOOGL Trading Strategy Weekly Update Oct 19th 2016
Update 5/26/2015:
Since publication on 3/2/2015, there have been no sell signals or trades and the strategy has stayed long; both the strategy and underlying stock have gained 4.42%.
Andrew
Since original publication on March 2nd, this strategy has lost 22.2%, the underlying stock has gained 14%.