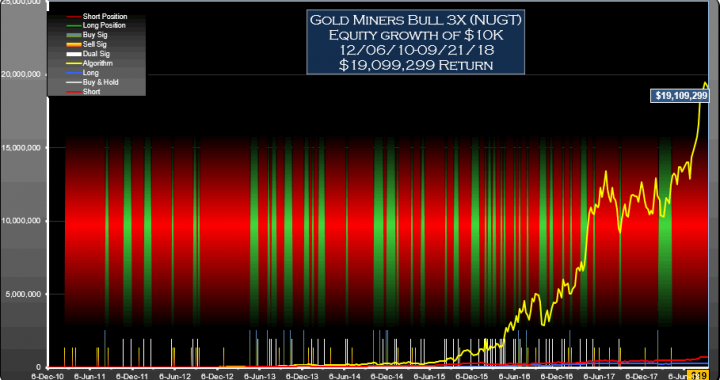
These Gold Miners Bull 3X (NUGT) signals traded as directed would have performed around 1913.6 times better than short-hold with an ROI of 190,993% for the period 06-Dec-10 to 21-Sep-18
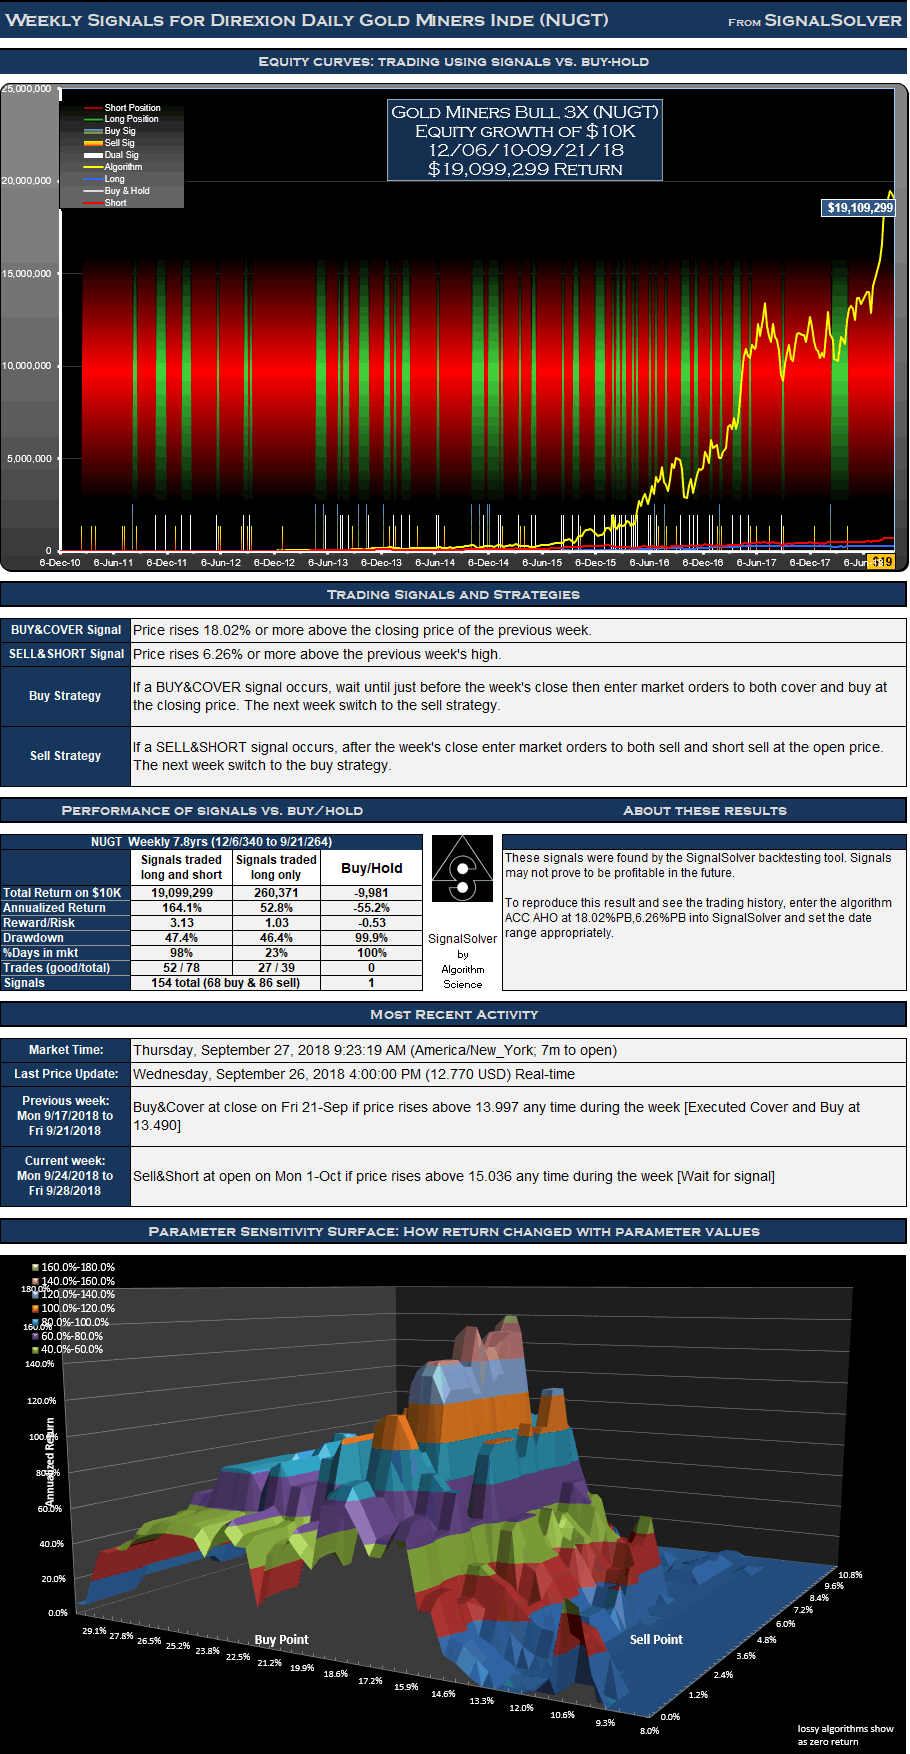
The trading signals for Gold Miners Bull 3X (NUGT) were selected for their reward/risk and parameter sensitivity characteristics. Backtests don't always generate reliable signals which can be counted on moving forward but many traders find value in knowing what buy and sell signals would have worked well in the past.
Returns for the Gold Miners Bull 3X (NUGT) signals
For the 407 week (7.8 year) period from Dec 6 2010 to Sep 21 2018, these signals for Gold Miners Bull 3X (NUGT) traded both long and short would have yielded $19,099,299 in profits from a $10,000 initial investment, an annualized return of 164.1%. Traded long only (no short selling) the signals would have returned $260,371, an annualized return of 52.8%. 23.2% of time was spent holding stock long. The return would have been $9,981 (an annualized return of 9.3%) if you had shorted the stock for the same period.
Signals and Trades
Not all signals are acted upon and signals are often reinforced in this type of strategy. If you are long in the security, buy signals are not acted on, for example. Similarly if you are short you must ignore sell signals. There were 68 buy signals and 86 sell signals for this particular NUGT strategy .These led to 39 round trip long trades of which 27 were profitable, and 39 short trades of which 25 were profitable. This is a weekly strategy; weekly OHLC data is used to derive all signals and there is at most one buy and sell signal and one trade per week.
Drawdown and Reward/Risk
Drawdown (the worst case loss for an single entry and exit into the strategy) was 47% for long-short and 46% for long only. This compares to 28% for short-hold. The reward/risk for the trading long and short was 3.13 compared to 0.28 for short-hold, a factor of 11.1 improvement. If traded long only, the reward/risk was 1.03. We use drawdown plus 5% as our risk metric, and annualized return as the reward metric.
The backtests assume a commission per trade of $7. Returns have been adjusted for the worst case effects of 2 dividends
| Week of signal | Buy or Sell | Price | L&S Value Next Open |
| 2/14/2011 | Sell | 7,474.00 | 9,993 |
| 8/8/2011 | Buy | 6,890.00 | 10,729 |
| 8/22/2011 | Sell | 7,672.00 | 11,967 |
| 10/24/2011 | Buy | 6,896.00 | 12,824 |
| 11/28/2011 | Sell | 6,022.00 | 11,481 |
| 1/23/2012 | Buy | 5,194.00 | 11,624 |
| 2/20/2012 | Sell | 4,916.00 | 11,415 |
| 5/21/2012 | Buy | 2,296.00 | 18,033 |
| 5/28/2012 | Sell | 2,584.00 | 19,663 |
| 8/20/2012 | Buy | 2,530.00 | 20,108 |
| 9/3/2012 | Sell | 2,970.00 | 23,535 |
| 9/10/2012 | Buy | 3,598.00 | 18,761 |
| 9/17/2012 | Sell | 3,630.00 | 18,696 |
| 4/22/2013 | Buy | 476.00 | 36,481 |
| 5/27/2013 | Sell | 460.00 | 33,738 |
| 7/8/2013 | Buy | 226.40 | 50,767 |
| 7/15/2013 | Sell | 298.00 | 66,926 |
| 7/22/2013 | Buy | 314.00 | 63,964 |
| 8/12/2013 | Sell | 373.20 | 75,242 |
| 9/16/2013 | Buy | 220.44 | 102,776 |
| 10/21/2013 | Sell | 226.36 | 108,860 |
| 12/9/2013 | Buy | 107.44 | 169,993 |
| 12/30/2013 | Sell | 123.56 | 190,935 |
| 1/13/2014 | Buy | 144.64 | 153,092 |
| 1/20/2014 | Sell | 147.84 | 161,836 |
| 2/10/2014 | Buy | 201.16 | 105,943 |
| 3/10/2014 | Sell | 225.80 | 116,112 |
| 6/9/2014 | Buy | 142.20 | 160,922 |
| 6/16/2014 | Sell | 174.20 | 194,873 |
| 10/6/2014 | Buy | 81.56 | 314,011 |
| 11/17/2014 | Sell | 61.16 | 223,820 |
| 12/1/2014 | Buy | 49.44 | 277,700 |
| 1/5/2015 | Sell | 63.96 | 345,008 |
| 1/12/2015 | Buy | 74.72 | 306,155 |
| 1/19/2015 | Sell | 66.44 | 255,141 |
| 3/16/2015 | Buy | 45.04 | 343,896 |
| 3/23/2015 | Sell | 39.48 | 295,653 |
| 4/27/2015 | Buy | 49.64 | 229,992 |
| 5/11/2015 | Sell | 53.84 | 238,116 |
| 8/10/2015 | Buy | 15.36 | 435,931 |
| 8/17/2015 | Sell | 17.28 | 459,308 |
| 9/14/2015 | Buy | 14.04 | 522,106 |
| 10/5/2015 | Sell | 19.74 | 766,830 |
| 11/30/2015 | Buy | 12.57 | 1,005,829 |
| 1/4/2016 | Sell | 11.56 | 961,562 |
| 1/25/2016 | Buy | 10.27 | 1,101,500 |
| 2/1/2016 | Sell | 18.64 | 1,940,208 |
| 2/8/2016 | Buy | 22.75 | 1,289,545 |
| 2/22/2016 | Sell | 21.96 | 1,459,697 |
| 2/29/2016 | Buy | 24.29 | 1,353,655 |
| 3/14/2016 | Sell | 26.17 | 1,405,630 |
| 4/4/2016 | Buy | 28.50 | 1,370,928 |
| 4/11/2016 | Sell | 32.32 | 1,451,768 |
| 4/18/2016 | Buy | 32.57 | 1,471,037 |
| 4/25/2016 | Sell | 49.20 | 2,175,762 |
| 5/30/2016 | Buy | 39.96 | 2,561,343 |
| 6/6/2016 | Sell | 45.97 | 2,972,913 |
| 6/20/2016 | Buy | 45.58 | 3,083,235 |
| 6/27/2016 | Sell | 60.56 | 3,983,540 |
| 7/25/2016 | Buy | 64.20 | 3,703,520 |
| 8/1/2016 | Sell | 61.60 | 3,592,239 |
| 9/19/2016 | Buy | 40.52 | 4,914,330 |
| 10/17/2016 | Sell | 29.42 | 3,500,703 |
| 10/31/2016 | Buy | 29.76 | 3,132,347 |
| 11/14/2016 | Sell | 35.16 | 4,088,083 |
| 12/26/2016 | Buy | 30.56 | 4,756,036 |
| 1/3/2017 | Sell | 39.64 | 5,996,463 |
| 1/30/2017 | Buy | 47.56 | 5,040,504 |
| 2/6/2017 | Sell | 50.08 | 5,052,597 |
| 3/13/2017 | Buy | 35.68 | 6,571,044 |
| 4/10/2017 | Sell | 44.76 | 8,160,916 |
| 5/8/2017 | Buy | 34.61 | 10,561,117 |
| 5/15/2017 | Sell | 36.03 | 10,422,256 |
| 8/28/2017 | Buy | 40.17 | 9,495,657 |
| 9/5/2017 | Sell | 40.01 | 9,187,924 |
| 2/12/2018 | Buy | 26.94 | 11,714,228 |
| 4/9/2018 | Sell | 27.41 | 12,433,631 |
| 9/17/2018 | Buy | 13.49 | 19,109,299 |
| 9/24/2018 | Last | 13.75 | 19,109,299 |
Update 10/28/2019
The strategy showed positive returns up until June 2019 when it took a downward turn. 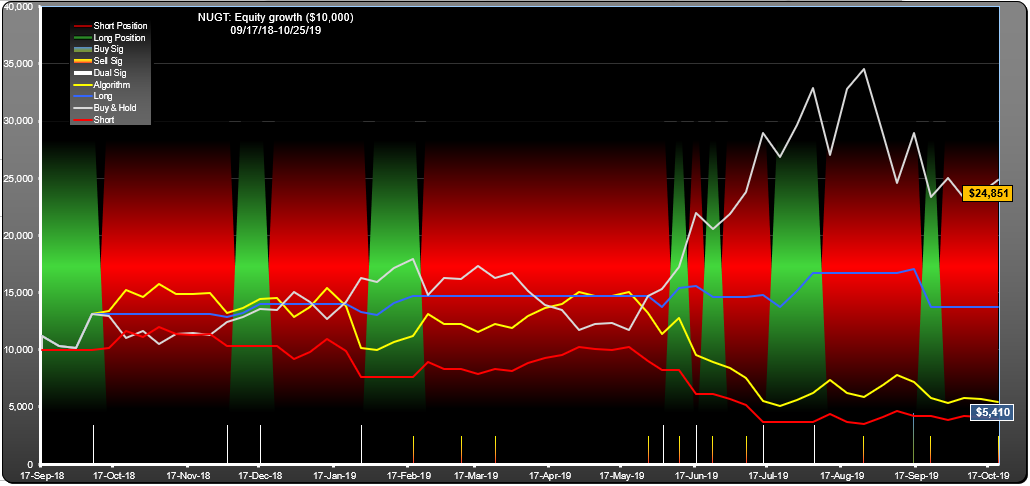
Optimum parameters for this period were 11.17% (buy side) and 9.74% (sell side) these would have returned around 78% annualized vs. 129% for buy-hold.