Getting Started With SignalSolver
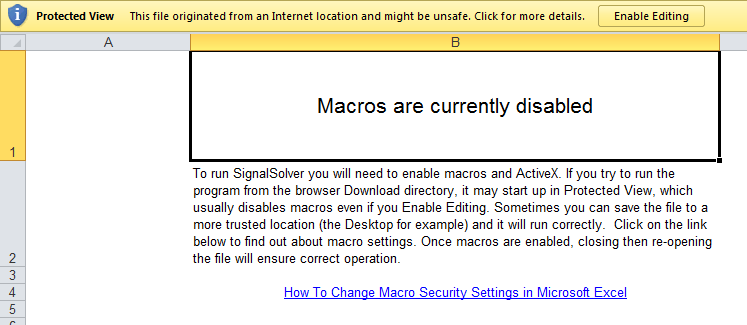
This message appears if macros are not enabled
Once you have downloaded the spreadsheet, you will need to enable macros in order for it to work. It may be necessary to move the file to a trusted location from your download folder. A dialog may appear like the one on the left asking if you should enable Content and/or Editing. SignalSolver won't work unless both Content and Editing are enabled.
About Security
SignalSolver is a program written in Visual Basic for Applications (VBA), the Excel internal programming language. In order to download historic price data, it requests data from Yahoo and Morningstar. There are also hyperlinks to the help system on this website. Other than that, SignalSolver doesn't make connections to any other sites, so it is perfectly safe. It won't gather information from your computer other than looking for its own license information.
SignalSolver EULA
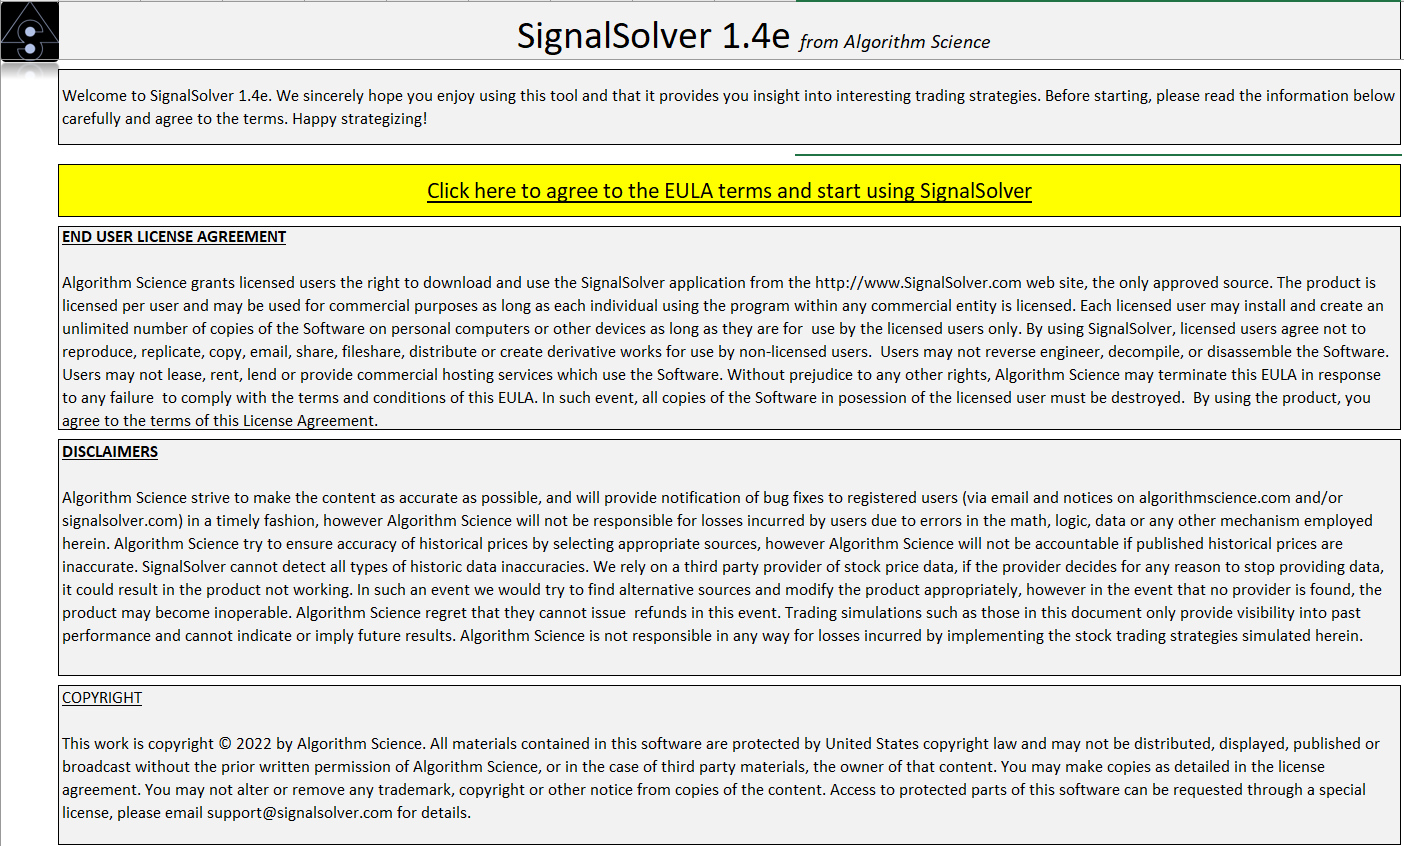
The EULA tab gives license, terms of use and other info
The End User License Agreement (EULA) is located on the EULA tab. After you have read the agreement you can click on the link which takes you to the Wizard tab.
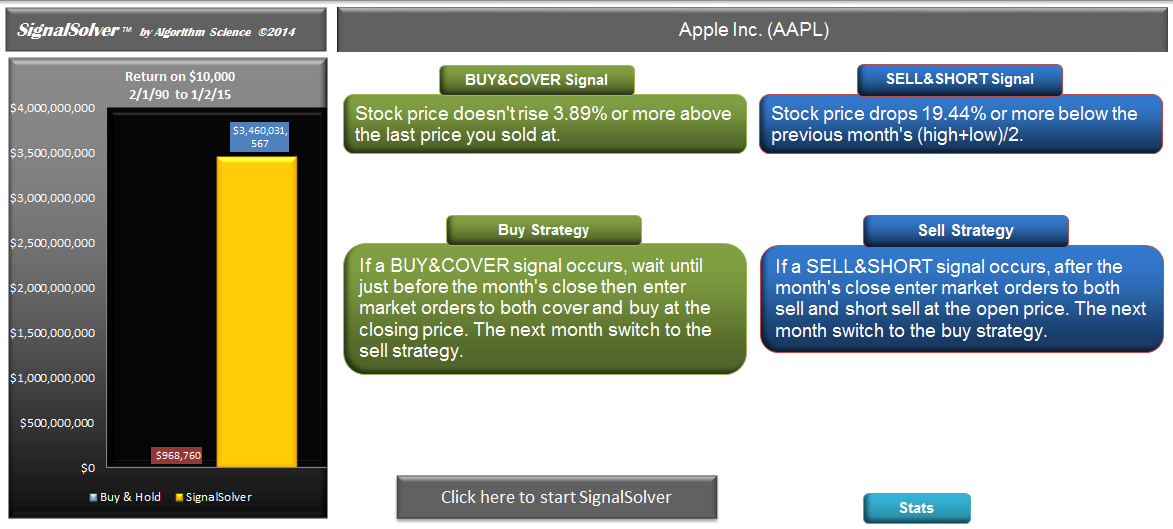
The Wizard tab stats give you a simple interface into the backtester.
The Wizard tab is designed to give you the simplest possible way to find signals and trading strategies. It has 3 elements
- A bar graph showing the performance of a strategy vs. the performance of buy-hold
- A detailed description of the buy and sell signals
- A detailed description of the buy and sell strategies
Click on the "Click here to start SignalSolver" link and a dialog will appear asking you to enter a stock symbol. Enter any stock, ETF, mutual fund or index symbol understood by Yahoo Finance and the backtester will begin its work.
What the program does
The initial setting is to for monthly data (you can change that to weekly or daily by clicking on "Settings"), so SignalSolver will request monthly stock price data from Yahoo. It also gets split, dividend and spin-off information and warns you about specific odd looking price data. It now starts looking for trading strategies. Which strategies it looks at will depend on the Seek/Scan level. Initially the program is set up for Scan level 4, which means that any algorithms on the Algorithm tab of Scan Level 4 or less will be scheduled for testing. It takes the first algorithm and backtests it against the data at approximately 400 different buy-sell point combinations covering the entire buy and sell scan range, zooming in on buy-sell combinations which look most promising. Once it finishes optimizing the first algorithm, it displays the result, updating the signals, strategy and the bar graph. It then moves onto the next scheduled algorithm. If it finds an improvement, it will display the results for that one. It continues in this way until all scheduled strategies are tested. The algorithm displayed is then the best it found.

Click on "Stats" to see trading strategy statistics.
Clicking on "Stats" shows you some of the statistics associated with the trading strategy--
- Total and annualized returns vs. buy-hold
- Efficiency (long or short styles only)
- Signal count
- Trade count
- Drawdown--the worst loss you could have incurred for a single entry and exit into the strategy.
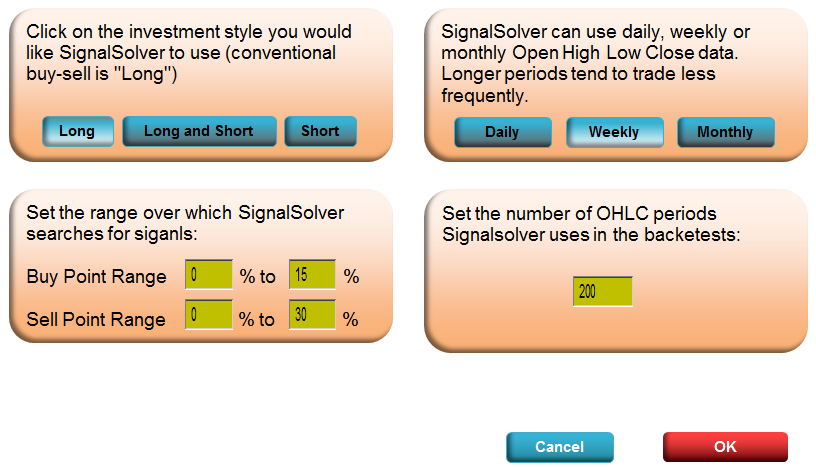
Settings available on the Wizard Tab.
Wizard Tab Settings
The Wizard allows changing of four of the backtester settings:-
- The investment style can be set to Long (buy and sell only), Short (short and cover only) or Long and Short (if not long, then go short)
- Data Interval--choose monthly, weekly or daily data
- The scanning range (the backtester will not scan for signals outside these ranges). Note that ranges can include negative numbers.
- The number of days, weeks or months in the analysis
Other backtester settings can be accessed through the Control Panel or the Strategy Tab settings.
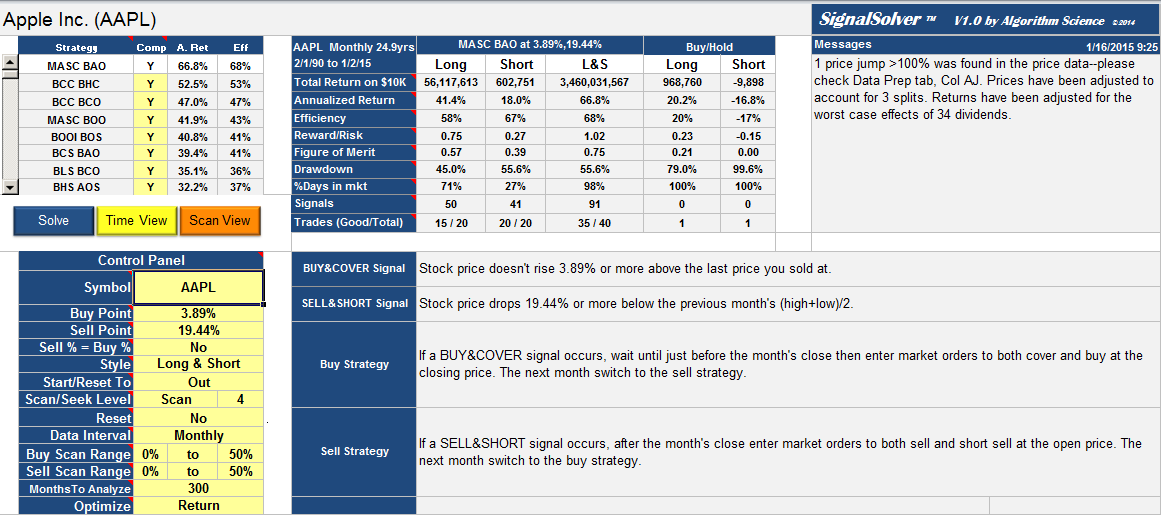
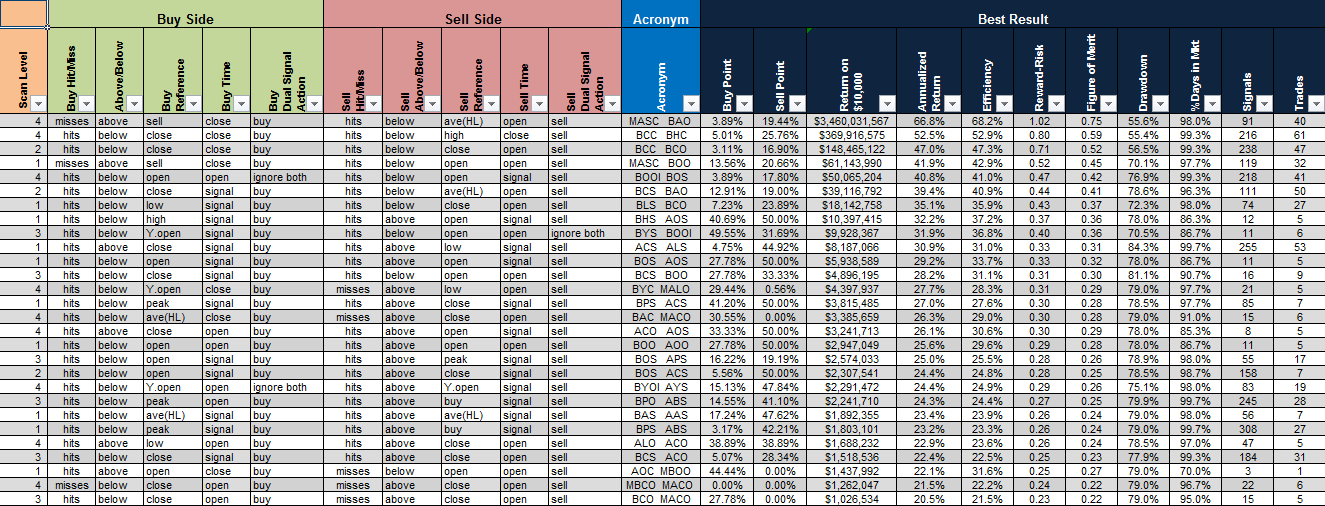
Report Tab--Table View
The Report tab gives you a much more detailed view into the strategies than the Wizard tab. The Strategy Table in the top left allows you to spotlight different strategies just by clicking on them. The Control Panel allows you to control the way the backtester works. These two elements are always visible, as are the buttons for starting and stopping the backtester (the "Solve" button) and selecting the view.
The right hand side of the Report Tab switches between three views:-
- Table view--statistics of the strategy vs. buy-hold
- Time view--shows the growth of $10,000 (the equity curve) along with signals and positions
- Scan view--shows how the strategy results changed with a change in parameters.
In Table view, the Performance Table is shown in the upper table and the signals and strategies are shown in the lower table.
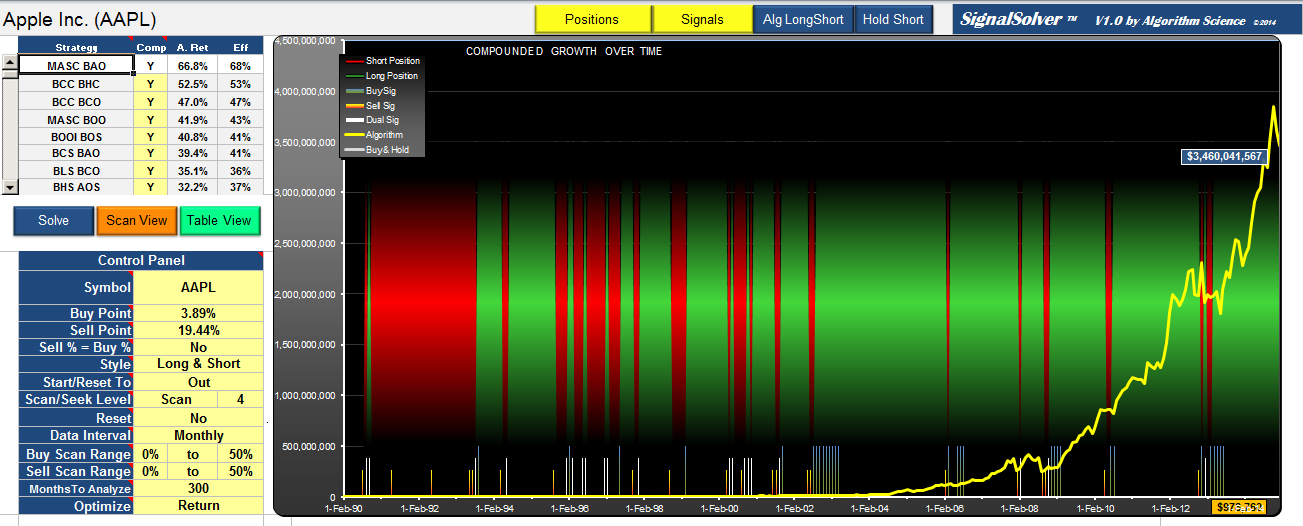
Report Tab--Time View
The Report Tab Time View is accessed by clicking "Time View" on the control buttons.
In this view the equity curve shows the growth of $10,000 over the duration of the algorithm backtest as it compares to buy-hold. Also shown are the Signals (buy, sell and dual) and the positions (in the background of the graph: green is held long, red is held short).
You can also view the long and short growth and the short-and-hold growth equity curve by clicking on the buttons above the graph.
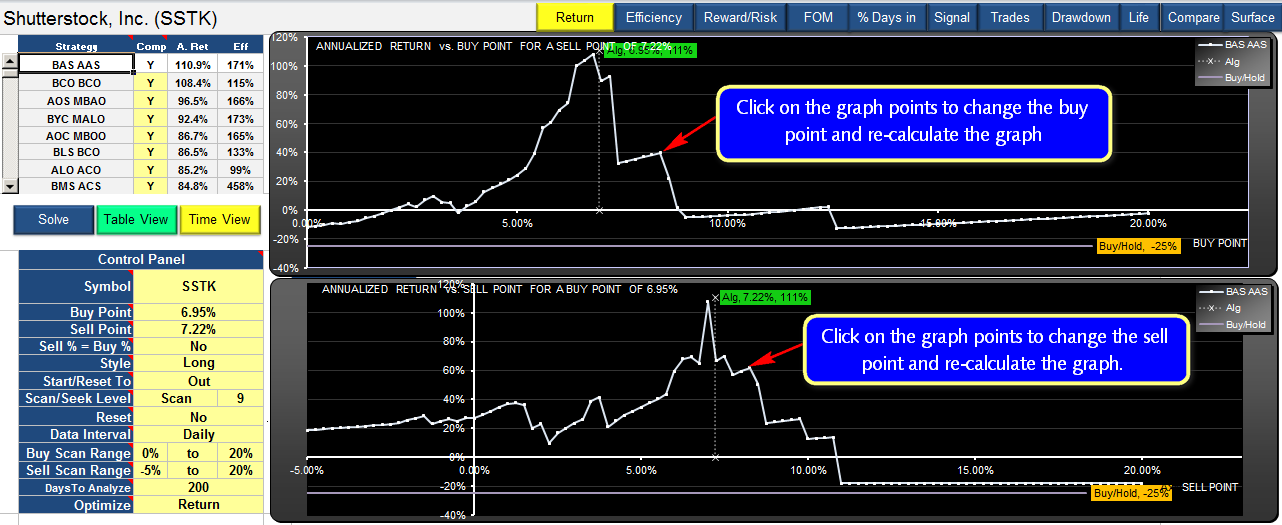
Report Tab--This type of Scan View shows you how sensitive the strategy was to changes in buy or sell point percentages
The Scan View is accessed by accessing the Report Tab then clicking "Scan View" on the control buttons.
This view brings up the buy-point and sell-point scans.You can view Return, Efficiency, Reward/Risk, Figure Of Merit, % of Days in Mkt, No of signals, No of trades or Drawdown. Select these options using the buttons above the graphs. The graphs show, for example, how the historic Return would have changed if the buy or sell point was changed. The graphs are interactive; you can click on the graph data points to change the buy or sell point, and the program will re-scan.
These graphs will show you exactly how sensitive the algorithm performance was to changes in the buy and sell parameters. A graph showing profits over a broad range of buy and sell points indicates the algorithm was less sensitive to buy and sell point. The presence of a sharp falloffs near to a buy-sell point indicates that an algorithm was over-optimized and prone to perform very differently if the buy or sell point was slightly different. Note that if Sell %=Buy % is set to "Y", a single graph is shown. You can zoom in to a particular region by changing the Buy or Sell Scan Range.

Report Tab--The Comparative Scan View allows you to compare the sensitivity of the buy and sell point parameters. In this case we are comparing Reward/Risk
You can compare scans for different algorithms using the Comparative Scan View. To access this feature, select Scan View and click on the compare button above the graphs.
To include or exclude a trading strategy from the comparison, use the "Comp" column on the Strategy Table, double-clicking to include or exclude a strategy from the comparisons. The spotlit strategy is always displayed.
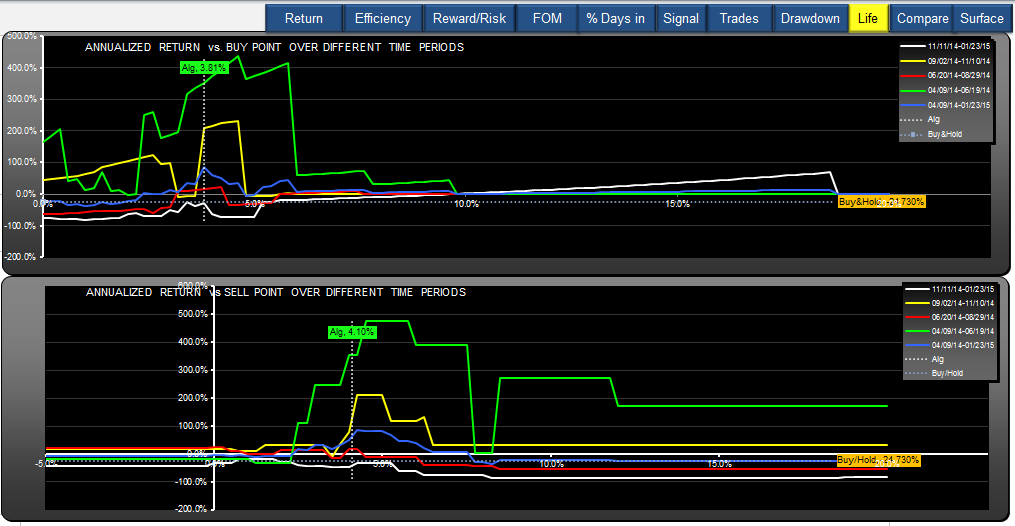
Report Tab--Scan View Life graphs compare returns for different time periods.
The Life button shows trading strategy returns over different time periods.
The total period is divided into four periods and the scans for each of these periods is shown on the scan graphs, along with the annualized return for the whole period. This enables you to tell if the algorithm performance was short-lived, as in the case shown on the left in which most of the return happened in the period 4/09/14 through 6/19/14 (the green scan).
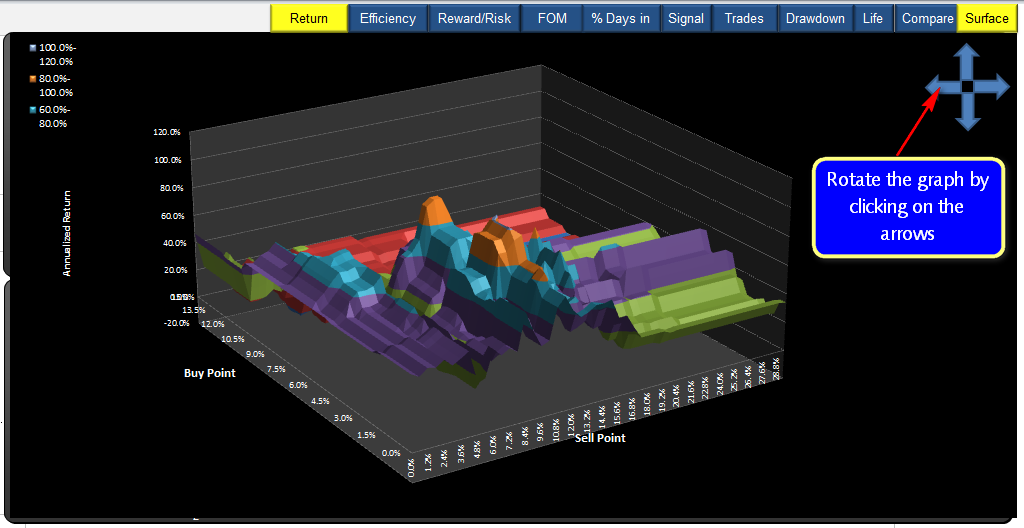
Report Tab--Scan View Surface plot shows Return (vertical) vs. buy point vs sell point.
The Surface Plot shows the entire surface for all in-range buy and sell points. In the example shown on the left, Return is plotted, but you can plot any of the scannable performance paramaters, such as Reward/Risk, Drawdown or Figure Of Merit.
The different colors represent different ranges as indicated by the key on the left. You can change the perspective (rotate left, right, up or down) by clicking the arrows at the top right hand corner.
Algorithms Tab--Lets you set up your own trading strategies, or review scan and seek results
The Algorithm Table controls which trading strategies are scheduled during the scans. You can add or remove rows to the table to add to your algorithm set, or you can hide rows using the Excel Autofilter feature to exclude them from scanning. For example you could restrict the scans to include only algorithms which buy and sell at the open.
If the Control Panel is set to Scan mode, only algorithms on the Algorithms Table are tested, and only those which have a scan level less or equal to the scan level specified on the Control Panel. Algorithms with scan level of zero will be removed from the table on the next scan. You can add as many algorithm rows to the table as you like.
If the Control Panel is set to Seek mode, the solver will first scan all the algorithms with scan level of 1 through 9. It then goes looking for other strategies. When it is done, the top 100 strategies it finds will be added to the Algorithm table with a scan level 0 (a dash in the first column). You can then view these results. All these level 0 results will be removed on the next Solve cycle, unless you change the scan level in column A.