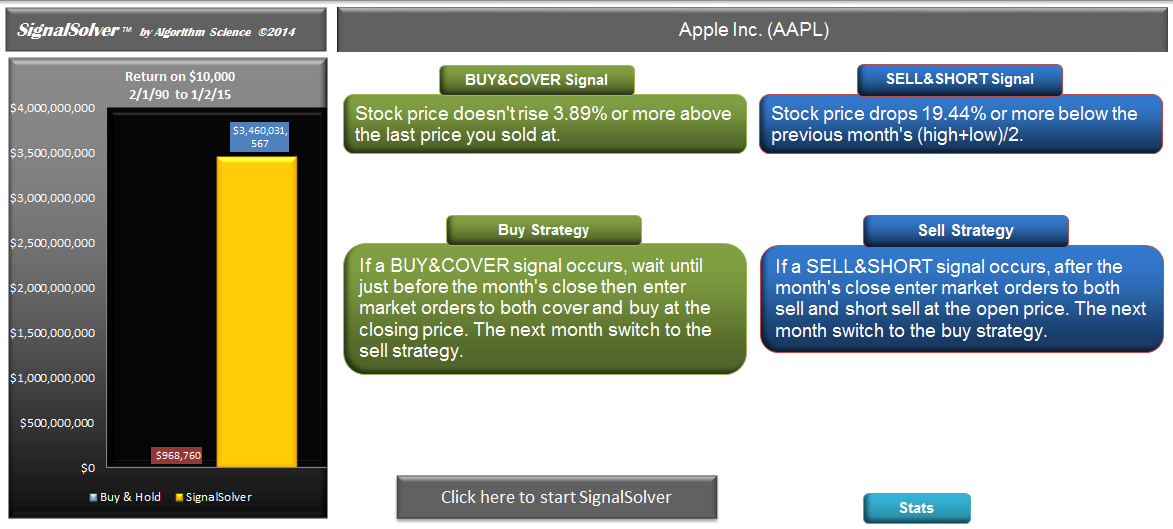
 The Wizard tab gives you a simple way to find strategies--just enter a stock symbol and SignalSolver will find a strategy.
 You can switch between Stats view and signal view. Stats view gives interesting statistics on the strategy.
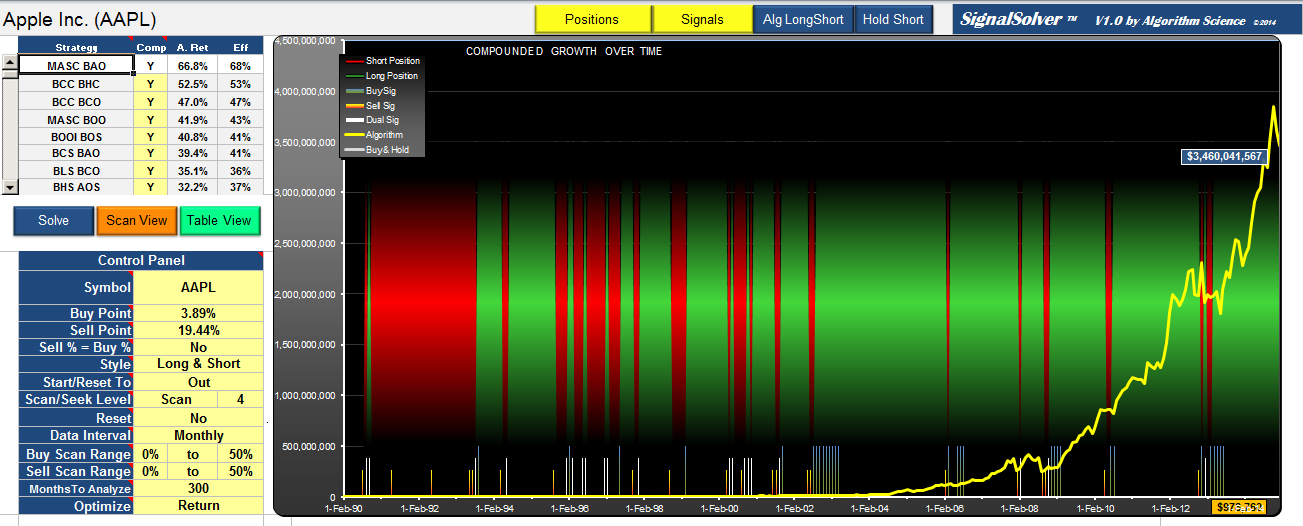 On the Report Tab, there are 3 views available. This is the Time View which shows how the investment changes value over time. The Report tab also has the control panel to enable you to change the backtest settings.
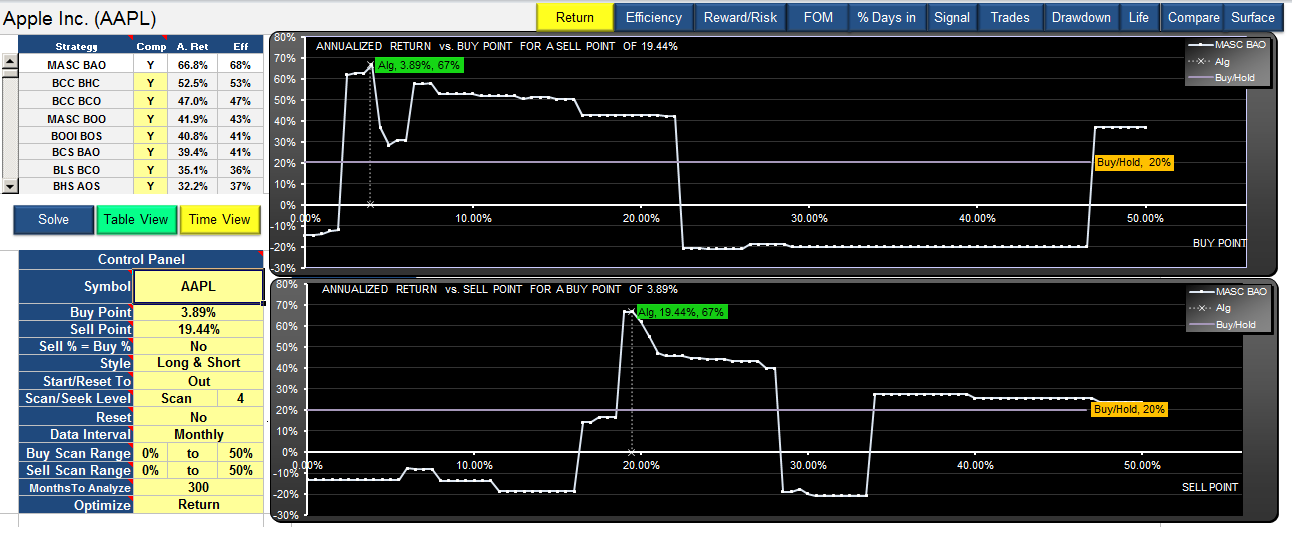 The second Report Tab view is the Scan View. It shows how the return changes as the buy and sell percentages change
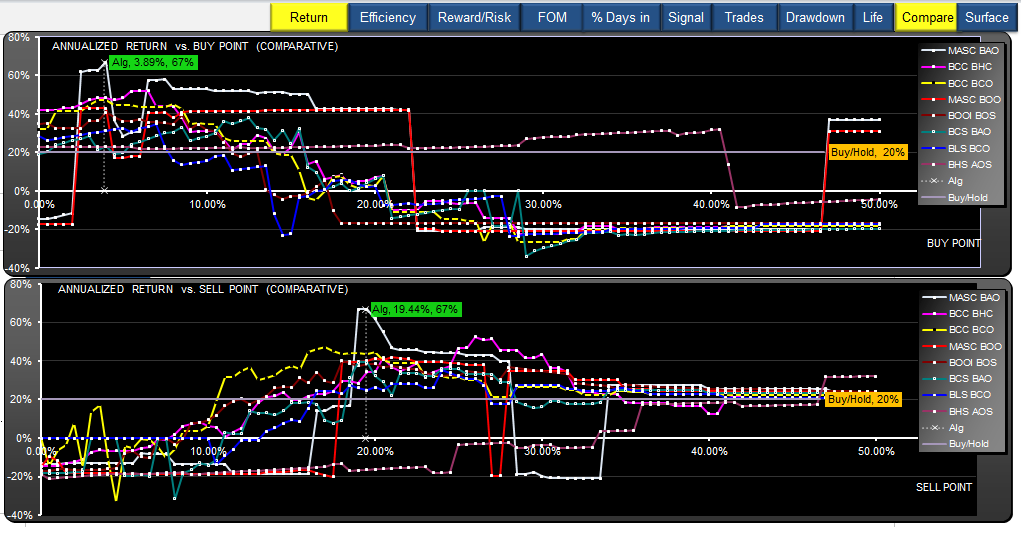 Another feature of Scan View--you can compare up to eight strategies side by side to see how sensitive the buy and sell percentages are
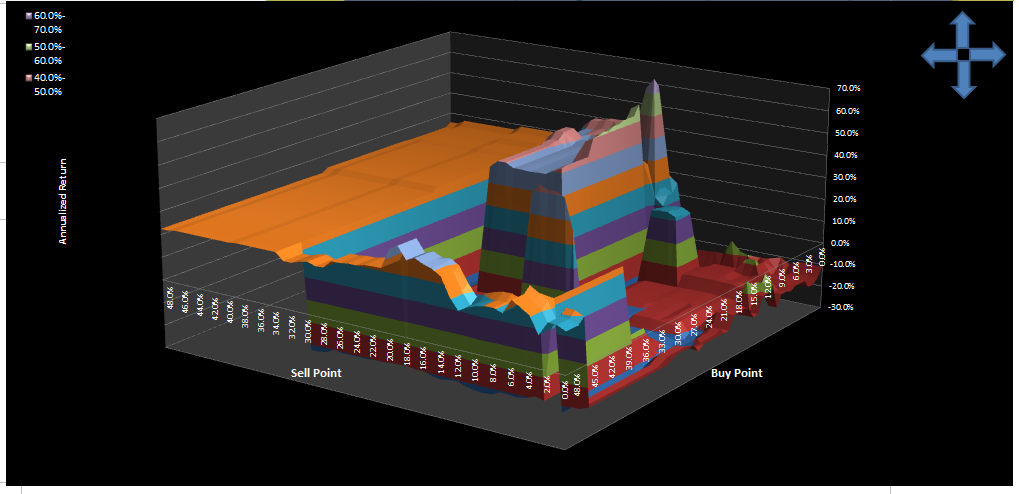 Yet another feature of Scan View on the Report Tab is a surface plot of Return vs buy point vs sell point.
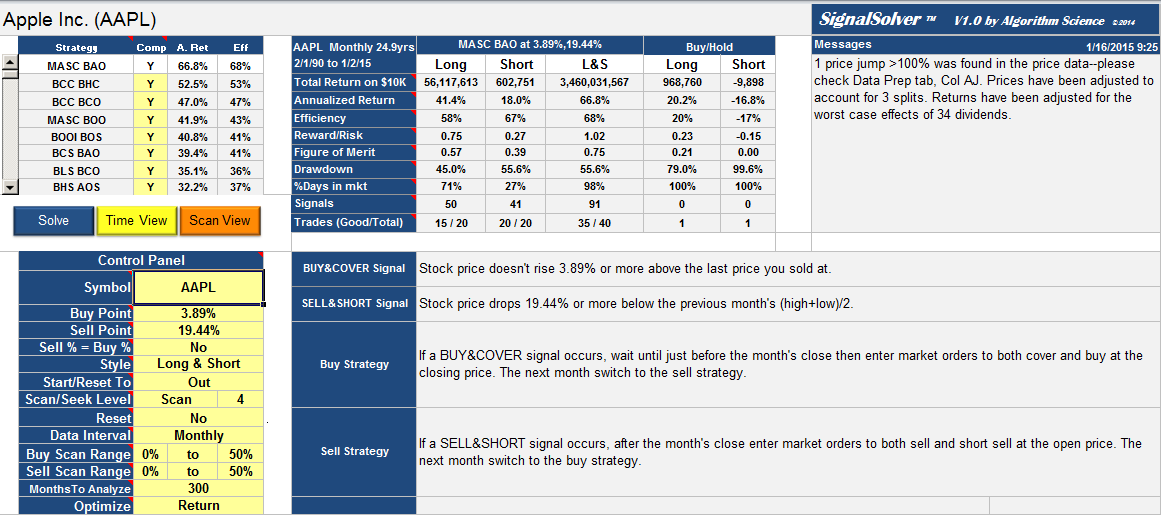 The Table View on the Report Tab gives you a tabular presentation of the performance of the selected strategy.
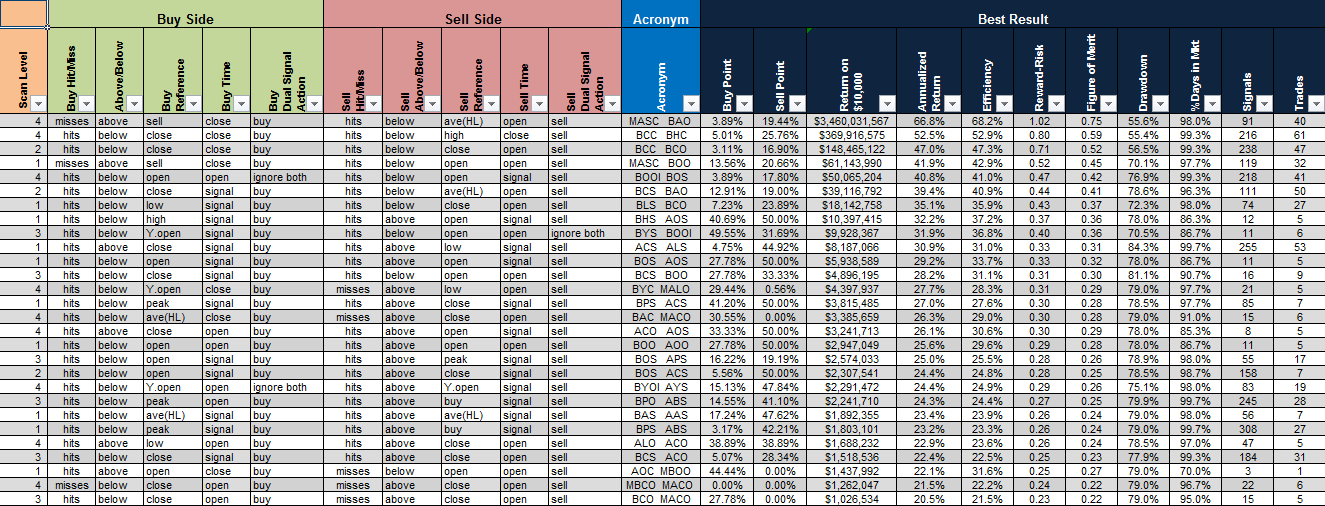 The Algorithms tab lets you browse through the strategies in order to compare strategies. It also allows you to easily enter your own algorithms ready for backtesting.
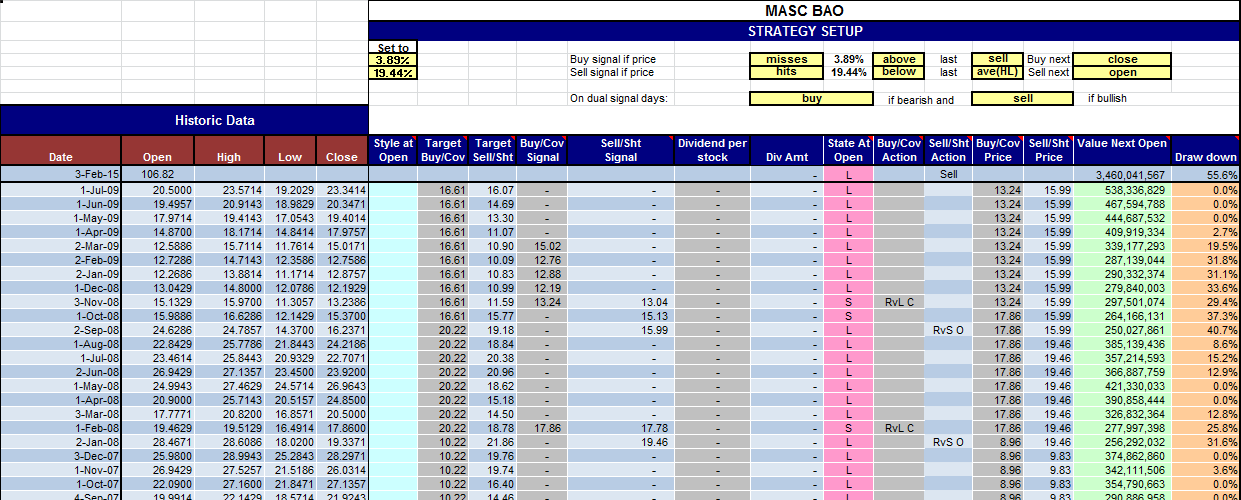 The Strategy tab is where you can take a detailed look at the backtests. For eight strategies, all the buys and sells are shown, as well as the value over time, the drawdown. signals, buy and sell actions and all the historic price data