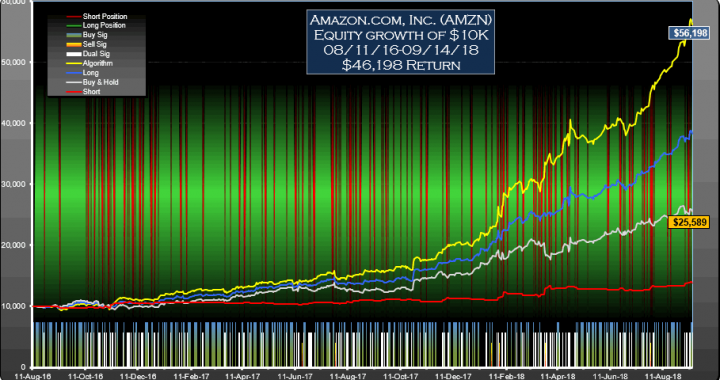
These Amazon.com, Inc. (AMZN) signals traded as directed would have performed around 3.6 times better than buy-hold with an ROI of 391% for the period 02-Nov-16 to 07-Dec-18. This is a symmetrical algorithm with no buy or sell bias.
"The trading signals for Amazon.com, Inc. (AMZN) were selected for their reward/risk, longevity and parameter sensitivity characteristics. Backtests don't always generate reliable signals which can be counted on moving forward but many traders find value in knowing what buy and sell signals would have worked well in the past.
Returns for the Amazon.com, Inc. (AMZN) signals
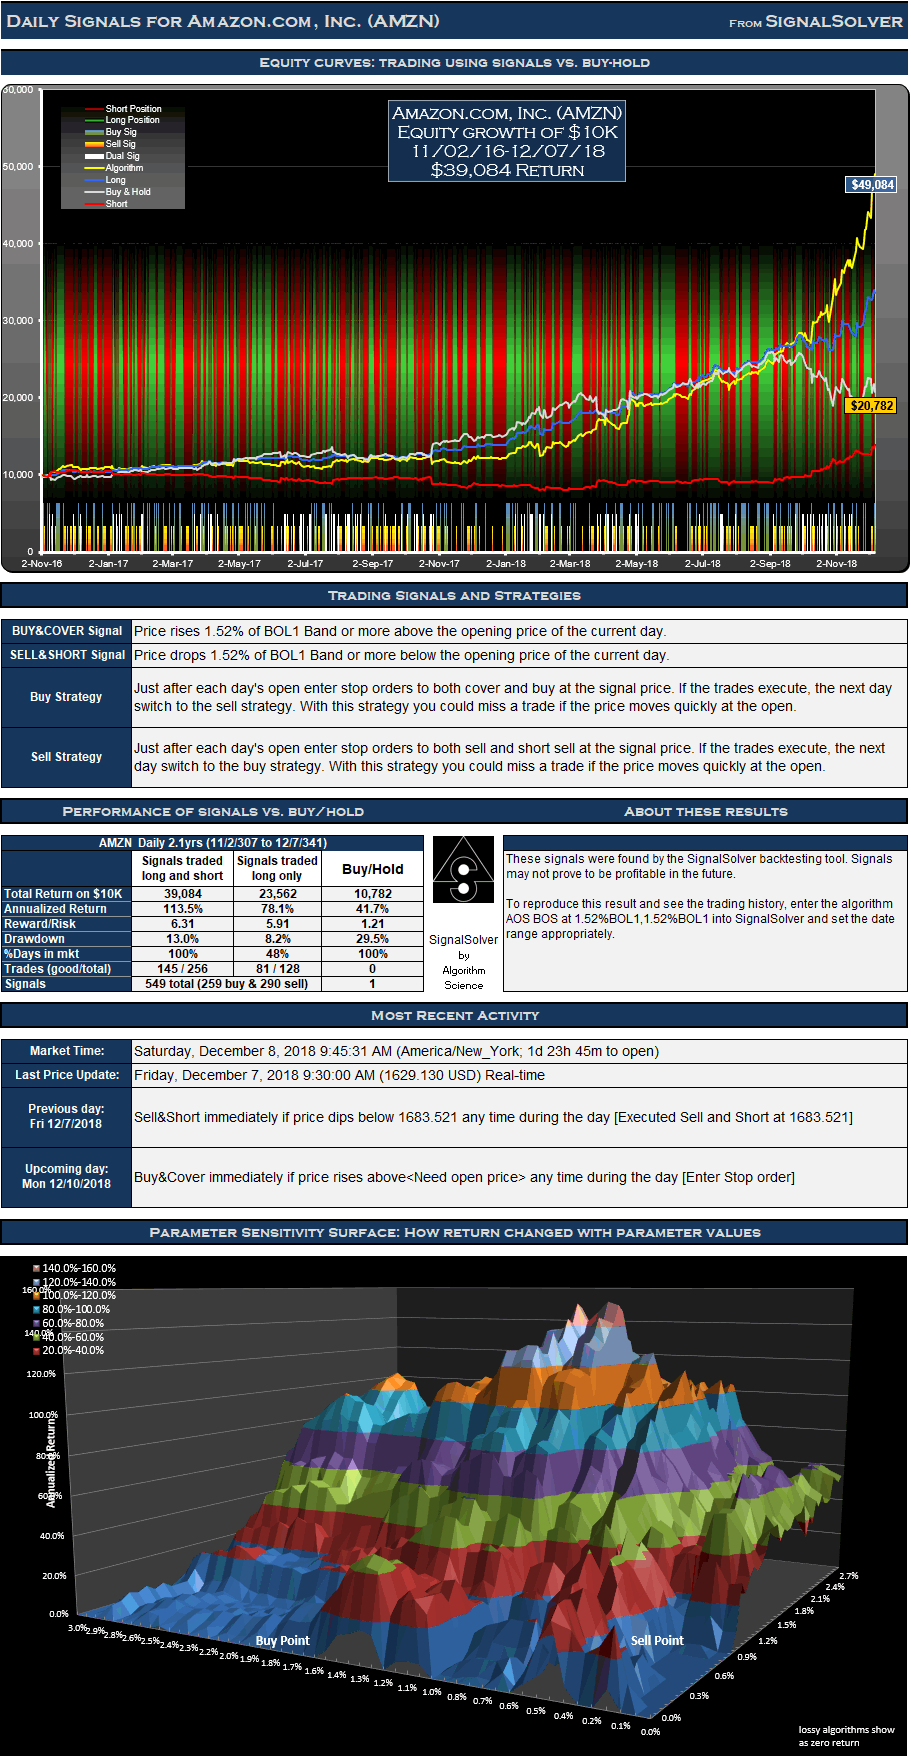
For the 528 day (2.1 year) period from Nov 2 2016 to Dec 7 2018, these signals for Amazon.com, Inc. (AMZN) traded both long and short would have yielded $39,084 in profits from a $10,000 initial investment, an annualized return of 113.5%. Traded long only (no short selling) the signals would have returned $23,562, an annualized return of 78.1%. 47.8% of time was spent holding stock long. The return would have been $10,782 (an annualized return of 41.7%) if you had bought and held the stock for the same period.
Signals and Trades
We call this a daily strategy as daily OHLC data is used in the numerical analysis leading to at most one buy signal and one sell signal per day. However, not all signals result in trades. If you are already long in a security, buy signals are not acted upon, similarly if you are short you should ignore sell signals. There were 259 buy signals and 290 sell signals for this particular AMZN strategy which in turn led to 128 round trip long trades of which 81 were profitable, and 128 short trades of which 64 were profitable.
Drawdown and Reward/Risk
Drawdown (the worst case loss for an single entry and exit into the strategy) was 13% for long-short and 8% for long only. This compares to 29% for buy-hold. The reward/risk for the trading long and short was 6.31 compared to 1.21 for buy-hold, a factor of 5.2 improvement. If traded long only, the reward/risk was 5.91. We use drawdown plus 5% as our risk metric, and annualized return as the reward metric.
The algorithm uses Bollinger bands with an SD (Excel STDEVPA) of the trailing 50 (H+L)/2 prices, scaled by a factor of 10.
The backtests assume a commission per trade of $7. "