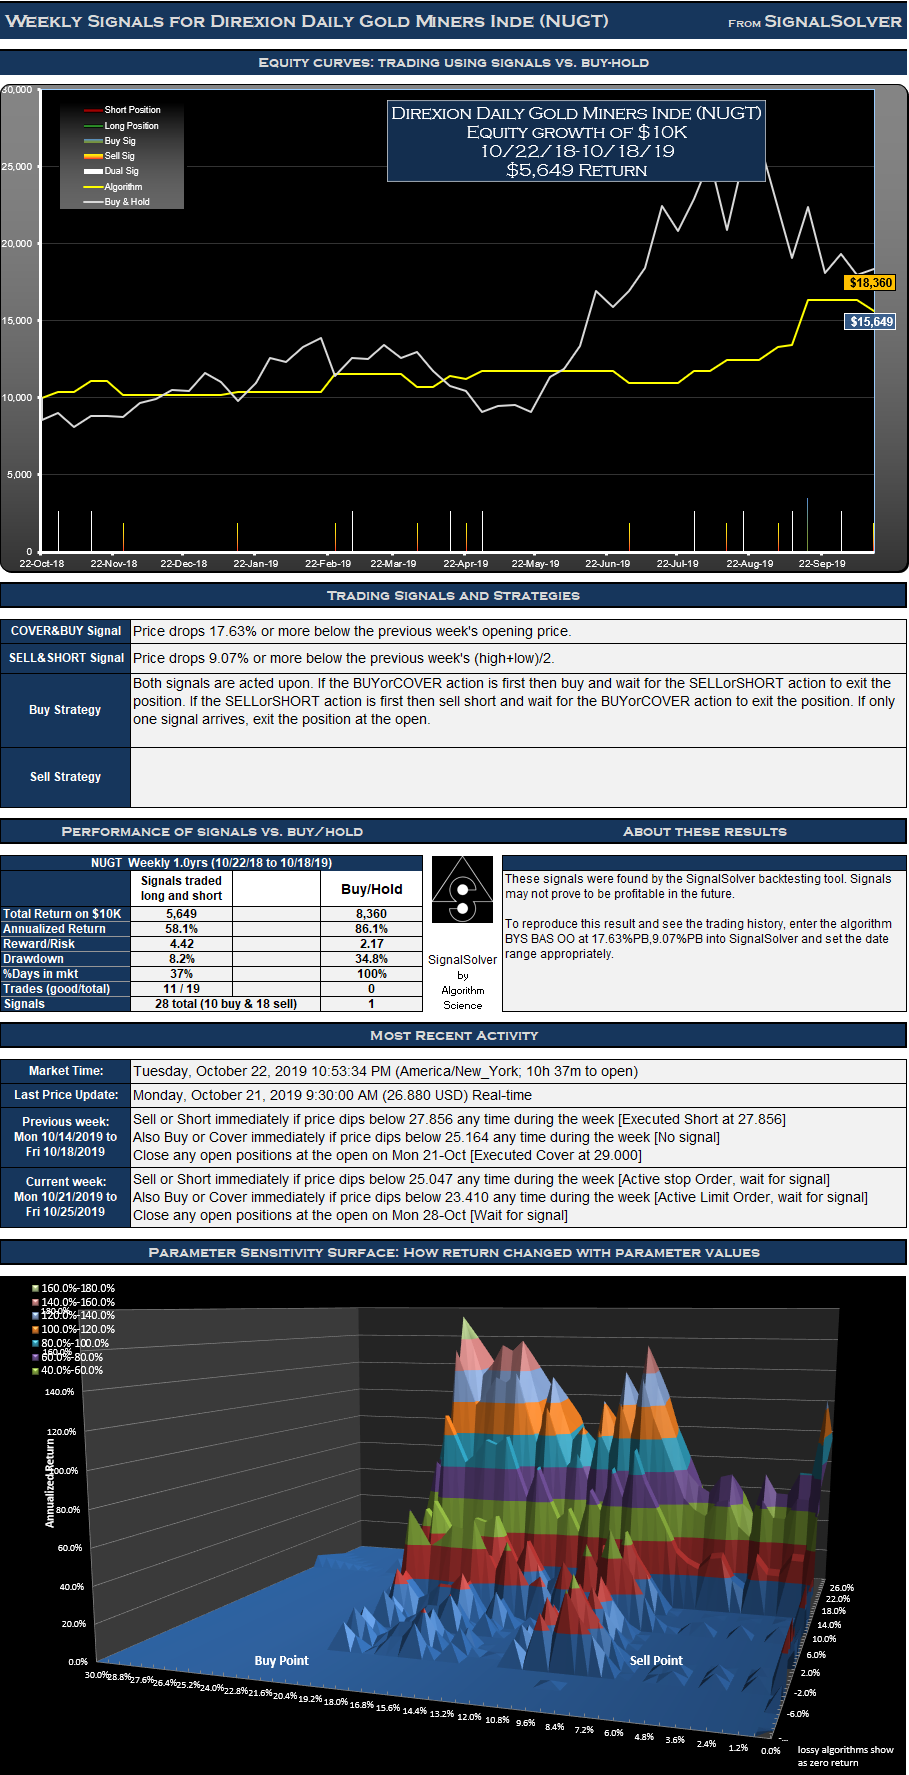
These Direxion Daily Gold Miners Inde (NUGT) signals traded as directed would have performed only around 0.7 times as well as buy-hold with an ROI of 56% for the period 22-Oct-18 to 18-Oct-19. However the reward/risk was twice as good as buy-hold because drawdown was only 8% compared with 34% for buy-hold. Furthermore the capital was in the market for about a third of the time of buy-hold so efficiency (=return/%time in mkt) was around 159% for the year, meaning that return would have been 159% if the capital could have been invested for the whole period at the same rate.
The trading signals for Direxion Daily Gold Miners Inde (NUGT) were selected for their reward/risk, longevity and parameter sensitivity characteristics. Backtests don't always generate reliable signals which can be counted on moving forward but many traders find value in knowing what buy and sell signals would have worked well in the past.
Returns for the Direxion Daily Gold Miners Inde (NUGT) signals
For the 52 week (1.0 year) period from Oct 22 2018 to Oct 18 2019, these signals for Direxion Daily Gold Miners Inde (NUGT) traded both long and short would have yielded $5,649 in profits from a $10,000 initial investment, an annualized return of 58.1%. Traded long only (no short selling) the signals would have returned $4,169, an annualized return of 42.8%. 10.6% of time was spent holding stock long. The return would have been $8,360 (an annualized return of 86.1%) if you had bought and held the stock for the same period.
Signals and Trades
We call this a weekly strategy as weekly OHLC data is used in the numerical analysis leading to at most one buy signal and one sell signal per week. The strategy detailed has cover/buy and sell/short signals, which often result in a buy and sell each week or short and cover, but any open positions must be closed out at the following open. For the 52 week period here, positions were only held for 37% of the weeks, leaving capital free to be used for other purposes for the remainder.
Drawdown and Reward/Risk
Drawdown (the worst case loss for an single entry and exit into the strategy) was 8%. This compares to 35% for buy-hold. The reward/risk for the trading long and short was 4.42 compared to 2.17 for buy-hold, a factor of 2.0 improvement. We use drawdown plus 5% as our risk metric, and annualized return as the reward metric.
The backtests assume a commission per trade of $7. Returns have been adjusted for the worst case effects of 3 dividends.
Trade List
| Week of signal | Buy or Sell | Price | L&S Value Next Open |
| 10/29/2018 | Buy | 13.08 | 10,353 |
| 10/29/2018 | Sell | 13.57 | 10,353 |
| 11/12/2018 | Buy | 11.80 | 11,122 |
| 11/12/2018 | Sell | 12.73 | 11,122 |
| 11/26/2018 | Buy | 13.91 | 10,215 |
| 11/26/2018 | Sell | 12.88 | 10,215 |
| 1/14/2019 | Buy | 15.55 | 10,388 |
| 1/14/2019 | Sell | 15.84 | 10,388 |
| 2/25/2019 | Buy | 18.10 | 11,559 |
| 2/25/2019 | Sell | 20.43 | 11,559 |
| 3/4/2019 | Buy | 18.10 | 11,545 |
| 3/4/2019 | Sell | 18.10 | 11,545 |
| 4/1/2019 | Buy | 20.52 | 10,688 |
| 4/1/2019 | Sell | 19.12 | 10,688 |
| 4/15/2019 | Buy | 16.90 | 11,429 |
| 4/15/2019 | Sell | 18.14 | 11,429 |
| 4/22/2019 | Buy | 16.51 | 11,248 |
| 4/22/2019 | Sell | 16.27 | 11,248 |
| 4/29/2019 | Buy | 14.06 | 11,761 |
| 4/29/2019 | Sell | 14.74 | 11,761 |
| 7/1/2019 | Buy | 26.74 | 10,984 |
| 7/1/2019 | Sell | 25.11 | 10,984 |
| 7/29/2019 | Buy | 29.17 | 11,748 |
| 7/29/2019 | Sell | 31.31 | 11,748 |
| 8/12/2019 | Buy | 33.02 | 12,450 |
| 8/12/2019 | Sell | 35.16 | 12,450 |
| 8/19/2019 | Buy | 33.02 | 12,436 |
| 8/19/2019 | Sell | 33.02 | 12,436 |
| 9/3/2019 | Buy | 35.30 | 13,284 |
| 9/3/2019 | Sell | 37.93 | 13,284 |
| 9/9/2019 | Buy | 34.80 | 13,459 |
| 9/9/2019 | Sell | 35.30 | 13,459 |
| 9/16/2019 | Buy | 29.08 | 16,347 |
| 9/16/2019 | Sell | 35.35 | 16,347 |
| 9/30/2019 | Buy | 28.60 | 16,333 |
| 9/30/2019 | Sell | 28.60 | 16,333 |
| 10/14/2019 | Buy | 29.00 | 15,649 |
| 10/14/2019 | Sell | 27.86 | 15,649 |
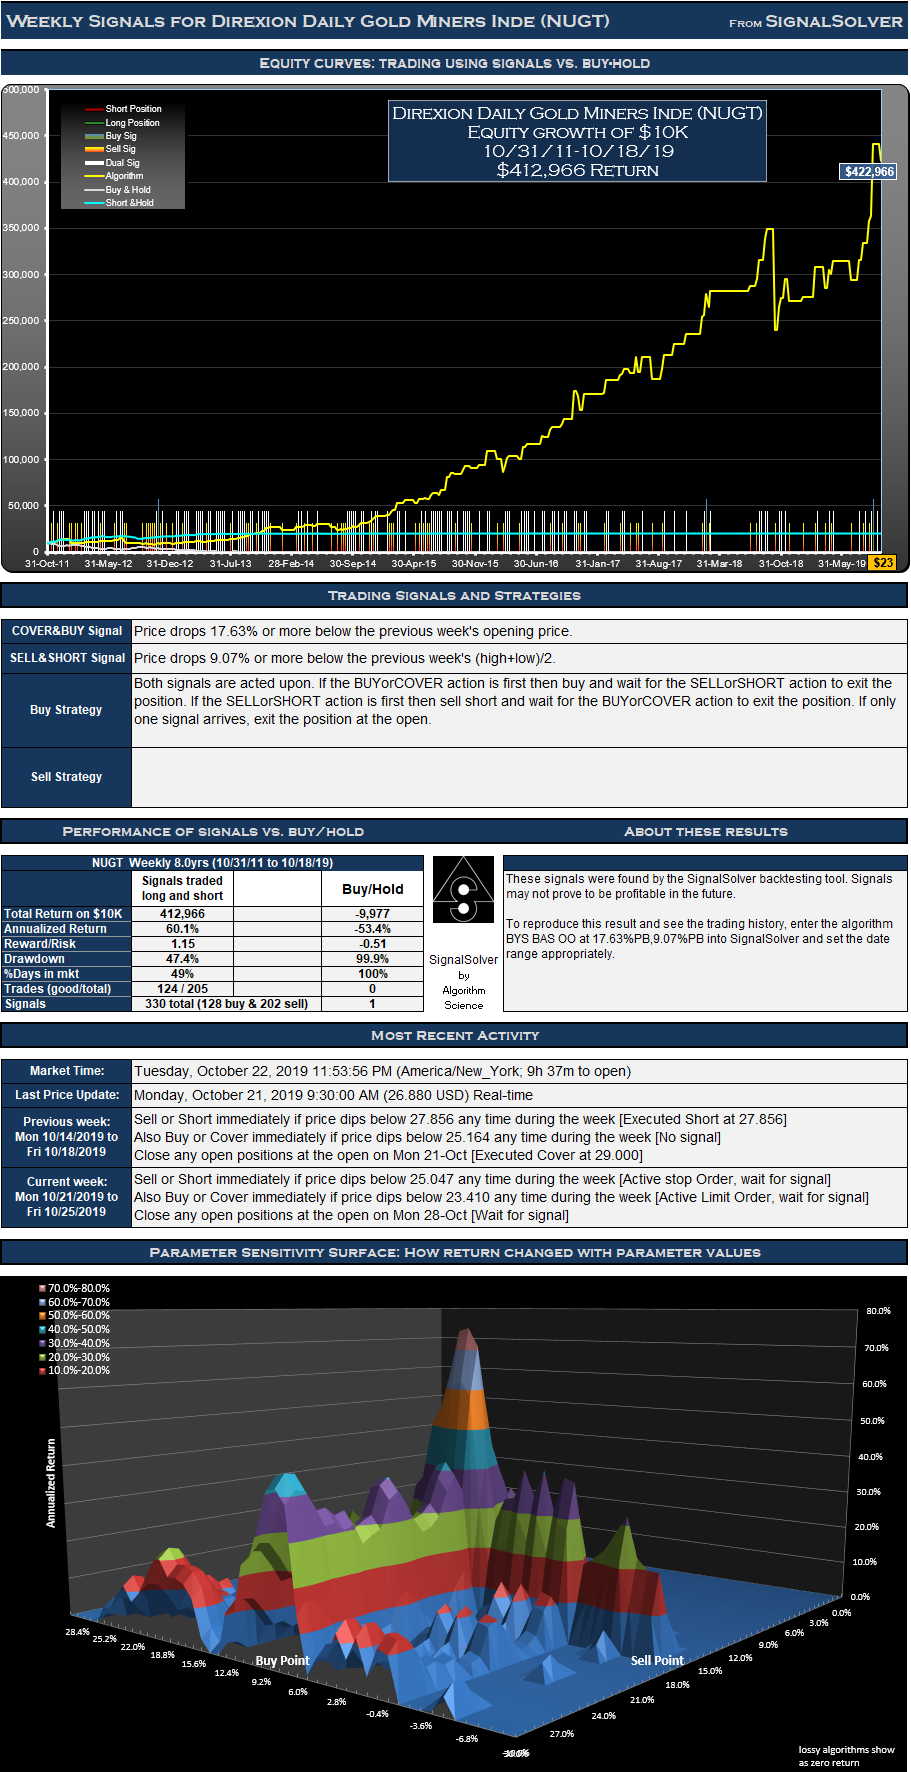
8 year performance
For completeness, below is the 8 year performance for the same algorithm. This would have averaged 60% annualized return a year which translates to $412,966 for a $10,000 outlay. Short-hold would have returned $9,977 (9.1% annualized return) over the period with a drawdown of 17.9% and efficiency 122% (weeks in mkt=49%).
Update Jan 9th 2020
Algorithm didn't trade in Dec 2019, but yesterday shorted at 31.98. Performance is pretty flat right now for the algorithm and the underlying.
Trades since inception as of 1/9/20
| Date | Type | Buy/Cov | Sell/Sht | Asset Value |
| 23-Oct-2019 | $ 10,000 | |||
| 7-Nov-2019 | Short | 26.743 | $ 10,278 | |
| 11-Nov-2019 | Cover | 25.560 | $ 10,442 | |
| 11-Nov-2019 | Short | 25.501 | $ 10,442 | |
| 11-Nov-2019 | Cover | 25.329 | $ 10,513 | |
| 25-Nov-2019 | Short | 25.183 | $ 10,513 | |
| 27-Nov-2019 | Cover | 27.130 | $ 9,700 | |
| 8-Jan-2020 | Short | 31.980 | $ 9,700 | |
| 9-Jan-2020 | Last | 31.380 | $ 9,882 |