Bitcoin (BTC-USD) Signals-Weekly (ACS AAO)

Original Post Nov 2019:

While shorting Bitcoin might be tricky, with this algorithm it would have paid off. Traded as directed these signals would have performed around 103.1 times better than buy-hold for the period 09-Nov-15 to 01-Nov-19.

The trading signals for Bitcoin USD (BTC-USD) were selected for their reward/risk, longevity and parameter sensitivity characteristics. Backtests don't always generate reliable signals which can be counted on moving forward but many traders find value in knowing what buy and sell signals would have worked well in the past.

Bitcoin Signals (BTC-USD)

The trading signals for Bitcoin USD (BTC-USD) were selected for their reward/risk, longevity and parameter sensitivity characteristics. Backtests don't always generate reliable signals which can be counted on moving forward but many traders find value in knowing what buy and sell signals would have worked well in the past.

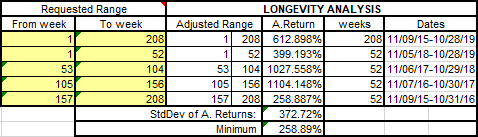
Returns for the Bitcoin USD (BTC-USD) signals

For the 208 week (4.0 year) period from Nov 9 2015 to Nov 1 2019, these signals for Bitcoin USD (BTC-USD) traded both long and short would have yielded $24,314,581 in profits from a $10,000 initial investment, an annualized return of 612.9%. Traded long only (no short selling) the signals would have returned $3,629,957, an annualized return of 341.8%. 42.5% of time was spent holding the currency long. The return would have been $235,929 (an annualized return of 124.1%) if you had bought and held Bitcoin for the same period. Minimum annual return for the four years in the analysis was 258.89%
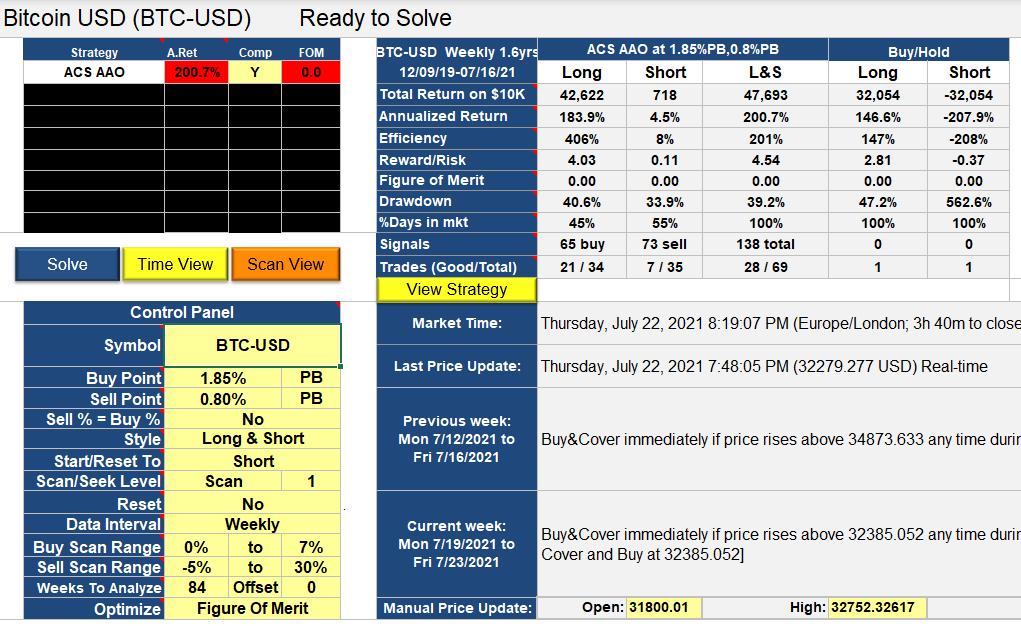
Signals and Trades

We call this a weekly strategy as weekly OHLC data is used in the numerical analysis leading to at most one buy signal and one sell signal per week. However, not all signals result in trades. If you are already long in a security, buy signals are not acted upon, similarly if you are short you should ignore sell signals. There were 145 buy signals and 170 sell signals for this particular BTC-USD strategy which in turn led to 80 round trip long trades of which 56 were profitable, and 80 short trades of which 22 were profitable. There were only 15 clear buy signals and 40 clear sell signals, the remaining 130 signals were dual signals (buy and sell signals in the same week), which leads to a lot of reversals. Despite all the signal noise, drawdown was fairly constrained.

Drawdown and Reward/Risk

Drawdown (the worst case loss for an single entry and exit into the strategy) was 26% for long-short and 25% for long only. This compares to 83% for buy-hold. The reward/risk for the trading long and short was 19.70 compared to 1.41 for buy-hold, a factor of 14.0 improvement. If traded long only, the reward/risk was 11.50. We use drawdown plus 5% as our risk metric, and annualized return as the reward metric.

The backtests assume a commission per trade of $7.

Trade List

Click to see trades

Trade Types -

"Buy S" -- buy at signal price (initiated by a stop-buy order)
"RvS O" -- reversal to short at open (market sell and short orders)
"RvL S" -- reversal to long at the signal (stop-cover and stop-buy orders)

Date Trade Type Price Equity Value (at open)
10,000
11/16/2015 Buy S 326.09 9,940
11/23/2015 RvS O 371.44 11,369
11/30/2015 RvL S 378.16 11,497
12/7/2015 RvS O 433.27 12,760
12/14/2015 RvL S 441.78 12,525
12/21/2015 RvS O 423.34 11,960
12/28/2015 RvL S 430.65 11,723
1/4/2016 RvS O 448.70 12,217
1/18/2016 RvL S 389.37 14,278
2/1/2016 RvS O 376.76 13,357
2/8/2016 RvL S 383.59 13,920
2/15/2016 RvS O 438.99 14,979
3/7/2016 RvL S 415.25 15,735
3/14/2016 RvS O 413.42 15,692
3/21/2016 RvL S 421.41 15,562
3/28/2016 RvS O 421.30 15,356
4/11/2016 RvL S 429.36 14,987
4/18/2016 RvS O 459.12 16,077
4/25/2016 RvL S 467.04 15,275
5/2/2016 RvS O 458.21 15,473
5/23/2016 RvL S 447.45 18,688
5/30/2016 RvS O 574.60 20,305
6/6/2016 RvL S 585.61 22,826
6/13/2016 RvS O 763.93 25,948
6/27/2016 RvL S 641.01 30,944
7/4/2016 RvS O 648.48 30,446
7/11/2016 RvL S 661.37 30,658
7/18/2016 RvS O 661.26 29,808
8/15/2016 RvL S 581.03 33,427
8/22/2016 RvS O 574.07 32,996
8/29/2016 RvL S 584.53 33,736
9/5/2016 RvS O 607.01 33,612
9/26/2016 RvL S 611.94 33,272
10/3/2016 RvS O 616.82 33,577
10/10/2016 RvL S 628.16 33,662
10/17/2016 RvS O 657.16 34,452
10/24/2016 RvL S 669.23 35,494
10/31/2016 RvS O 710.74 35,889
11/7/2016 RvL S 724.69 34,069
11/14/2016 RvS O 731.27 35,476
11/21/2016 RvL S 744.55 34,253
11/28/2016 RvS O 773.39 36,152
12/12/2016 RvL S 783.97 35,949
12/19/2016 RvS O 896.91 40,764
12/26/2016 RvL S 912.76 43,795
1/3/2017 RvS O 913.24 40,037
1/17/2017 RvL S 837.00 47,950
1/23/2017 RvS O 920.15 47,659
1/30/2017 RvL S 936.51 51,390
2/6/2017 RvS O 998.89 49,901
2/13/2017 RvL S 1,017.67 50,441
2/21/2017 RvS O 1,163.78 55,963
2/27/2017 RvL S 1,186.76 58,574
3/6/2017 RvS O 1,221.78 56,448
3/13/2017 RvL S 1,243.98 46,201
3/20/2017 RvS O 972.05 43,283
3/27/2017 RvL S 984.61 47,844
4/3/2017 RvS O 1,187.30 51,488
4/17/2017 RvL S 1,204.82 50,917
4/24/2017 RvS O 1,348.30 56,740
5/1/2017 RvL S 1,372.83 64,785
5/8/2017 RvS O 1,808.44 73,352
5/15/2017 RvL S 1,842.37 79,805
5/22/2017 RvS O 2,159.43 84,331
5/30/2017 RvL S 2,195.68 94,860
6/5/2017 RvS O 2,953.22 111,490
6/19/2017 RvL S 2,595.43 124,749
7/3/2017 RvS O 2,525.25 121,589
7/17/2017 RvL S 1,965.52 206,498
7/24/2017 RvS O 2,763.24 208,792
7/31/2017 RvL S 2,808.19 234,972
8/7/2017 RvS O 4,066.10 297,367
8/14/2017 RvL S 4,148.62 287,236
8/21/2017 RvS O 4,384.45 307,865
8/28/2017 RvL S 4,463.96 310,912
9/5/2017 RvS O 4,122.47 279,130
9/11/2017 RvL S 4,199.21 234,251
9/18/2017 RvS O 3,681.58 240,140
9/25/2017 RvL S 3,750.97 276,102
10/2/2017 RvS O 4,614.52 289,825
10/9/2017 RvL S 4,695.77 344,841
10/16/2017 RvS O 6,006.00 364,134
10/23/2017 RvL S 6,119.58 356,958
10/30/2017 RvS O 7,403.22 432,153
11/6/2017 RvL S 7,544.45 333,649
11/13/2017 RvS O 8,039.07 451,673
11/20/2017 RvL S 8,185.17 506,705
11/27/2017 RvS O 11,315.40 613,024
12/4/2017 RvL S 11,532.68 804,284
12/11/2017 RvS O 19,106.40 996,069
12/26/2017 RvL S 14,183.43 1,246,412
1/2/2018 RvS O 16,476.20 1,455,190
1/16/2018 RvL S 14,026.78 1,386,266
1/22/2018 RvS O 11,755.50 1,400,838
2/5/2018 RvL S 8,430.13 1,735,545
2/12/2018 RvS O 10,552.60 2,249,531
2/20/2018 RvL S 10,747.01 1,986,676
2/26/2018 RvS O 11,532.40 2,369,426
3/12/2018 RvL S 9,755.83 2,338,739
3/19/2018 RvS O 8,498.47 2,381,987
4/2/2018 RvL S 6,970.85 2,839,760
4/9/2018 RvS O 8,337.57 3,361,090
4/16/2018 RvL S 8,483.20 3,423,511
4/23/2018 RvS O 9,426.11 3,669,416
4/30/2018 RvL S 9,593.33 3,623,968
5/7/2018 RvS O 8,713.10 3,273,579
5/29/2018 RvL S 7,504.53 3,835,916
6/4/2018 RvS O 6,799.29 3,377,313
6/18/2018 RvL S 6,619.51 3,232,228
6/25/2018 RvS O 6,380.38 3,341,357
7/2/2018 RvL S 6,503.96 3,413,215
7/9/2018 RvS O 6,357.01 3,202,581
7/16/2018 RvL S 6,477.29 3,596,687
7/23/2018 RvS O 8,221.58 3,988,065
8/13/2018 RvL S 6,439.66 4,898,264
8/20/2018 RvS O 6,710.80 5,056,708
8/27/2018 RvL S 6,831.34 5,291,294
9/4/2018 RvS O 6,301.57 4,580,742
9/10/2018 RvL S 6,417.43 4,564,219
9/17/2018 RvS O 6,704.77 4,697,830
10/15/2018 RvL S 6,407.31 4,966,527
11/5/2018 RvS O 6,411.76 4,909,627
11/26/2018 RvL S 4,084.15 6,795,416
12/3/2018 RvS O 3,612.05 5,918,347
12/17/2018 RvL S 3,313.02 7,737,752
12/24/2018 RvS O 3,866.84 7,479,526
12/31/2018 RvL S 3,937.47 7,606,043
1/7/2019 RvS O 3,557.31 6,633,920
1/14/2019 RvL S 3,618.68 6,486,468
2/4/2019 RvS O 3,695.61 6,658,040
2/19/2019 RvL S 3,741.80 6,689,376
3/4/2019 RvS O 3,953.74 6,947,199
3/11/2019 RvL S 4,024.70 6,831,415
3/18/2019 RvS O 4,024.11 6,821,475
3/25/2019 RvL S 4,096.58 6,712,984
4/1/2019 RvS O 5,199.84 8,502,625
4/8/2019 RvL S 5,295.08 8,145,490
4/15/2019 RvS O 5,312.49 8,374,318
4/22/2019 RvL S 5,412.85 8,021,833
4/29/2019 RvS O 5,791.69 8,791,138
5/6/2019 RvL S 5,902.93 10,182,649
5/13/2019 RvS O 8,196.92 11,973,055
5/20/2019 RvL S 8,349.35 12,207,401
5/28/2019 RvS O 8,741.75 12,302,629
6/10/2019 RvL S 7,830.31 15,595,486
6/17/2019 RvS O 10,853.74 18,830,874
6/24/2019 RvL S 11,056.20 18,046,272
7/8/2019 RvS O 10,257.84 17,145,206
7/15/2019 RvL S 10,445.80 17,074,584
7/22/2019 RvS O 9,548.18 15,384,715
7/29/2019 RvL S 9,729.59 17,002,139
8/5/2019 RvS O 11,528.19 17,882,352
8/19/2019 RvL S 10,537.21 18,662,251
8/26/2019 RvS O 9,757.47 17,982,509
9/3/2019 RvL S 9,938.49 18,545,200
9/9/2019 RvS O 10,347.22 18,374,698
9/30/2019 RvL S 8,254.11 21,382,412
10/7/2019 RvS O 8,320.83 22,270,204
10/21/2019 RvL S 8,374.19 25,274,184
10/28/2019 RvS O 9,205.73 24,324,581
11/4/2019 Last 9,205.73 24,324,581

Updates

Dec 02 2019

No signal last week (7857.354). The sell signal (above 7284.448) arrived at this weeks open, but this algorithm sells at the next open, so the sell time is next week's open 12:00am GMT on Dec 9th 2019.


Update 1/9/20

Doing a bit better than the last update on 12/13/19.


Date Transaction Buy/Cover Sell/Short  Asset Value
 $           10,000
23-Oct-2019 Buy 8374.000  $           10,000
4-Nov-2019 Sell 9235.607  $           11,029
4-Nov-2019 Short 9235.607  $           11,029
4-Nov-2019 Cover 9406.209  $           10,825
4-Nov-2019 Buy 9406.209  $           10,825
9-Dec-2019 Sell 7561.795  $             8,703
9-Dec-2019 Short 7561.795  $             8,703
19-Dec-2019 Cover 7284.619  $             9,022
19-Dec-2019 Buy 7284.619  $             9,022
30-Dec-2019 Sell 7420.273  $             9,190
30-Dec-2019 Short 7420.273  $             9,190
6-Jan-2020 Cover 7548.427  $             9,031
6-Jan-2020 Buy 7548.427  $             9,031
9-Jan-2020 Last 7885.000  $             9,433

Update June 22 2021

Bitcoin algorithm performance

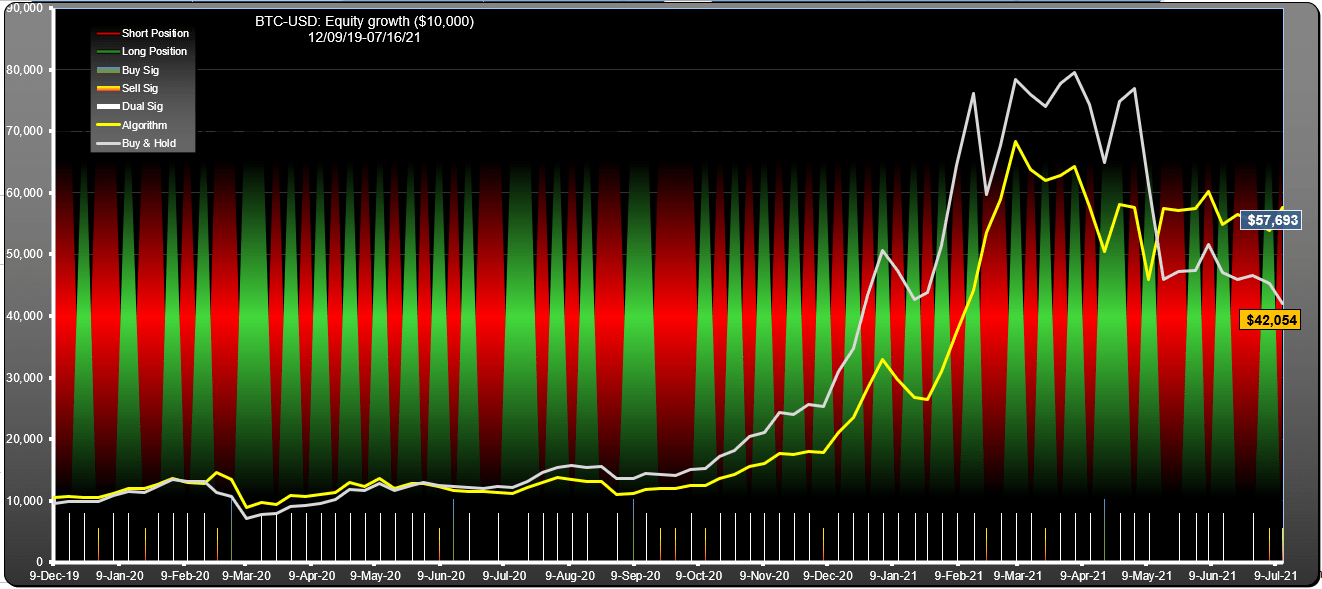
Since Dec 2019 to July 2021, this algorithm has performed better than bitcoin with higher gain, lower drawdown and significantly better reward-risk.

Bitcoin algorithm performs better than underlying security

Posted in Weekly Signals.

Leave a Reply

Your email address will not be published. Required fields are marked *

*