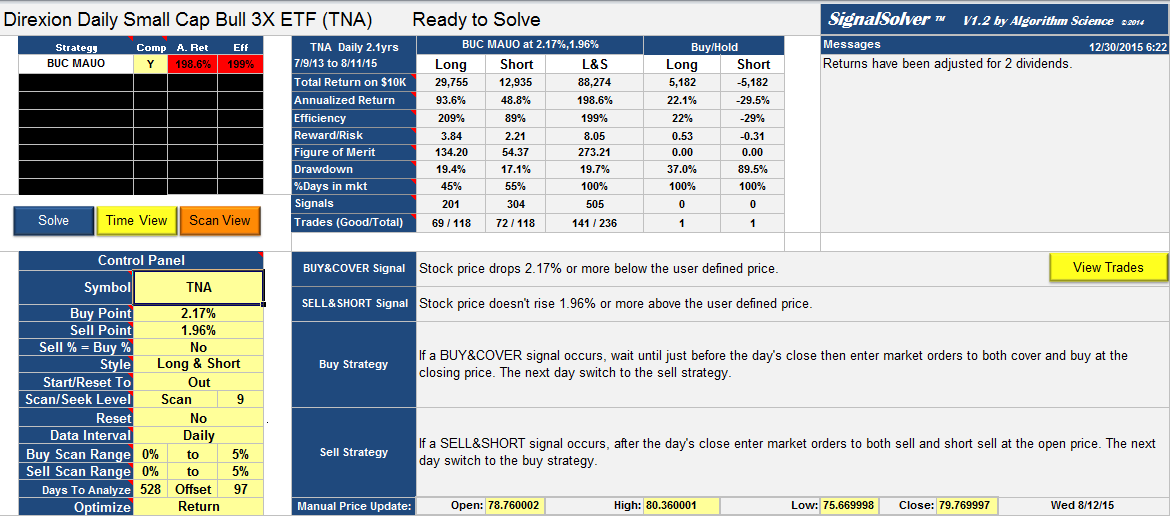
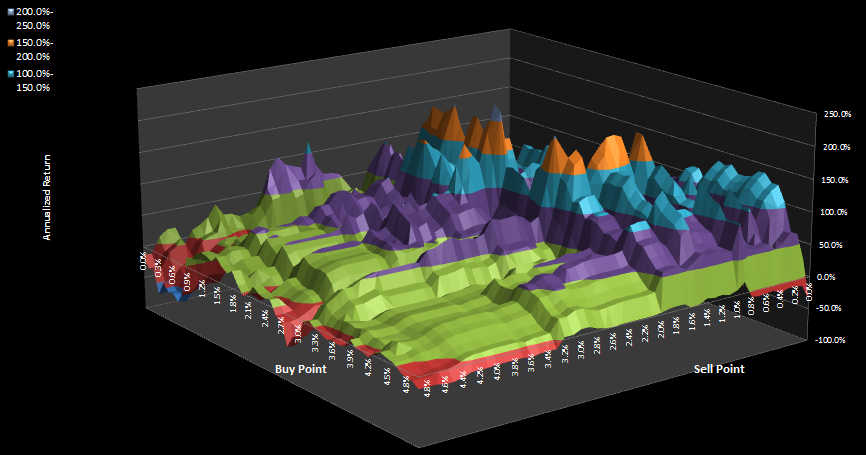
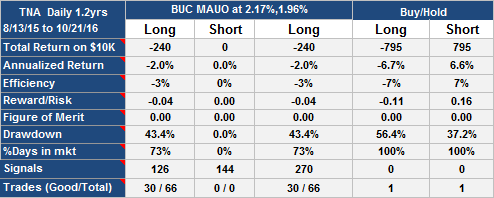
In contrast to yesterday’s TNA trading strategy optimized for low drawdown, this one is optimized for minimum quartus annual return, a new feature of SignalSolver. A quartus is one quarter of the data, 132 days in this instance, and the minimum return was 99% annualized for the most recent quartus Feb 3 to Aug 11th 2015.
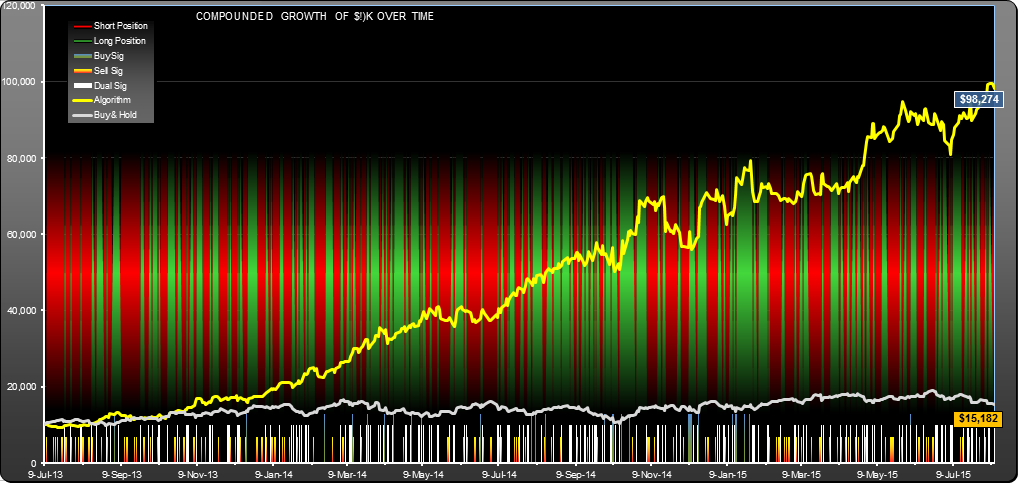
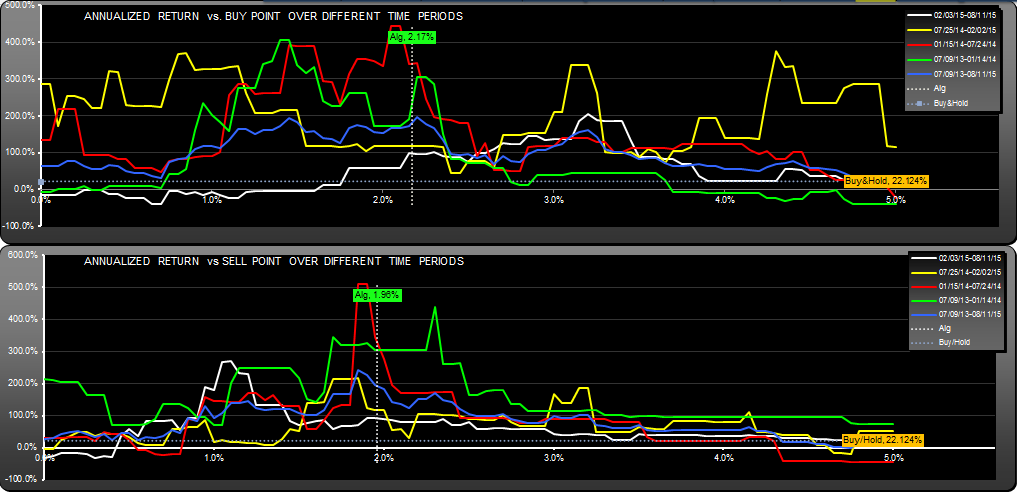
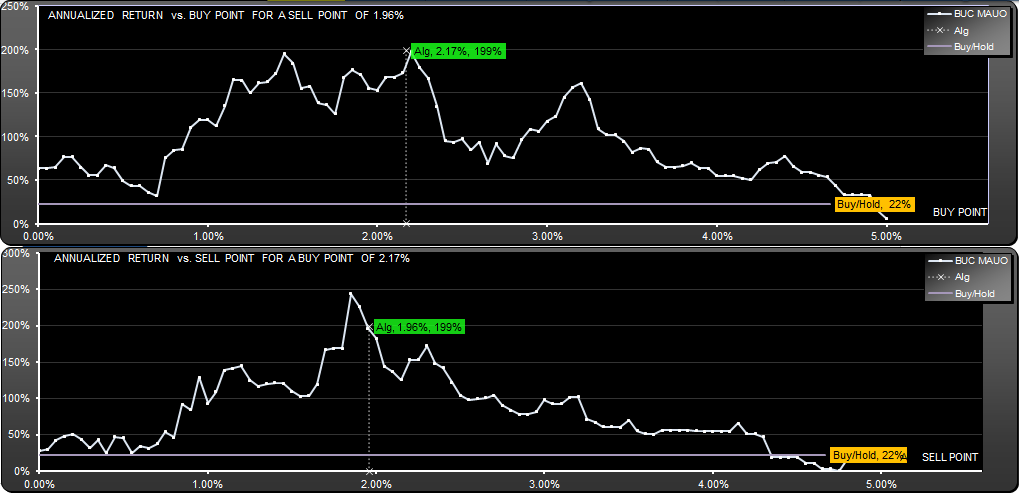
You can see how quartus annualized returns fluctuate with buy/sell parameters from the lifetime graphs. Note that this algorithm took both long and short positions–when you were not long, you were short. I have no idea how or why this kind of algorithm works–you would think the buy and sell signals are so similar that it would give more random returns, but you can see from the surface plot that the results are positive for most of the parameter space.
The “user defined price” was found by averaging the previous day’s high, the previous day’s low and the current day’s open price. Buying and selling was done at the daily close or next day’s open.
List of trades in .xlsx format: TNA-D Trades
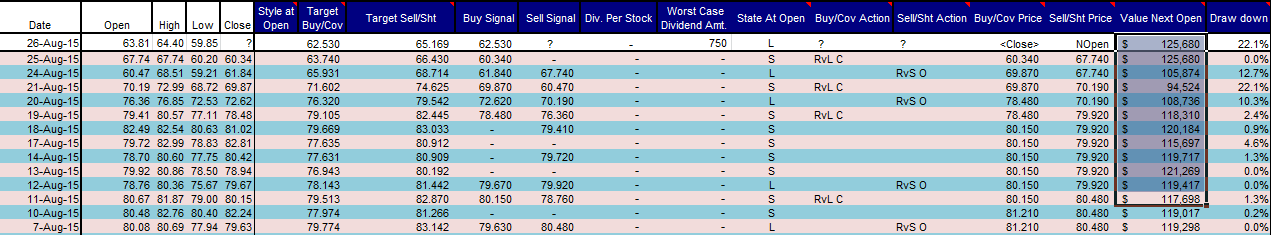
Update 8/26/2015
Trades since the original backtest endpoint on 8/11/2015:
Update 12/30/2015
The above analyses have been corrected for an error in the short-side returns. Overall gain of the original erroneous post was $104,971
Here are the updates for 12/30/15. The algorithm peaked around Oct 13th and now appears to be failing:
Update 10/20/2016
A bit of an improvement:
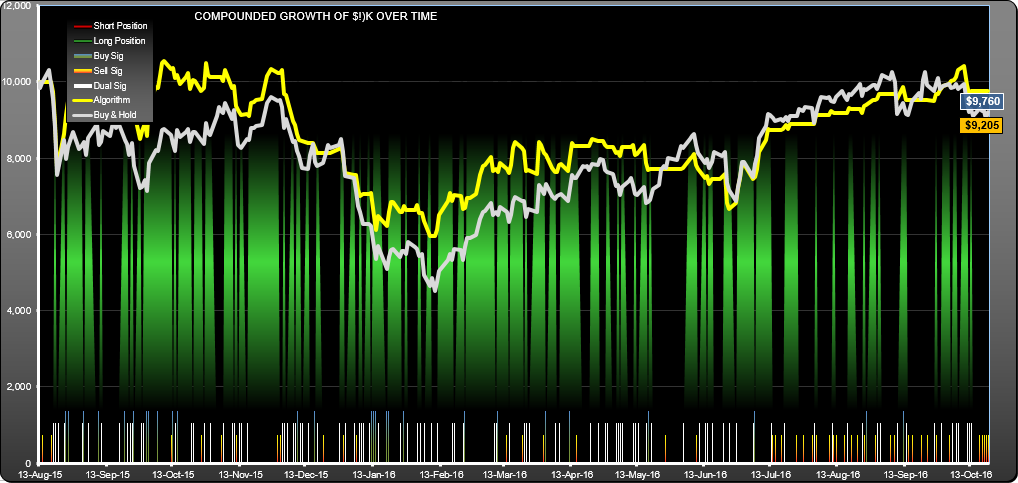
TNA Trading Strategy Update Oct 2016 Equity
Hi Andrew,
I read few of articles and your algorithm interests me a lot. Just wanted to check weather you do consultation for individual investor.
Thanks
Tejas Ray
Hi Tejas,
No, I don’t provide financial advice, but I can perform a numerical analysis on a stock or ETF of your choice and tell you what has worked in the past. That invitation is extended to all readers of this blog. Just let me know the symbol and if you are interested in daily, weekly or monthly data. Alternatively, you can simply download the tool from http://www.SignalSolver.com and find your own trading strategies, if you run Excel on Windows that is.
Warm regards,
Andrew
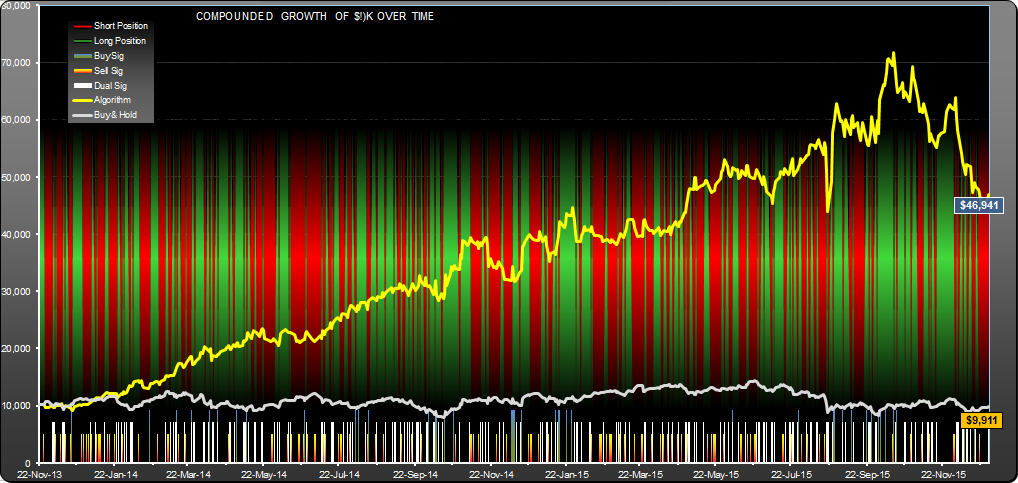
Update Aug 26 2015: Since posting on 8-11-2015, this strategy has gained 6.78% in value while TNA has lost 23% of its value.
Andrew