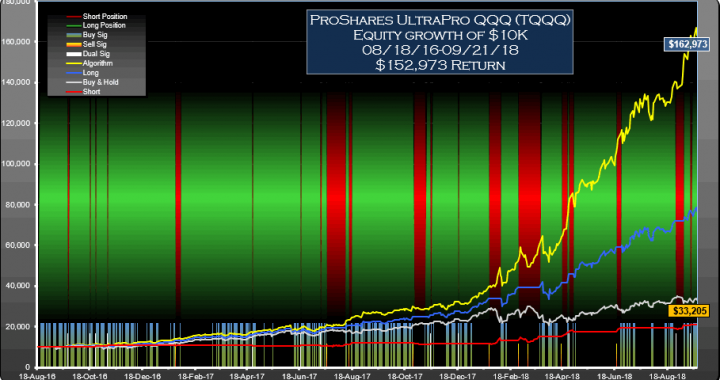
These TQQQ signals would have performed around 6.6 times better than buy-hold with an ROI of 1530% for the period 18-Aug-16 to 21-Sep-18
The trading signals for TQQQ were selected for their reward/risk and parameter sensitivity characteristics. Backtests don't always generate reliable signals which can be counted on moving forward but many traders find value in knowing what buy and sell signals would have worked well in the past.
Returns for the TQQQ signals
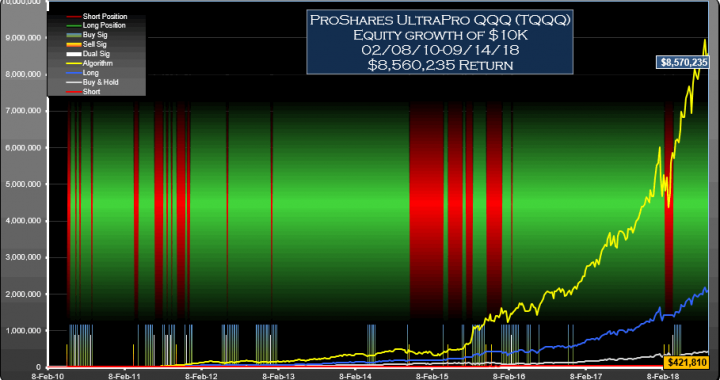
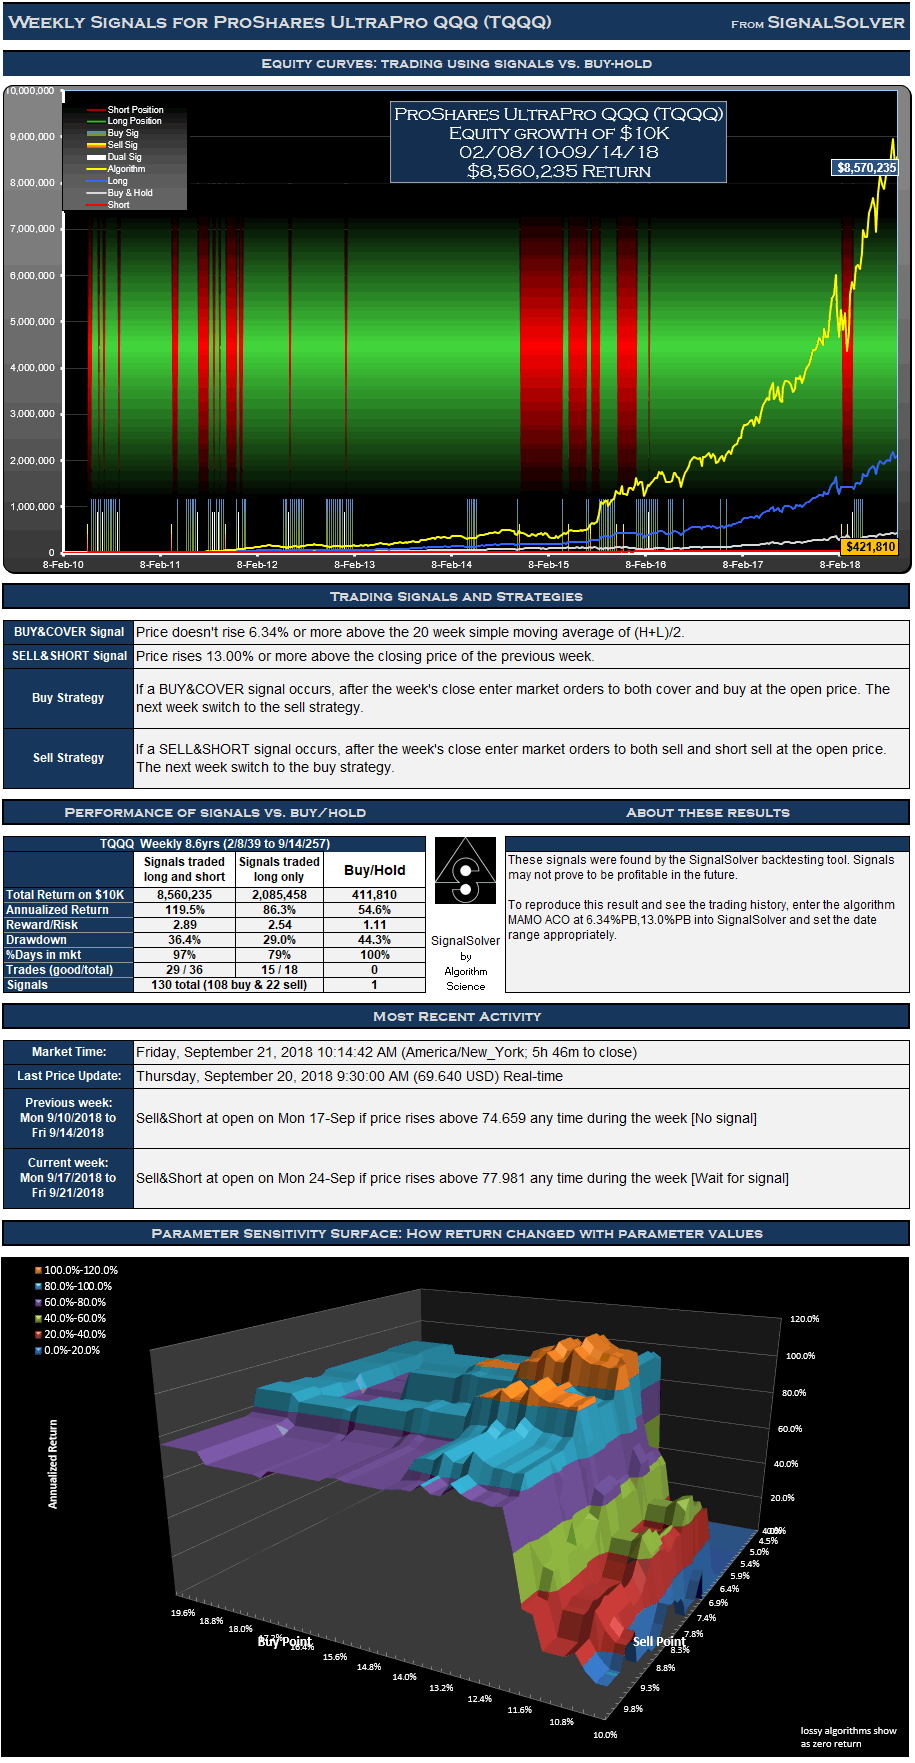
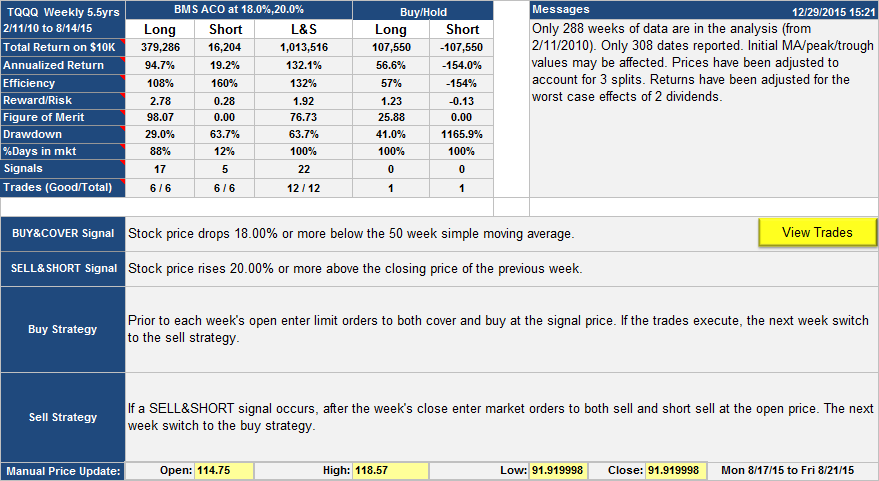
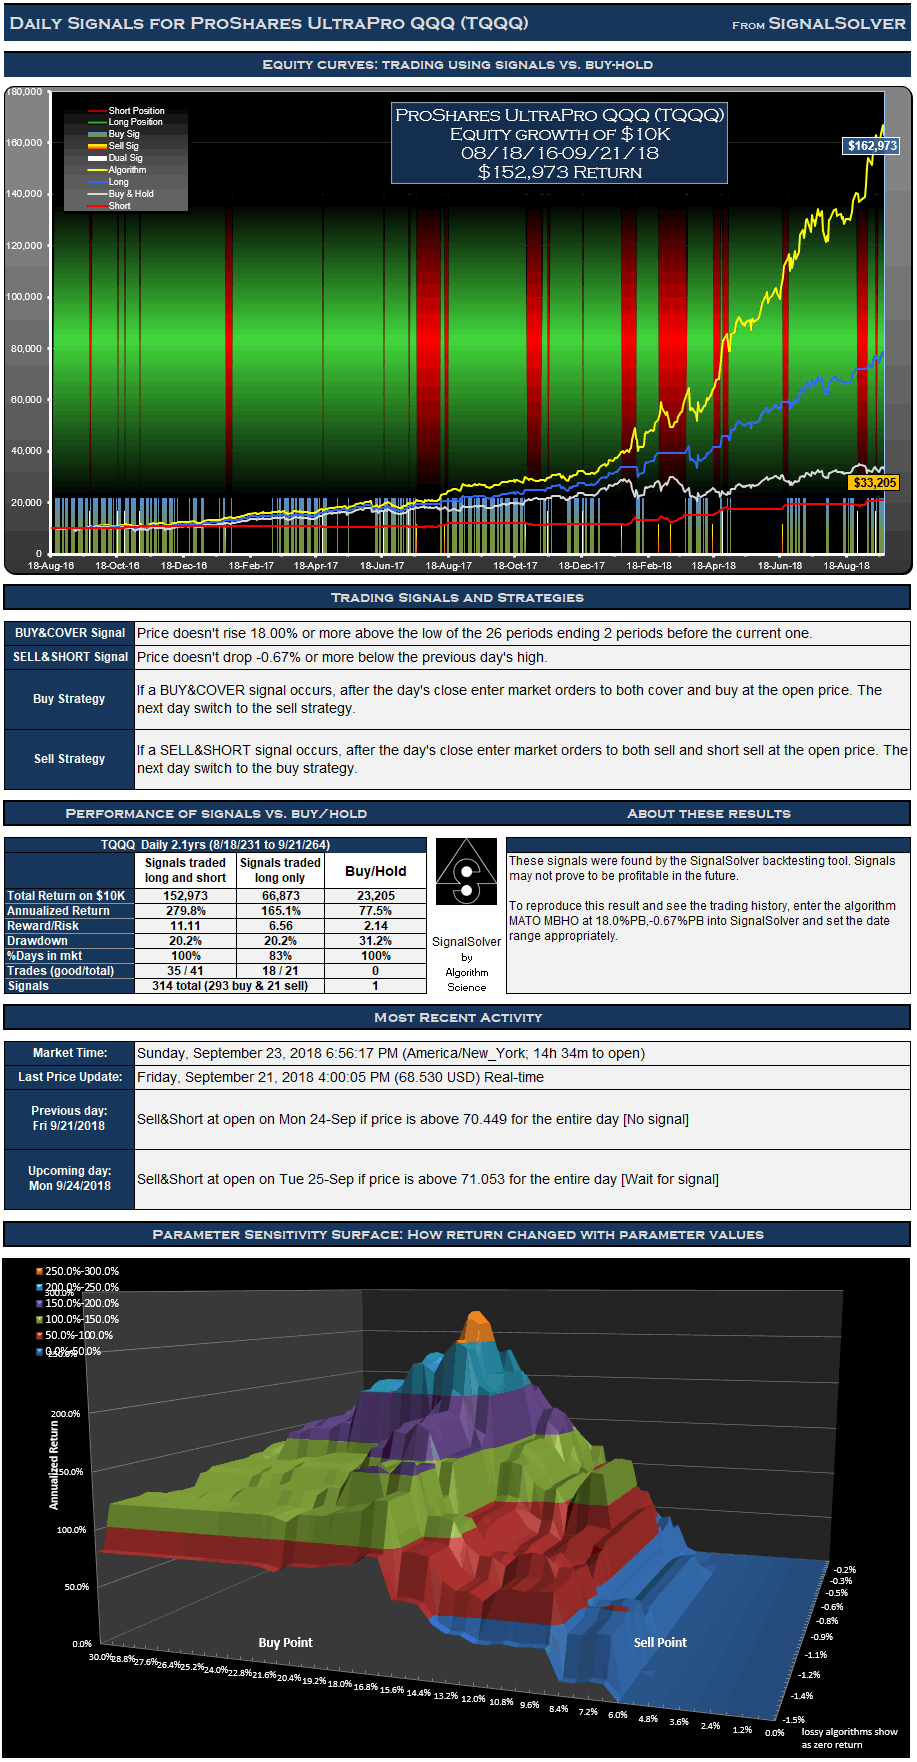
For the 528 day (2.1 year) period from Aug 18 2016 to Sep 21 2018, these signals for TQQQ traded both long and short would have yielded $152,973 in profits from a $10,000 initial investment, an annualized return of 279.8%. Traded long only (no short selling) the signals would have returned $66,873, an annualized return of 165.1%. 82.8% of time was spent holding stock long. The return would have been $23,205 (an annualized return of 77.5%) if you had bought and held the stock for the same period.
Signals and Trades
Not all signals are acted upon and signals are often reinforced in this type of strategy. If you are long in the security, buy signals are not acted on, for example. Similarly if you are short you must ignore sell signals. There were 293 buy signals and 21 sell signals for this particular TQQQ strategy .These led to 21 round trip long trades of which 18 were profitable, and 20 short trades of which 17 were profitable. This is a daily strategy; daily OHLC data is used to derive all signals and there is at most one buy and sell signal and one trade per day.
Drawdown and Reward/Risk
Drawdown (the worst case loss for an single entry and exit into the strategy) was 20% for long-short and 20% for long only. This compares to 31% for buy-hold. The reward/risk for the trading long and short was 11.11 compared to 2.14 for buy-hold, a factor of 5.2 improvement. If traded long only, the reward/risk was 6.56. We use drawdown plus 5% as our risk metric, and annualized return as the reward metric.
The backtests assume a commission per trade of $7. Returns have been adjusted for the worst case effects of 8 dividends.
TQQQ Signals Daily-List of trades
| Day | Buy/Sell | Price |
| 9/17/2018 | Buy | $68.62 |
| 9/14/2018 | Sell | $69.79 |
| 9/7/2018 | Buy | $65.36 |
| 8/28/2018 | Sell | $70.32 |
| 6/26/2018 | Buy | $57.73 |
| 6/21/2018 | Sell | $63.78 |
| 5/2/2018 | Buy | $49.65 |
| 4/27/2018 | Sell | $50.83 |
| 4/25/2018 | Buy | $45.89 |
| 4/18/2018 | Sell | $52.80 |
| 3/26/2018 | Buy | $49.67 |
| 2/27/2018 | Sell | $58.75 |
| 2/7/2018 | Buy | $51.02 |
| 1/24/2018 | Sell | $59.67 |
| 12/20/2017 | Buy | $48.62 |
| 12/19/2017 | Sell | $48.69 |
| 11/20/2017 | Buy | $44.81 |
| 11/17/2017 | Sell | $45.30 |
| 11/13/2017 | Buy | $44.11 |
| 10/30/2017 | Sell | $42.45 |
| 8/18/2017 | Buy | $35.06 |
| 8/15/2017 | Sell | $37.25 |
| 8/11/2017 | Buy | $35.03 |
| 7/20/2017 | Sell | $37.54 |
| 7/14/2017 | Buy | $35.46 |
| 7/13/2017 | Sell | $34.95 |
| 6/21/2017 | Buy | $34.29 |
| 6/20/2017 | Sell | $34.79 |
| 4/26/2017 | Buy | $31.22 |
| 4/25/2017 | Sell | $30.82 |
| 2/1/2017 | Buy | $25.03 |
| 1/26/2017 | Sell | $25.15 |
| 11/9/2016 | Buy | $19.74 |
| 11/8/2016 | Sell | $20.00 |
| 10/26/2016 | Buy | $21.22 |
| 10/25/2016 | Sell | $21.87 |
| 10/20/2016 | Buy | $20.85 |
| 10/19/2016 | Sell | $20.90 |
| 9/26/2016 | Buy | $20.91 |
| 9/23/2016 | Sell | $21.60 |
| 8/22/2016 | Buy | $20.60 |
Update Oct 20th 2019
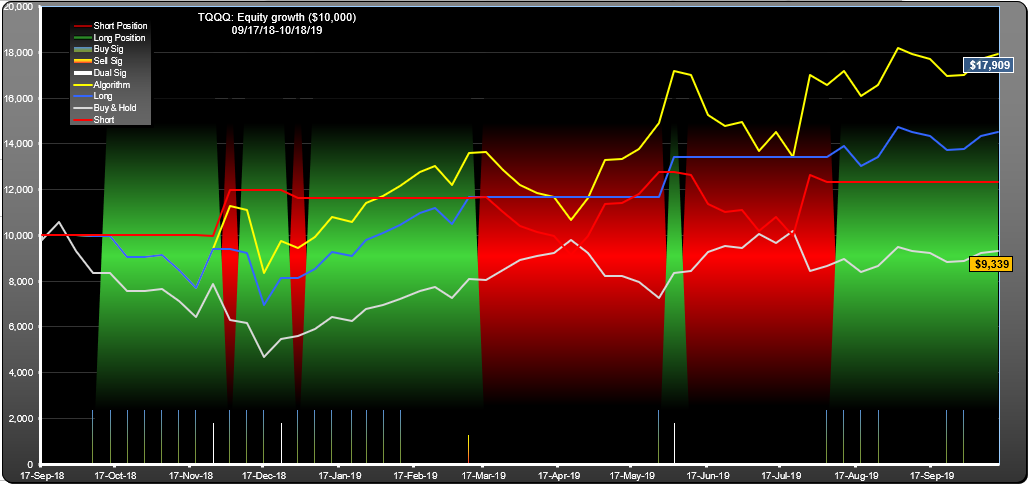

In the subsequent 57 weeks since this initial posting, this algorithm has increased by 79%, an annual percentage rate of 72% compared with a 6.6% loss for the underlying TQQQ.
Drawdown was 26% compared with 56% for TQQQ so the risk-reward was 15 times better than TQQQ short-hold. 31 signals, 9 trades, 5 of them good. Return on 10K was $7909.
Optimum parameters have moved slightly, now 4.11% and 10.55%, but the above metrics are for the original parameters.