A-Z Portfolio June 2015-16 Optimizations
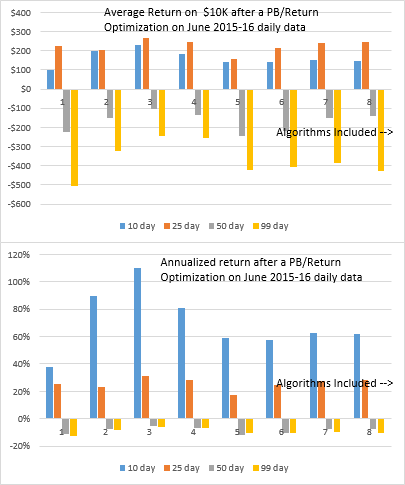
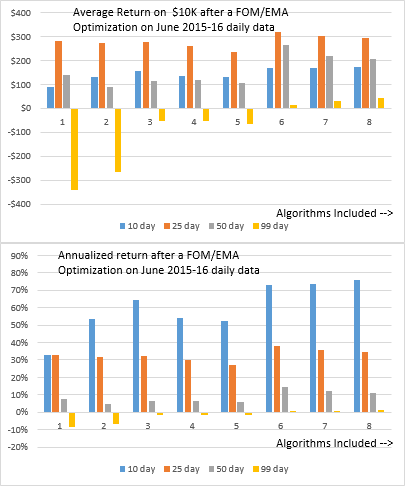
The top graph in each set shows the average return on $10K on running from one to 8 algorithms for a 10day, 25 day, 50 day or 90 day period on the out-of-sample data immediately following the 250 days of data the optimization were run on. So, for example, for the stock A (Agilent), the algorithms were found by using the data from June 15 2015 to June 9th 2016. The 10 day result was on the data from June 13th 2016 to June 24th 2016. The 25 day result was on data June 13th through July 18th 2016, and so on. These are trading days, not calendar days.
The buy-hold performance of this portfolio is shown below:

So if you had correctly guessed to go short for the 10 day period and long after that, you would have made more profit. On the other hand, if you had guessed wrongly, you would have been better off following the algorithms.
A-Z Portfolio Jan 2015-16 Optimizations
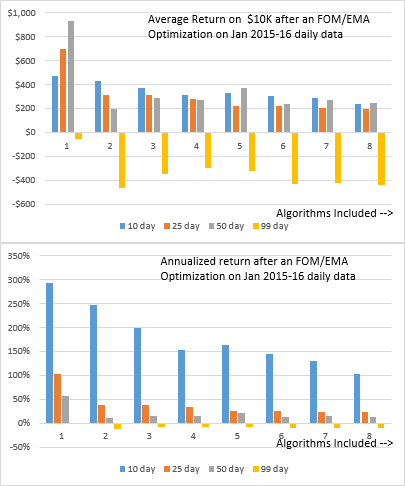 Again we see a breakdown in returns for the 99 day runs, but the shorter time-frame runs are all positive. Buy-hold performance for the same periods are shown below:

Running a single algorithm on each stock in the portfolio realized most of the potential profit for the 10 and 25 day periods, but running for 50 or 99 days gave disappointing results. Averaging across many algorithms did not lead to improvements.
A-Z Portfolio Sept 2014-15 Optimizations
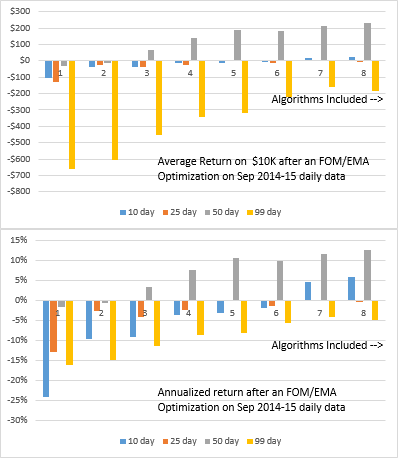 Clearly, the best results for this timeframe were achieved when more algorithms were averaged, however the results were tepid at best and did not exploit the potential of the data, which is hinted at in the buy-hold performance for the portfolio in same time-frame, shown below:

Pingback: Multi-algorithm results for UWTI - Signalgorithm
Pingback: Multi-algorithm study results for NUGT DUST and X - Signalgorithm