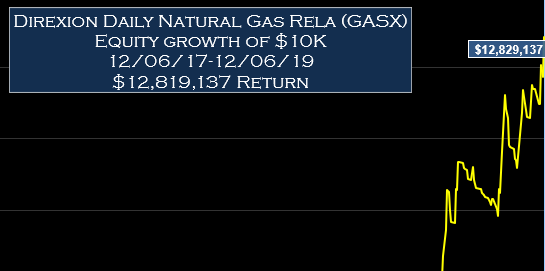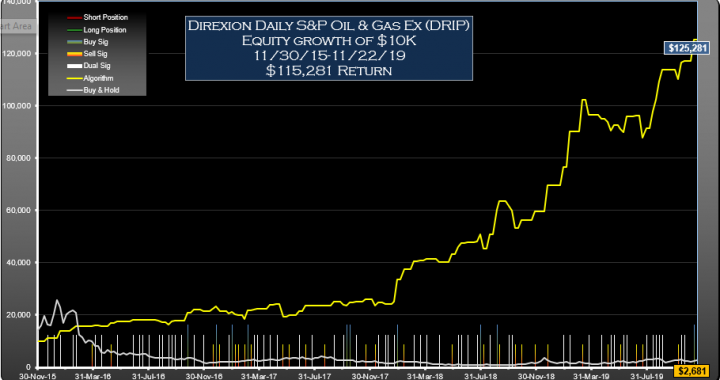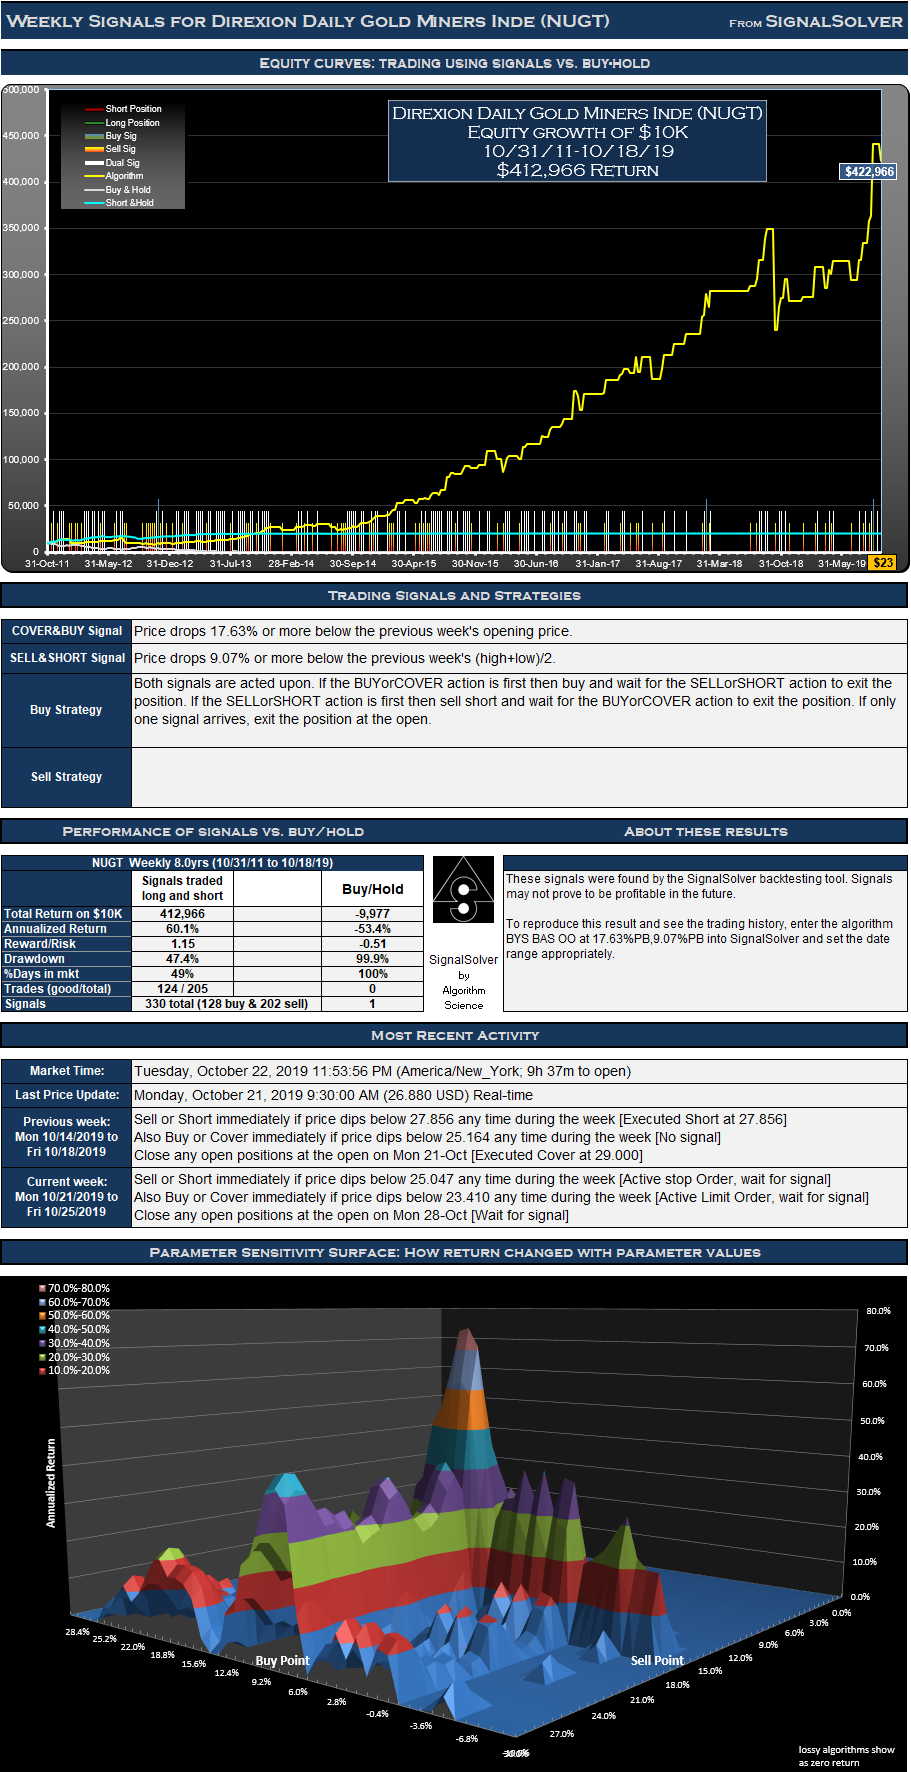
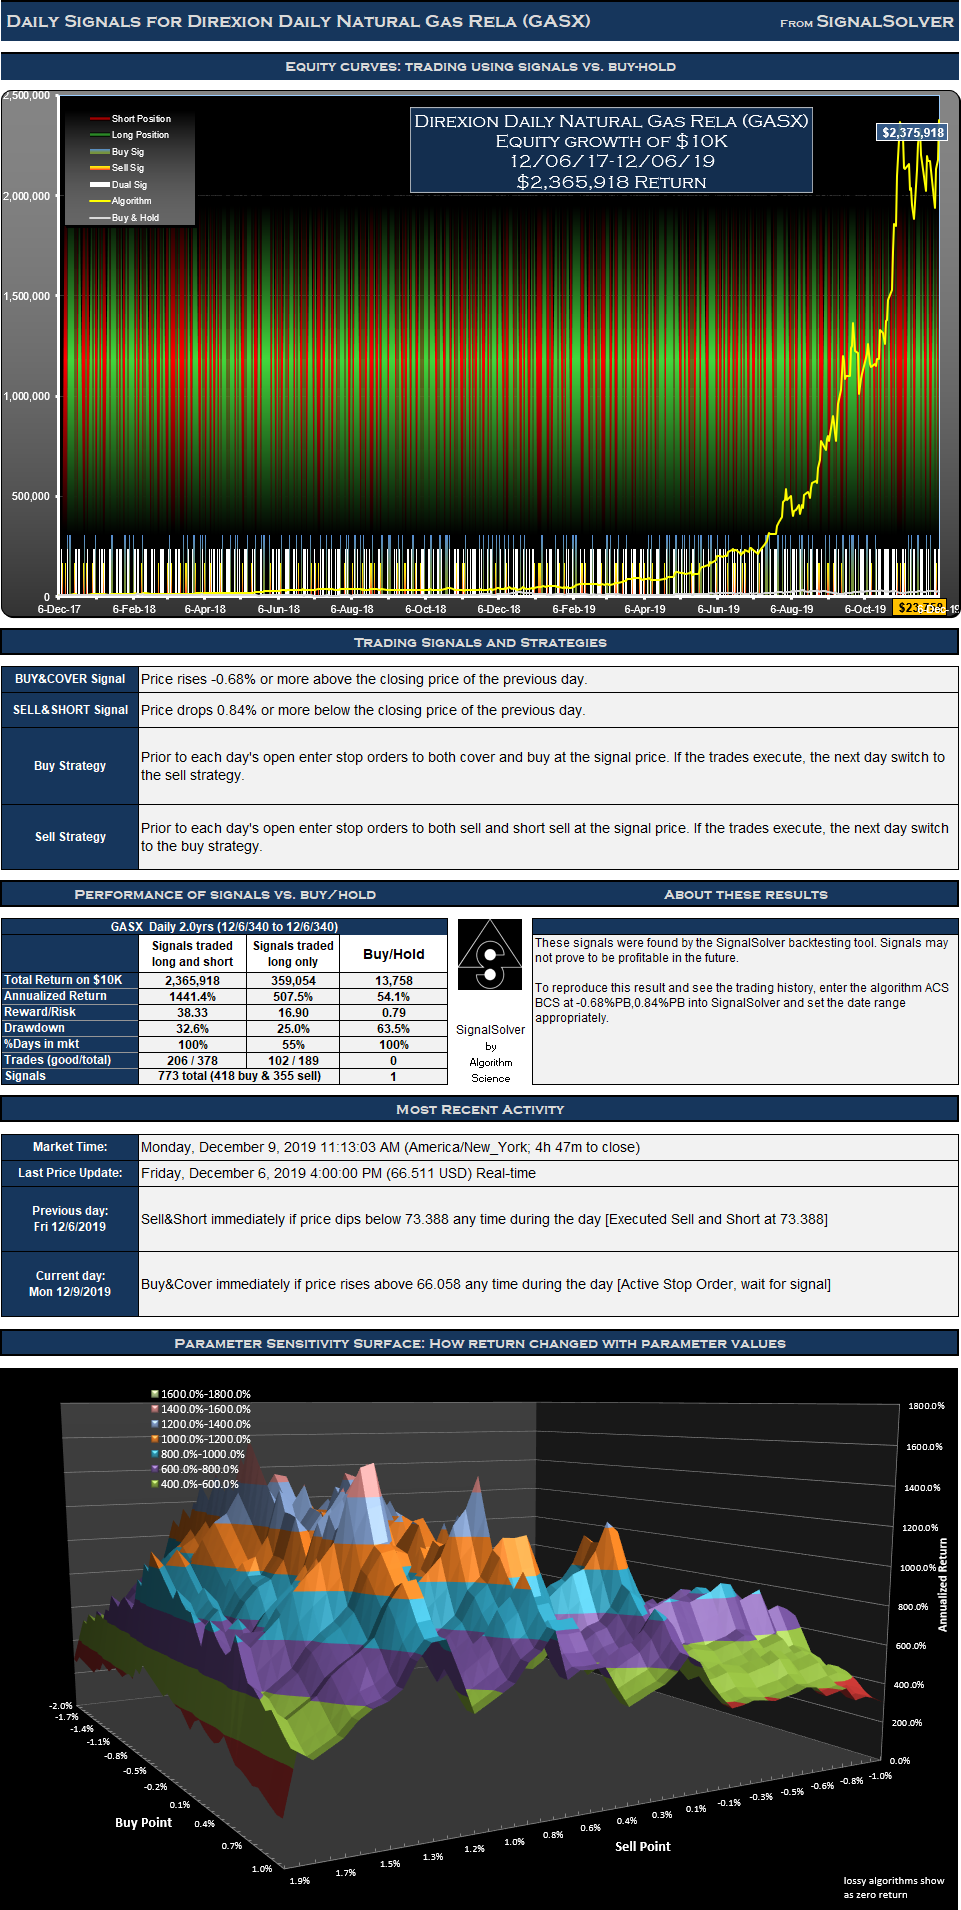
These Direxion Daily Natural Gas Related Bear 3X Shares (GASX) signals traded as directed would have provided returns around 172.0 times better than buy-hold for the period 06-Dec-17 to 06-Dec-19.
GASX Signals
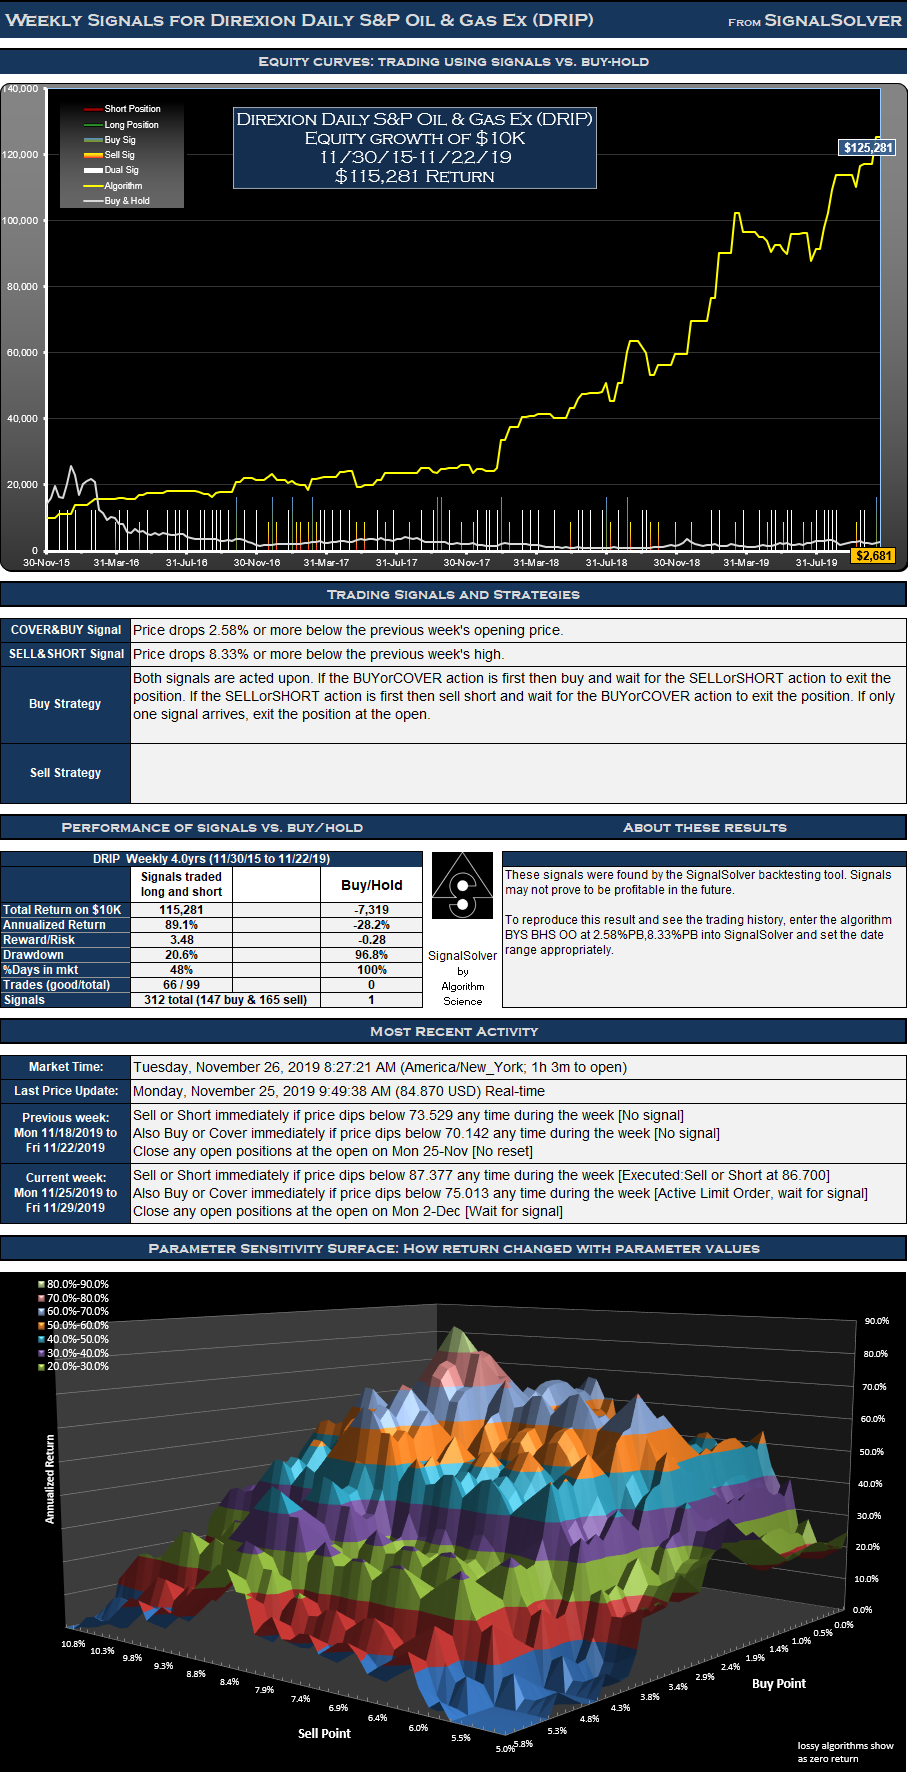
I was able to optimize this algorithm for around $4m return, but I backed off the optimization a bit to account for lifetime and drawdown factors. The trading signals for Direxion Daily Natural Gas Related Bear 3X Shares (GASX) were selected for their reward/risk, longevity and parameter sensitivity characteristics. Backtests don't always generate reliable signals which can be counted on moving forward but many traders find value in knowing what buy and sell signals would have worked well in the past.
You may think the returns are unrealistically high, but the numbers presented are exactly what the strategy would have returned if followed as described (check the math if you are at all dubious). But as noted above, what the future holds is completely unknown.
Returns for the Direxion Daily Natural Gas Rela (GASX) signals
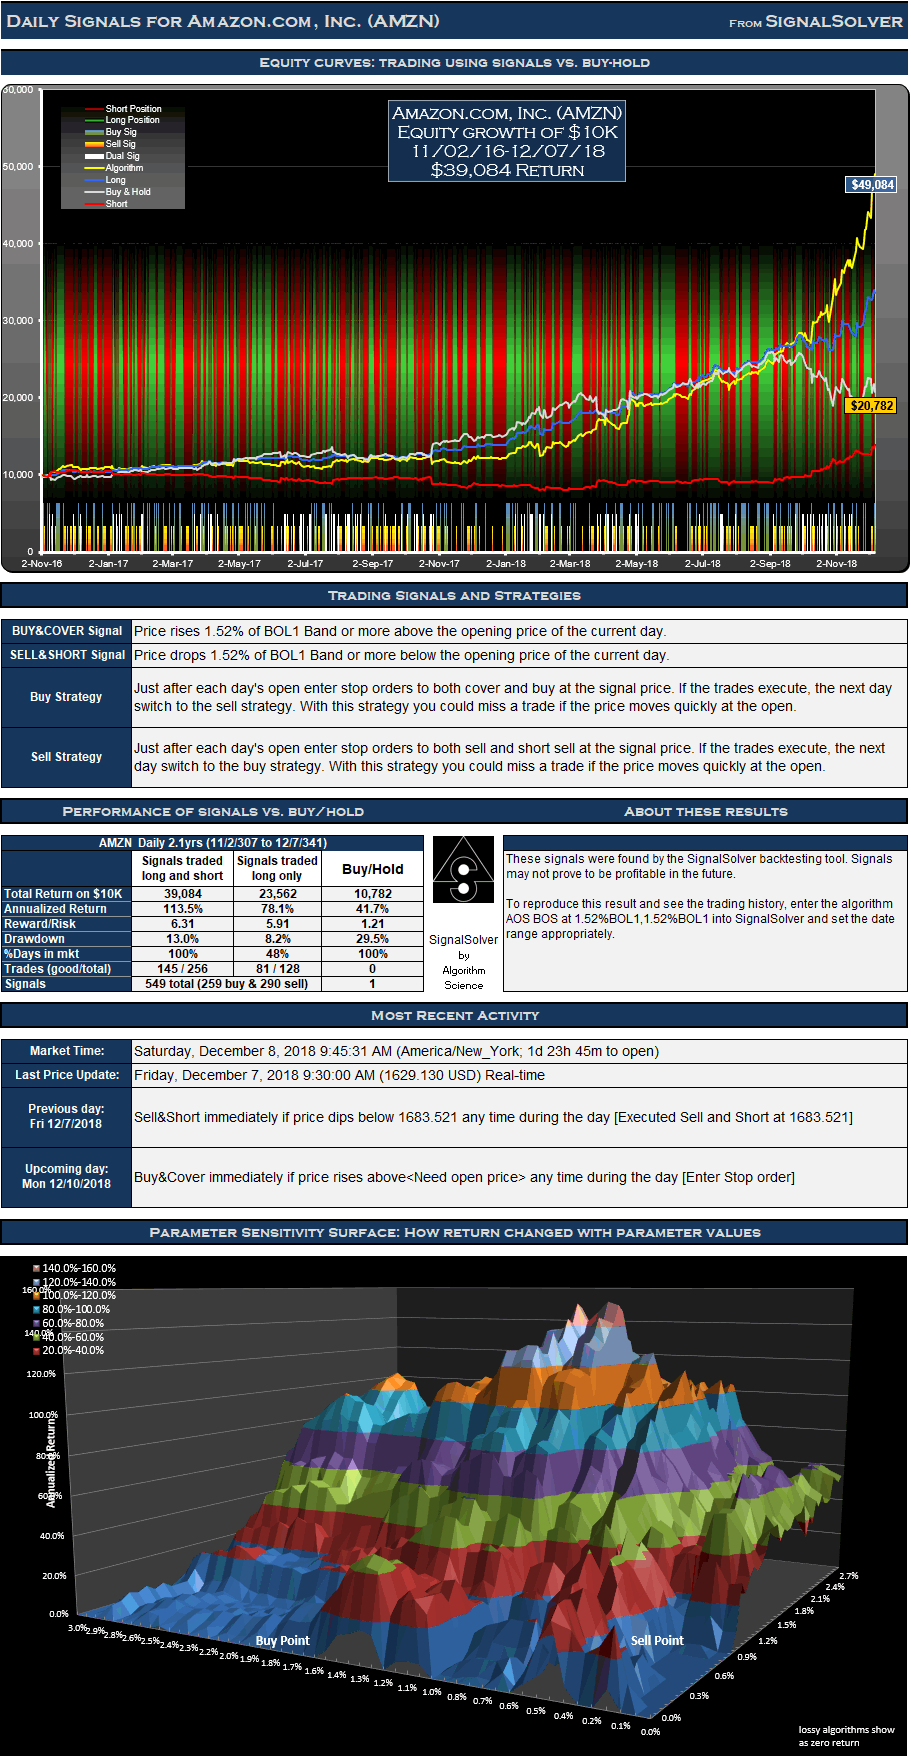
For the 504 day (2.0 year) period from Dec 6 2017 to Dec 6 2019, these signals for Direxion Daily Natural Gas Related Bear 3X Shares (GASX) traded both long and short would have yielded $2,365,918 in profits from a $10,000 initial investment, an annualized return of 1441.4%. Traded long only (no short selling) the signals would have returned $359,054, an annualized return of 507.5%. 54.9% of time was spent holding stock long. The return would have been $13,758 (an annualized return of 54.1%) if you had bought and held the stock for the same period.
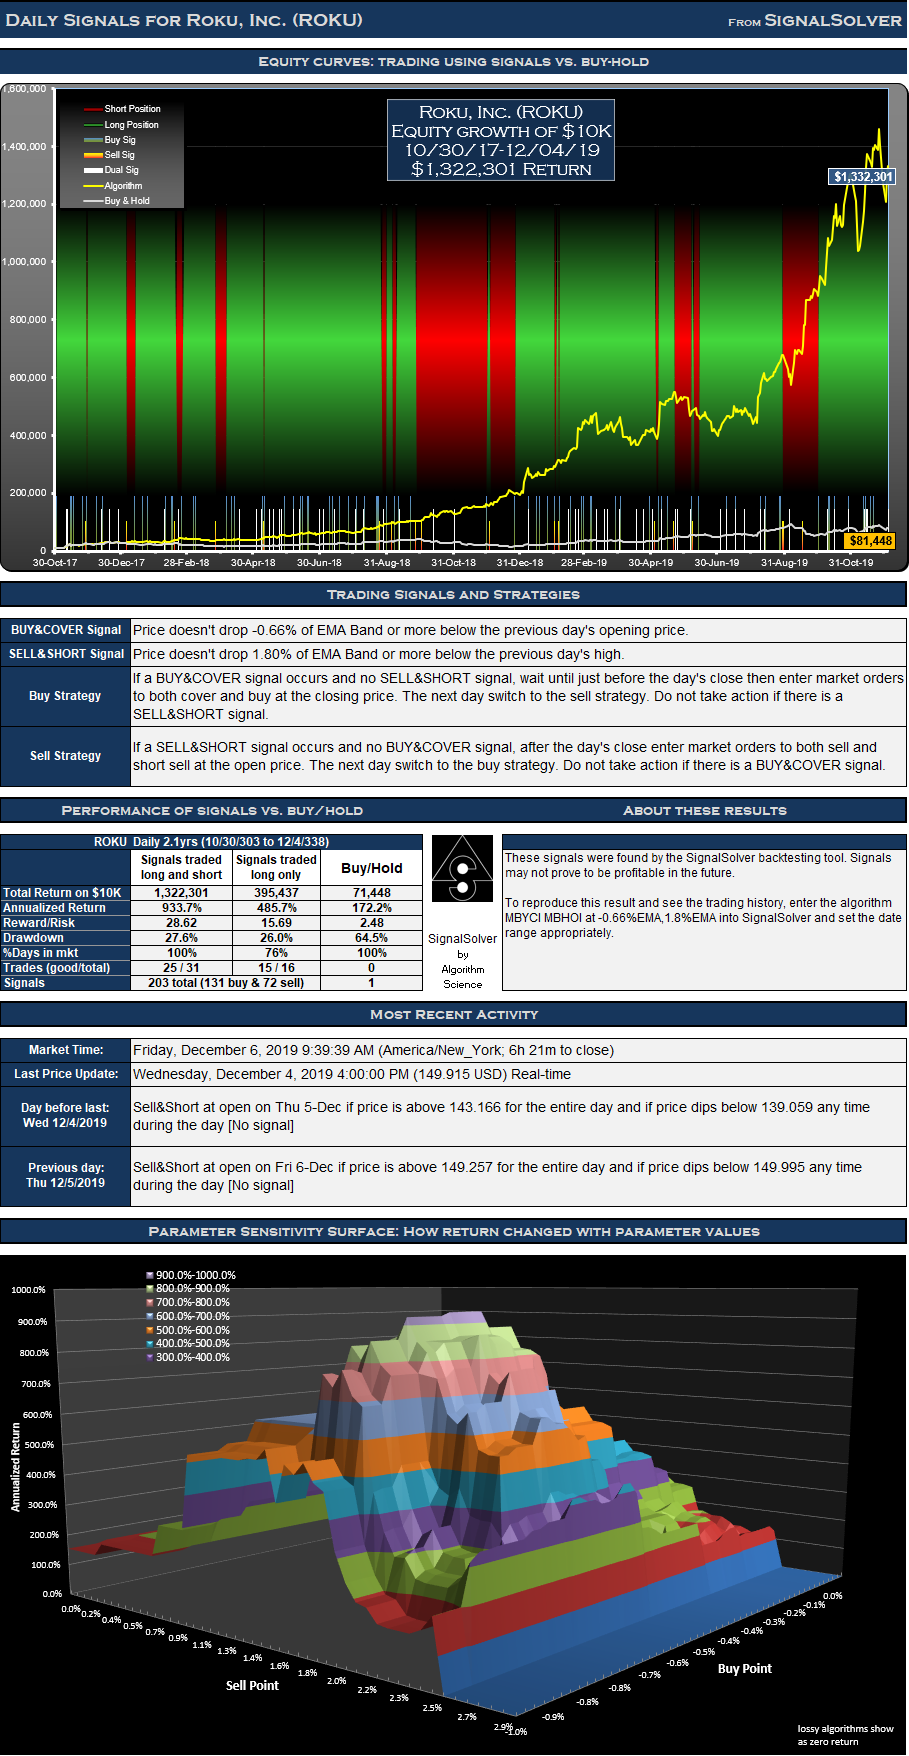
Signals and Trades
We call this a daily strategy as daily OHLC data is used in the numerical analysis leading to at most one buy signal and one sell signal per day. However, not all signals result in trades. If you are already long in a security, buy signals are not acted upon, similarly if you are short you should ignore sell signals. There were 418 buy signals and 355 sell signals for this particular GASX strategy (270 dual signal days) which in turn led to 188 round trip long trades of which 102 were profitable, and 189 short trades of which 104 were profitable.
Drawdown and Reward/Risk
Drawdown (the worst case loss for an single entry and exit into the strategy) was 33% for long-short and 25% for long only. This compares to 63% for buy-hold. The reward/risk for the trading long and short was 38.33 compared to 0.79 for buy-hold, a factor of 48.5 improvement. If traded long only, the reward/risk was 16.90. We use drawdown plus 5% as our risk metric, and annualized return as the reward metric.
The backtests assume a commission per trade of $7. Returns have been adjusted for 6 dividends.
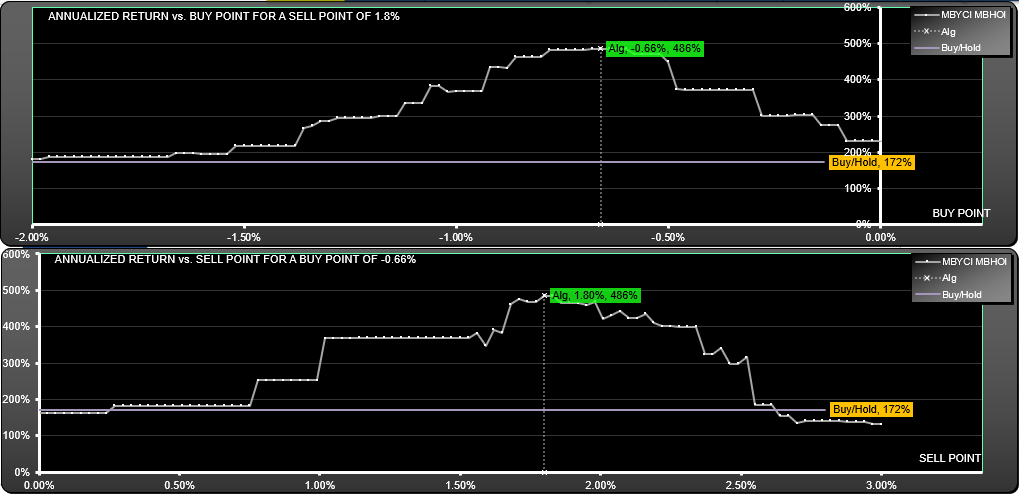
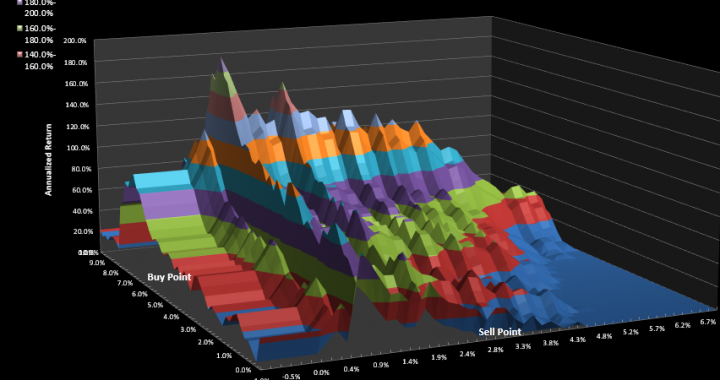
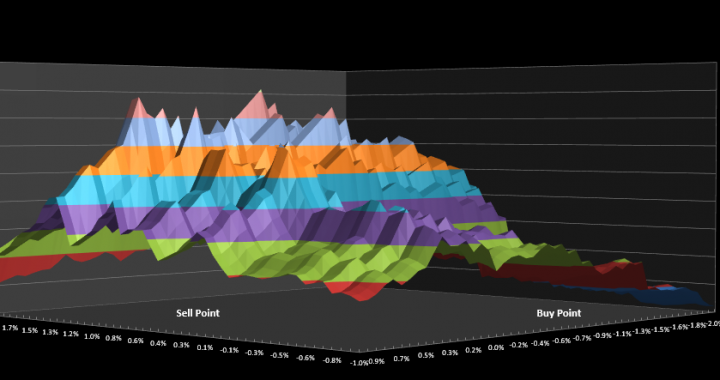
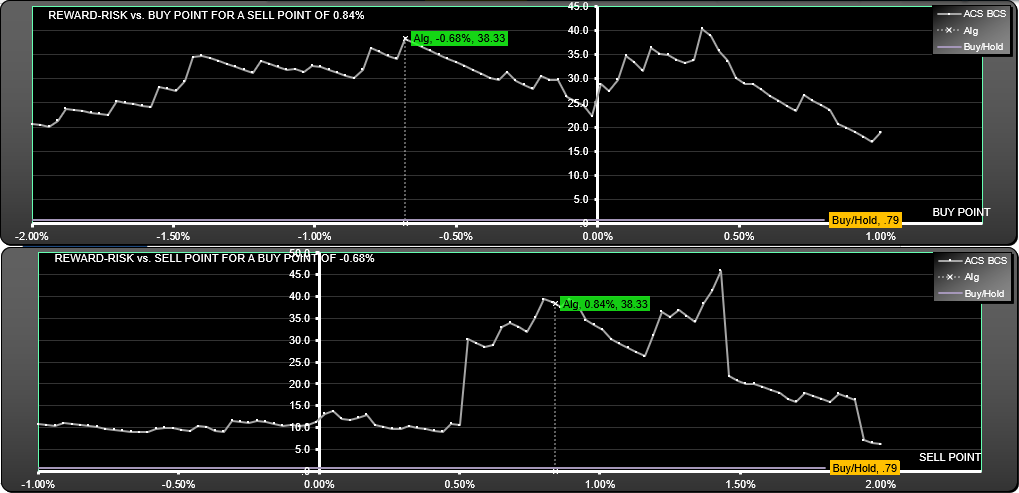
Parameter sensitivity
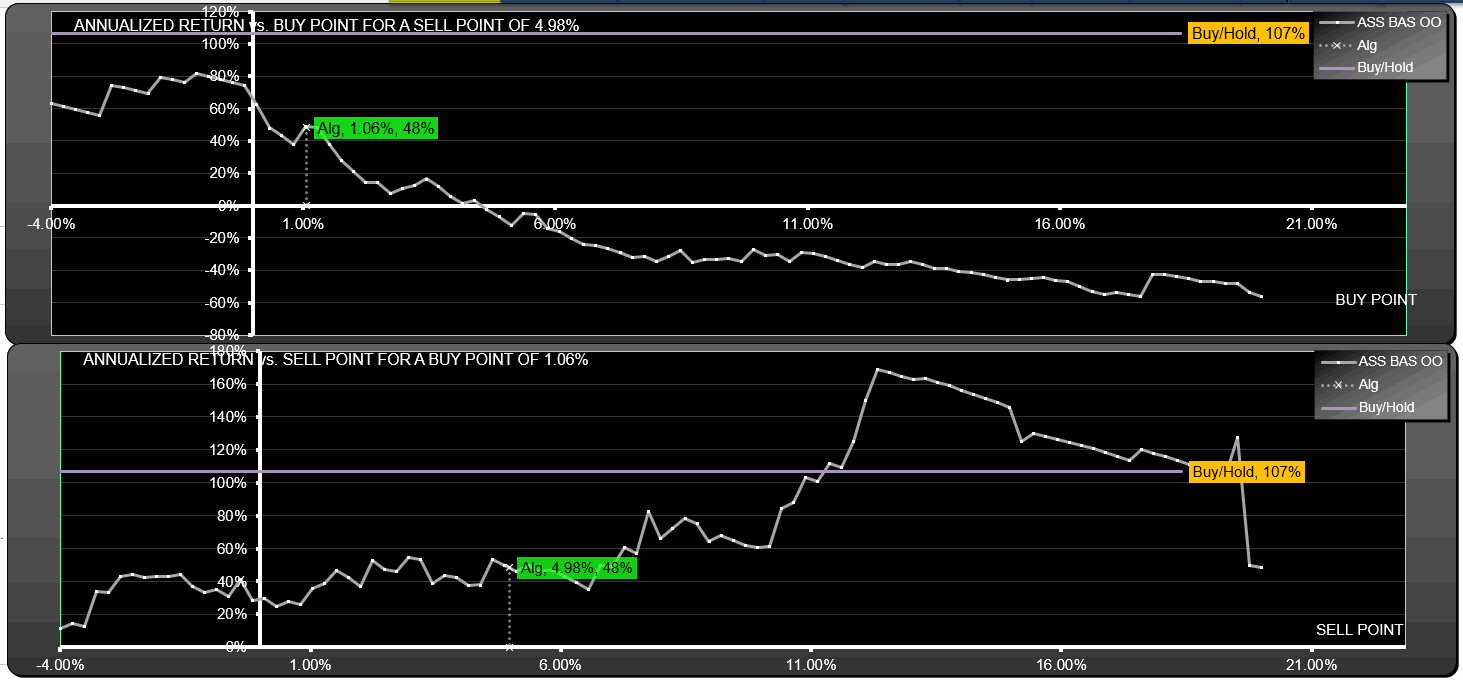
We look for signals which are not too sensitive to changes in the buy or sell point. Here you see the effect on reward-risk when the buy point or sell point is changed. The surface plot above can also be used for this analysis, here we just show the cross section of the surface at the buy and sell points.
Trade List
| Day of signal | Buy or Sell | Price | L&S Value Next Open |
| 12/7/2017 | C/B S | 29.88 | 9,875 |
| 12/7/2017 | S/Sh S | 29.55 | 9,875 |
| 12/8/2017 | Sht S | 28.35 | 9,976 |
| 12/12/2017 | RvL S | 27.89 | 10,065 |
| 12/18/2017 | RvS S | 30.36 | 11,389 |
| 12/19/2017 | RvL S | 28.96 | 11,409 |
| 12/20/2017 | RvS S | 28.57 | 11,542 |
| 12/21/2017 | RvL S | 27.72 | 10,417 |
| 12/22/2017 | RvS S | 24.79 | 10,370 |
| 12/27/2017 | RvL S | 23.10 | 11,004 |
| 12/28/2017 | RvS S | 23.15 | 11,074 |
| 12/29/2017 | RvL S | 22.97 | 10,901 |
| 1/2/2018 | RvS S | 22.64 | 11,522 |
| 1/3/2018 | RvL S | 21.32 | 11,327 |
| 1/4/2018 | RvS S | 20.71 | 11,202 |
| 1/5/2018 | RvL S | 20.65 | 11,458 |
| 1/8/2018 | RvS S | 20.90 | 11,669 |
| 1/9/2018 | RvL S | 20.38 | 11,477 |
| 1/10/2018 | RvS S | 20.20 | 11,480 |
| 1/12/2018 | RvL S | 19.44 | 11,562 |
| 1/16/2018 | RvS S | 18.76 | 10,884 |
| 1/17/2018 | RvL S | 19.77 | 10,843 |
| 1/22/2018 | RvS S | 20.53 | 12,246 |
| 1/23/2018 | RvL S | 18.90 | 11,802 |
| 1/24/2018 | RvS S | 18.30 | 11,589 |
| 1/25/2018 | RvL S | 18.57 | 11,910 |
| 1/26/2018 | RvS S | 19.24 | 11,426 |
| 1/29/2018 | RvL S | 20.00 | 11,988 |
| 1/31/2018 | RvS S | 22.28 | 12,461 |
| 2/1/2018 | RvL S | 22.70 | 12,502 |
| 2/6/2018 | RvS S | 27.55 | 15,774 |
| 2/7/2018 | RvL S | 26.46 | 17,071 |
| 2/8/2018 | RvS S | 28.49 | 15,019 |
| 2/9/2018 | RvL S | 32.09 | 14,674 |
| 2/12/2018 | RvS S | 32.00 | 15,306 |
| 2/13/2018 | RvL S | 30.59 | 16,382 |
| 2/14/2018 | RvS S | 31.15 | 16,897 |
| 2/15/2018 | RvL S | 28.67 | 16,622 |
| 2/16/2018 | RvS S | 28.41 | 16,205 |
| 2/20/2018 | RvL S | 29.10 | 15,824 |
| 2/21/2018 | RvS S | 28.44 | 14,364 |
| 2/22/2018 | RvL S | 31.05 | 13,756 |
| 2/23/2018 | RvS S | 29.77 | 14,628 |
| 2/27/2018 | RvL S | 27.85 | 14,908 |
| 2/28/2018 | RvS S | 28.41 | 13,358 |
| 3/1/2018 | RvL S | 31.34 | 13,316 |
| 3/2/2018 | RvS S | 30.02 | 13,564 |
| 3/6/2018 | RvL S | 26.99 | 15,157 |
| 3/8/2018 | RvS S | 28.55 | 14,909 |
| 3/12/2018 | RvL S | 27.50 | 15,200 |
| 3/13/2018 | RvS S | 26.68 | 14,699 |
| 3/14/2018 | RvL S | 27.09 | 14,636 |
| 3/15/2018 | RvS S | 27.05 | 13,330 |
| 3/19/2018 | RvL S | 28.84 | 14,161 |
| 3/20/2018 | RvS S | 29.94 | 14,506 |
| 3/22/2018 | RvL S | 27.82 | 15,135 |
| 3/23/2018 | RvS S | 27.67 | 14,628 |
| 3/26/2018 | RvL S | 28.42 | 14,254 |
| 3/29/2018 | RvS S | 30.27 | 16,461 |
| 4/2/2018 | RvL S | 28.50 | 17,532 |
| 4/3/2018 | RvS S | 30.38 | 16,872 |
| 4/4/2018 | RvL S | 31.50 | 15,723 |
| 4/5/2018 | RvS S | 29.38 | 16,501 |
| 4/6/2018 | RvL S | 27.90 | 17,440 |
| 4/9/2018 | RvS S | 29.51 | 18,173 |
| 4/11/2018 | RvL S | 26.34 | 18,012 |
| 4/12/2018 | RvS S | 24.60 | 17,457 |
| 4/13/2018 | RvL S | 25.34 | 16,865 |
| 4/16/2018 | RvS S | 24.18 | 16,849 |
| 4/17/2018 | RvL S | 23.87 | 16,179 |
| 4/18/2018 | RvS S | 22.94 | 17,138 |
| 4/19/2018 | RvL S | 21.56 | 17,553 |
| 4/23/2018 | RvS S | 22.15 | 17,852 |
| 4/24/2018 | RvL S | 21.81 | 18,623 |
| 4/25/2018 | RvS S | 22.41 | 18,814 |
| 4/26/2018 | RvL S | 21.86 | 18,776 |
| 4/30/2018 | RvS S | 21.81 | 18,685 |
| 5/1/2018 | RvL S | 21.81 | 18,568 |
| 5/2/2018 | RvS S | 21.51 | 18,088 |
| 5/3/2018 | RvL S | 21.87 | 19,339 |
| 5/4/2018 | RvS S | 23.20 | 20,528 |
| 5/8/2018 | RvL S | 22.10 | 18,952 |
| 5/9/2018 | RvS S | 20.67 | 19,464 |
| 5/10/2018 | RvL S | 19.89 | 19,313 |
| 5/14/2018 | RvS S | 20.10 | 20,208 |
| 5/15/2018 | RvL S | 19.52 | 20,030 |
| 5/16/2018 | RvS S | 19.20 | 20,330 |
| 5/18/2018 | RvL S | 17.73 | 21,311 |
| 5/21/2018 | RvS S | 17.70 | 21,875 |
| 5/22/2018 | RvL S | 17.22 | 23,346 |
| 5/30/2018 | RvS S | 20.54 | 28,028 |
| 5/31/2018 | RvL S | 18.99 | 28,442 |
| 6/1/2018 | RvS S | 19.04 | 27,922 |
| 6/4/2018 | RvL S | 19.27 | 30,533 |
| 6/5/2018 | RvS S | 20.81 | 29,925 |
| 6/6/2018 | RvL S | 20.88 | 29,233 |
| 6/7/2018 | RvS S | 20.47 | 30,675 |
| 6/8/2018 | RvL S | 19.45 | 31,418 |
| 6/11/2018 | RvS S | 19.51 | 31,551 |
| 6/12/2018 | RvL S | 19.00 | 30,989 |
| 6/13/2018 | RvS S | 18.57 | 31,432 |
| 6/14/2018 | RvL S | 18.53 | 32,659 |
| 6/18/2018 | RvS S | 20.69 | 34,958 |
| 6/19/2018 | RvL S | 20.39 | 32,796 |
| 6/20/2018 | RvS S | 19.00 | 33,291 |
| 6/21/2018 | RvL S | 18.54 | 32,302 |
| 6/22/2018 | RvS S | 18.00 | 32,288 |
| 6/25/2018 | RvL S | 18.00 | 34,229 |
| 6/26/2018 | RvS S | 18.97 | 36,112 |
| 6/27/2018 | RvL S | 17.79 | 35,104 |
| 6/28/2018 | RvS S | 17.14 | 34,379 |
| 6/29/2018 | RvL S | 17.34 | 34,682 |
| 7/3/2018 | RvS S | 17.50 | 34,707 |
| 7/5/2018 | RvL S | 17.62 | 33,677 |
| 7/6/2018 | RvS S | 17.25 | 35,243 |
| 7/10/2018 | RvL S | 15.62 | 37,523 |
| 7/12/2018 | RvS S | 16.23 | 37,486 |
| 7/13/2018 | RvL S | 16.55 | 38,717 |
| 7/17/2018 | RvS S | 17.08 | 37,211 |
| 7/18/2018 | RvL S | 17.71 | 35,874 |
| 7/19/2018 | RvS S | 16.94 | 36,293 |
| 7/20/2018 | RvL S | 16.59 | 36,353 |
| 7/23/2018 | RvS S | 16.62 | 35,117 |
| 7/24/2018 | RvL S | 17.18 | 34,939 |
| 7/25/2018 | RvS S | 16.87 | 35,220 |
| 7/26/2018 | RvL S | 16.49 | 35,312 |
| 7/30/2018 | RvS S | 17.74 | 38,714 |
| 7/31/2018 | RvL S | 17.34 | 39,530 |
| 8/2/2018 | RvS S | 17.41 | 37,649 |
| 8/3/2018 | RvL S | 17.95 | 37,215 |
| 8/6/2018 | RvS S | 17.75 | 38,438 |
| 8/7/2018 | RvL S | 17.63 | 38,759 |
| 8/10/2018 | RvS S | 18.44 | 39,164 |
| 8/13/2018 | RvL S | 18.44 | 38,916 |
| 8/14/2018 | RvS S | 18.33 | 35,825 |
| 8/15/2018 | RvL S | 19.78 | 36,300 |
| 8/16/2018 | RvS S | 20.05 | 35,182 |
| 8/17/2018 | RvL S | 20.66 | 34,587 |
| 8/20/2018 | RvS S | 20.29 | 35,930 |
| 8/23/2018 | RvL S | 18.43 | 36,606 |
| 8/24/2018 | RvS S | 17.91 | 36,428 |
| 8/27/2018 | RvL S | 17.99 | 36,151 |
| 8/28/2018 | RvS S | 17.86 | 35,045 |
| 8/30/2018 | RvL S | 18.08 | 36,720 |
| 9/4/2018 | RvS S | 18.47 | 33,779 |
| 9/5/2018 | RvL S | 19.83 | 34,140 |
| 9/10/2018 | RvS S | 20.90 | 34,831 |
| 9/11/2018 | RvL S | 21.34 | 32,484 |
| 9/12/2018 | RvS S | 19.91 | 32,943 |
| 9/13/2018 | RvL S | 19.62 | 32,811 |
| 9/14/2018 | RvS S | 19.55 | 32,579 |
| 9/17/2018 | RvL S | 19.68 | 31,870 |
| 9/18/2018 | RvS S | 19.26 | 32,088 |
| 9/20/2018 | RvL S | 18.33 | 34,085 |
| 9/21/2018 | RvS S | 18.23 | 33,818 |
| 9/24/2018 | RvL S | 18.28 | 32,331 |
| 9/27/2018 | RvS S | 18.72 | 33,654 |
| 9/28/2018 | RvL S | 18.89 | 31,895 |
| 10/1/2018 | RvS S | 17.91 | 32,522 |
| 10/2/2018 | RvL S | 17.67 | 32,670 |
| 10/3/2018 | RvS S | 17.78 | 33,981 |
| 10/4/2018 | RvL S | 16.96 | 34,948 |
| 10/8/2018 | RvS S | 17.32 | 34,446 |
| 10/9/2018 | RvL S | 17.44 | 32,695 |
| 10/12/2018 | RvS S | 18.24 | 34,893 |
| 10/15/2018 | RvL S | 19.09 | 33,230 |
| 10/16/2018 | RvS S | 18.20 | 32,456 |
| 10/17/2018 | RvL S | 18.32 | 34,665 |
| 10/19/2018 | RvS S | 19.74 | 34,856 |
| 10/22/2018 | RvL S | 19.80 | 38,819 |
| 10/25/2018 | RvS S | 26.00 | 44,120 |
| 10/26/2018 | RvL S | 26.92 | 44,073 |
| 10/29/2018 | RvS S | 26.90 | 38,555 |
| 10/30/2018 | RvL S | 30.26 | 33,854 |
| 10/31/2018 | RvS S | 26.58 | 34,870 |
| 11/1/2018 | RvL S | 26.63 | 31,866 |
| 11/2/2018 | RvS S | 25.13 | 32,106 |
| 11/6/2018 | RvL S | 24.11 | 31,386 |
| 11/7/2018 | RvS S | 22.84 | 30,836 |
| 11/8/2018 | RvL S | 23.23 | 33,171 |
| 11/9/2018 | RvS S | 24.42 | 32,979 |
| 11/12/2018 | RvL S | 24.48 | 34,499 |
| 11/13/2018 | RvS S | 26.15 | 34,841 |
| 11/14/2018 | RvL S | 27.76 | 34,364 |
| 11/15/2018 | RvS S | 28.64 | 34,658 |
| 11/16/2018 | RvL S | 28.01 | 35,817 |
| 11/19/2018 | RvS S | 28.38 | 33,273 |
| 11/20/2018 | RvL S | 29.39 | 36,359 |
| 11/21/2018 | RvS S | 32.03 | 35,505 |
| 11/23/2018 | RvL S | 32.67 | 34,633 |
| 11/26/2018 | RvS S | 31.88 | 34,350 |
| 11/27/2018 | RvL S | 32.13 | 35,802 |
| 11/28/2018 | RvS S | 33.23 | 37,398 |
| 11/29/2018 | RvL S | 31.79 | 38,564 |
| 12/3/2018 | RvS S | 30.77 | 37,466 |
| 12/4/2018 | RvL S | 29.35 | 42,442 |
| 12/7/2018 | RvS S | 33.59 | 40,387 |
| 12/10/2018 | RvL S | 35.52 | 40,884 |
| 12/11/2018 | RvS S | 35.97 | 41,052 |
| 12/13/2018 | RvL S | 36.75 | 41,301 |
| 12/17/2018 | RvS S | 41.52 | 39,523 |
| 12/18/2018 | RvL S | 46.69 | 41,599 |
| 12/19/2018 | RvS S | 48.59 | 37,268 |
| 12/20/2018 | RvL S | 53.12 | 39,743 |
| 12/21/2018 | RvS S | 55.93 | 35,048 |
| 12/24/2018 | RvL S | 61.86 | 38,874 |
| 12/26/2018 | RvS S | 68.06 | 46,269 |
| 12/27/2018 | RvL S | 54.40 | 41,511 |
| 12/28/2018 | RvS S | 48.86 | 38,397 |
| 12/31/2018 | RvL S | 53.10 | 40,702 |
| 1/2/2019 | RvS S | 52.69 | 41,445 |
| 1/3/2019 | RvL S | 47.64 | 39,613 |
| 1/4/2019 | RvS S | 45.84 | 45,361 |
| 1/10/2019 | RvL S | 33.43 | 50,019 |
| 1/14/2019 | RvS S | 32.84 | 49,710 |
| 1/16/2019 | RvL S | 31.19 | 53,052 |
| 1/17/2019 | RvS S | 30.96 | 51,933 |
| 1/18/2019 | RvL S | 30.69 | 51,614 |
| 1/23/2019 | RvS S | 31.65 | 49,385 |
| 1/24/2019 | RvL S | 34.10 | 46,765 |
| 1/25/2019 | RvS S | 32.30 | 46,245 |
| 1/28/2019 | RvL S | 32.65 | 45,848 |
| 1/29/2019 | RvS S | 32.38 | 47,788 |
| 1/30/2019 | RvL S | 31.63 | 43,937 |
| 2/1/2019 | RvS S | 31.73 | 45,823 |
| 2/4/2019 | RvL S | 32.53 | 44,331 |
| 2/11/2019 | RvS S | 39.83 | 61,476 |
| 2/14/2019 | RvL S | 34.07 | 61,692 |
| 2/15/2019 | RvS S | 32.75 | 63,656 |
| 2/19/2019 | RvL S | 31.70 | 62,277 |
| 2/20/2019 | RvS S | 30.46 | 62,069 |
| 2/21/2019 | RvL S | 30.00 | 64,103 |
| 2/22/2019 | RvS S | 30.99 | 63,014 |
| 2/25/2019 | RvL S | 31.51 | 61,320 |
| 2/26/2019 | RvS S | 30.62 | 59,250 |
| 2/27/2019 | RvL S | 32.14 | 57,831 |
| 2/28/2019 | RvS S | 31.96 | 57,654 |
| 3/4/2019 | RvL S | 30.78 | 58,694 |
| 3/7/2019 | RvS S | 32.60 | 57,357 |
| 3/8/2019 | RvL S | 35.74 | 59,140 |
| 3/11/2019 | RvS S | 36.55 | 61,501 |
| 3/14/2019 | RvL S | 31.20 | 68,576 |
| 3/18/2019 | RvS S | 31.70 | 74,075 |
| 3/19/2019 | RvL S | 29.43 | 75,217 |
| 3/20/2019 | RvS S | 30.01 | 79,271 |
| 3/21/2019 | RvL S | 28.02 | 78,917 |
| 3/25/2019 | RvS S | 30.10 | 87,473 |
| 3/27/2019 | RvL S | 28.52 | 92,533 |
| 3/28/2019 | RvS S | 28.83 | 93,843 |
| 3/29/2019 | RvL S | 28.01 | 92,064 |
| 4/1/2019 | RvS S | 27.71 | 93,591 |
| 4/2/2019 | RvL S | 27.25 | 95,618 |
| 4/3/2019 | RvS S | 27.81 | 87,529 |
| 4/4/2019 | RvL S | 30.18 | 83,739 |
| 4/5/2019 | RvS S | 28.93 | 89,976 |
| 4/8/2019 | RvL S | 26.77 | 89,323 |
| 4/10/2019 | RvS S | 27.40 | 89,209 |
| 4/11/2019 | RvL S | 28.25 | 81,365 |
| 4/12/2019 | RvS S | 25.77 | 81,287 |
| 4/15/2019 | RvL S | 25.79 | 81,904 |
| 4/16/2019 | RvS S | 25.96 | 82,489 |
| 4/17/2019 | RvL S | 25.74 | 84,301 |
| 4/22/2019 | RvS S | 26.64 | 89,638 |
| 4/23/2019 | RvL S | 25.30 | 88,384 |
| 4/29/2019 | RvS S | 28.24 | 100,384 |
| 4/30/2019 | RvL S | 28.44 | 105,174 |
| 5/3/2019 | RvS S | 34.74 | 122,455 |
| 5/6/2019 | RvL S | 34.41 | 120,164 |
| 5/8/2019 | RvS S | 33.01 | 117,199 |
| 5/9/2019 | RvL S | 33.08 | 115,803 |
| 5/10/2019 | RvS S | 32.29 | 114,950 |
| 5/13/2019 | RvL S | 32.12 | 119,874 |
| 5/14/2019 | RvS S | 33.50 | 120,969 |
| 5/15/2019 | RvL S | 33.19 | 110,168 |
| 5/16/2019 | RvS S | 30.23 | 107,166 |
| 5/17/2019 | RvL S | 31.05 | 113,536 |
| 5/21/2019 | RvS S | 33.12 | 118,042 |
| 5/22/2019 | RvL S | 32.03 | 136,048 |
| 5/24/2019 | RvS S | 39.88 | 146,809 |
| 5/28/2019 | RvL S | 39.99 | 159,833 |
| 6/3/2019 | RvS S | 46.23 | 176,494 |
| 6/5/2019 | RvL S | 42.44 | 202,429 |
| 6/6/2019 | RvS S | 46.65 | 203,968 |
| 6/7/2019 | RvL S | 46.08 | 202,803 |
| 6/10/2019 | RvS S | 45.82 | 197,567 |
| 6/11/2019 | RvL S | 47.85 | 203,310 |
| 6/13/2019 | RvS S | 49.60 | 204,430 |
| 6/14/2019 | RvL S | 48.77 | 224,931 |
| 6/17/2019 | RvS S | 52.06 | 230,895 |
| 6/19/2019 | RvL S | 47.22 | 229,330 |
| 6/20/2019 | RvS S | 45.46 | 234,309 |
| 6/21/2019 | RvL S | 44.66 | 232,615 |
| 6/24/2019 | RvS S | 44.53 | 217,296 |
| 6/25/2019 | RvL S | 47.46 | 210,395 |
| 6/26/2019 | RvS S | 46.08 | 221,703 |
| 6/27/2019 | RvL S | 43.60 | 215,740 |
| 6/28/2019 | RvS S | 42.43 | 234,233 |
| 7/1/2019 | RvL S | 41.42 | 222,484 |
| 7/3/2019 | RvS S | 45.65 | 243,570 |
| 7/5/2019 | RvL S | 45.63 | 232,827 |
| 7/8/2019 | RvS S | 43.24 | 217,267 |
| 7/9/2019 | RvL S | 45.78 | 212,792 |
| 7/10/2019 | RvS S | 44.84 | 225,353 |
| 7/11/2019 | RvL S | 42.27 | 239,663 |
| 7/12/2019 | RvS S | 44.72 | 240,566 |
| 7/15/2019 | RvL S | 44.29 | 260,723 |
| 7/19/2019 | RvS S | 56.81 | 314,251 |
| 7/22/2019 | RvL S | 55.70 | 311,416 |
| 7/23/2019 | RvS S | 54.74 | 311,924 |
| 7/24/2019 | RvL S | 54.18 | 310,845 |
| 7/30/2019 | RvS S | 68.53 | 474,578 |
| 7/31/2019 | RvL S | 55.76 | 481,036 |
| 8/2/2019 | RvS S | 63.74 | 482,535 |
| 8/5/2019 | RvL S | 69.99 | 503,203 |
| 8/6/2019 | RvS S | 72.99 | 438,041 |
| 8/7/2019 | RvL S | 82.44 | 404,235 |
| 8/8/2019 | RvS S | 76.08 | 427,173 |
| 8/9/2019 | RvL S | 73.52 | 433,702 |
| 8/13/2019 | RvS S | 77.81 | 413,011 |
| 8/14/2019 | RvL S | 82.95 | 456,462 |
| 8/16/2019 | RvS S | 89.10 | 506,185 |
| 8/20/2019 | RvL S | 72.87 | 511,944 |
| 8/21/2019 | RvS S | 71.14 | 494,587 |
| 8/22/2019 | RvL S | 74.65 | 541,109 |
| 8/26/2019 | RvS S | 86.93 | 577,277 |
| 8/27/2019 | RvL S | 87.78 | 567,311 |
| 8/28/2019 | RvS S | 88.74 | 640,622 |
| 8/30/2019 | RvL S | 71.54 | 774,836 |
| 9/4/2019 | RvS S | 77.10 | 786,938 |
| 9/6/2019 | RvL S | 69.36 | 774,975 |
| 9/9/2019 | RvS S | 66.93 | 902,326 |
| 9/10/2019 | RvL S | 57.69 | 868,043 |
| 9/11/2019 | RvS S | 56.79 | 818,964 |
| 9/12/2019 | RvL S | 60.00 | 778,685 |
| 9/13/2019 | RvS S | 57.05 | 962,113 |
| 9/17/2019 | RvL S | 38.64 | 1,199,991 |
| 9/19/2019 | RvS S | 44.05 | 1,086,429 |
| 9/20/2019 | RvL S | 47.81 | 1,098,911 |
| 9/27/2019 | RvS S | 57.66 | 1,224,695 |
| 9/30/2019 | RvL S | 60.85 | 1,217,234 |
| 10/1/2019 | RvS S | 60.06 | 1,011,179 |
| 10/2/2019 | RvL S | 69.88 | 1,085,107 |
| 10/3/2019 | RvS S | 72.28 | 1,110,493 |
| 10/4/2019 | RvL S | 68.41 | 1,129,288 |
| 10/9/2019 | RvS S | 78.37 | 1,212,377 |
| 10/10/2019 | RvL S | 81.46 | 1,159,231 |
| 10/11/2019 | RvS S | 77.89 | 1,148,054 |
| 10/14/2019 | RvL S | 78.64 | 1,160,011 |
| 10/15/2019 | RvS S | 78.02 | 1,150,920 |
| 10/16/2019 | RvL S | 77.20 | 1,188,027 |
| 10/17/2019 | RvS S | 79.22 | 1,184,850 |
| 10/18/2019 | RvL S | 78.96 | 1,332,190 |
| 10/21/2019 | RvS S | 85.77 | 1,316,822 |
| 10/22/2019 | RvL S | 83.97 | 1,261,667 |
| 10/23/2019 | RvS S | 80.11 | 1,372,977 |
| 10/24/2019 | RvL S | 74.87 | 1,378,959 |
| 10/25/2019 | RvS S | 75.84 | 1,480,745 |
| 10/28/2019 | RvL S | 70.02 | 1,529,387 |
| 10/29/2019 | RvS S | 73.50 | 1,719,349 |
| 10/30/2019 | RvL S | 67.00 | 1,858,833 |
| 10/31/2019 | RvS S | 74.55 | 1,848,061 |
| 11/5/2019 | RvL S | 55.62 | 2,317,776 |
| 11/6/2019 | RvS S | 55.09 | 2,291,816 |
| 11/8/2019 | RvL S | 59.00 | 2,133,689 |
| 11/12/2019 | RvS S | 59.51 | 2,029,346 |
| 11/13/2019 | RvL S | 63.00 | 2,036,741 |
| 11/14/2019 | RvS S | 63.23 | 1,951,689 |
| 11/15/2019 | RvL S | 65.87 | 1,884,120 |
| 11/20/2019 | RvS S | 76.23 | 2,330,321 |
| 11/21/2019 | RvL S | 74.74 | 2,202,410 |
| 11/22/2019 | RvS S | 71.36 | 2,166,071 |
| 11/25/2019 | RvL S | 72.41 | 2,023,069 |
| 11/27/2019 | RvS S | 73.10 | 2,172,669 |
| 11/29/2019 | RvL S | 73.57 | 2,173,245 |
| 12/2/2019 | RvS S | 73.59 | 1,983,934 |
| 12/3/2019 | RvL S | 80.00 | 1,937,794 |
| 12/4/2019 | RvS S | 78.14 | 2,132,202 |
| 12/5/2019 | RvL S | 71.24 | 2,175,949 |
| 12/6/2019 | RvS S | 73.39 | 2,375,918 |
| 12/9/2019 | Last | 66.51 | 2,375,918 |
Split adjusted prices used throughout.
Key:
RvL S: Reverse Long at signal price (go from a short position to a long position by covering and buying)
RvS S: Reverse Short at signal price (go from a long position to a short position by selling then shorting)
Cov S: Cover at the signal price
Buy S: Buy at the signal price
Sht S: Short at the signal price
Sell S: Sell at the signal price
C/B S: Cover or buy at the signal price (not clear which signal came first)
S/Sh S: Sell or short at the signal price (not clear which signal came first)
Cov o: Cover a short position at the subsequent weekly open
Sell o: Close a long position at the subsequent weekly open
Update 1/9/20
Showing trades from 12/4 as this was the last clear signal before publication.
| Day of signal | Buy or Sell | Price | L&S Value Next Open |
| 12/4/2019 | Sht S | 78.14 | 10,996 |
| 12/5/2019 | RvL S | 71.24 | 11,207 |
| 12/6/2019 | RvS S | 73.39 | 11,873 |
| 12/9/2019 | RvL S | 68.80 | 10,595 |
| 12/10/2019 | RvS S | 61.17 | 10,732 |
| 12/11/2019 | RvL S | 60.00 | 10,807 |
| 12/12/2019 | RvS S | 60.28 | 12,017 |
| 12/13/2019 | RvL S | 53.24 | 12,365 |
| 12/16/2019 | RvS S | 54.87 | 12,979 |
| 12/17/2019 | RvL S | 52.08 | 12,315 |
| 12/18/2019 | RvS S | 47.84 | 12,355 |
| 12/19/2019 | RvL S | 46.00 | 11,604 |
| 12/20/2019 | RvS S | 43.25 | 10,997 |
| 12/23/2019 | RvL S | 45.46 | 9,858 |
| 12/24/2019 | RvS S | 40.70 | 9,851 |
| 12/27/2019 | RvL S | 40.41 | 10,503 |
| 12/30/2019 | RvS S | 42.96 | 10,192 |
| 12/31/2019 | RvL S | 44.10 | 9,349 |
| 1/2/2020 | RvS S | 40.51 | 9,453 |
| 1/6/2020 | RvL S | 39.87 | 9,140 |
| 1/7/2020 | RvS S | 38.48 | 9,335 |
| 1/8/2020 | RvL S | 37.60 | 10,392 |